More Related Content
Similar to 8 e, 8w, westlake metrics
Similar to 8 e, 8w, westlake metrics (8)
8 e, 8w, westlake metrics
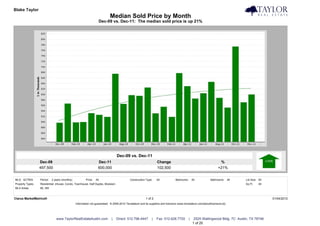
- 1. Blake Taylor Taylor Real Estate
Median Sold Price by Month
Dec-09 vs. Dec-11: The median sold price is up 21%
Dec-09 vs. Dec-11
Dec-09 Dec-11 Change %
497,500 600,000 102,500 +21%
MLS: ACTRIS Period: 2 years (monthly) Price: All Construction Type: All Bedrooms: All Bathrooms: All Lot Size: All
Property Types: Residential: (House, Condo, Townhouse, Half Duplex, Modular) Sq Ft: All
MLS Areas: 8E, 8W
Clarus MarketMetrics® 1 of 2 01/04/2012
Information not guaranteed. © 2009-2010 Terradatum and its suppliers and licensors (www.terradatum.com/about/licensors.td).
www.TaylorRealEstateAustin.com | Direct: 512.796.4447 | Fax: 512.628.7720 | 2525 Wallingwood Bldg. 7C Austin, TX 78746
1 of 20
- 2. Blake Taylor Taylor Real Estate
Median Sold Price by Month
Dec-09 vs. Dec-11: The median sold price is up 21%
Time Period Median Price # Units Average DOM
Dec-11 600,000 32 79
Nov-11 571,500 30 106
Oct-11 774,000 37 78
Sep-11 552,500 42 77
Aug-11 587,500 52 73
Jul-11 645,500 70 71
Jun-11 604,500 66 75
May-11 585,000 60 68
Apr-11 630,000 59 81
Mar-11 677,500 39 138
Feb-11 518,476 26 84
Jan-11 555,250 24 81
Dec-10 531,344 38 105
Nov-10 625,000 35 99
Oct-10 595,000 23 80
Sep-10 597,500 29 73
Aug-10 565,750 48 90
Jul-10 675,000 59 68
Jun-10 518,500 76 79
May-10 526,000 56 64
Apr-10 532,000 48 86
Mar-10 500,000 37 73
Feb-10 498,700 34 86
Jan-10 566,875 28 82
Dec-09 497,500 34 104
Clarus MarketMetrics® 2 of 2 01/04/2012
Information not guaranteed. © 2009-2010 Terradatum and its suppliers and licensors (www.terradatum.com/about/licensors.td).
www.TaylorRealEstateAustin.com | Direct: 512.796.4447 | Fax: 512.628.7720 | 2525 Wallingwood Bldg. 7C Austin, TX 78746
2 of 20
- 3. Blake Taylor Taylor Real Estate
Median For Sale vs. Median Sold
Dec-09 vs. Dec-11: The median price of for sale properties is up 17% and the median price of sold properties is up 21%
Dec-09 vs. Dec-11 Dec-09 vs. Dec-11
Dec-09 Dec-11 Change % Dec-09 Dec-11 Change %
765,000 896,684 131,684 +17% 497,500 600,000 102,500 +21%
MLS: ACTRIS Period: 2 years (monthly) Price: All Construction Type: All Bedrooms: All Bathrooms: All Lot Size: All
Property Types: Residential: (House, Condo, Townhouse, Half Duplex, Modular) Sq Ft: All
MLS Areas: 8E, 8W
Clarus MarketMetrics® 1 of 2 01/04/2012
Information not guaranteed. © 2009-2010 Terradatum and its suppliers and licensors (www.terradatum.com/about/licensors.td).
www.TaylorRealEstateAustin.com | Direct: 512.796.4447 | Fax: 512.628.7720 | 2525 Wallingwood Bldg. 7C Austin, TX 78746
3 of 20
- 4. Blake Taylor Taylor Real Estate
Median For Sale vs. Median Sold
Dec-09 vs. Dec-11: The median price of for sale properties is up 17% and the median price of sold properties is up 21%
For Sale # Properties Sold # Properties Price
Time Period Median For Sale Median Sold Difference
Dec-11 896,684 194 600,000 32 -296,683
Nov-11 849,000 243 571,500 30 -277,500
Oct-11 845,000 295 774,000 37 -71,000
Sep-11 849,500 338 552,500 42 -297,000
Aug-11 824,942 377 587,500 52 -237,442
Jul-11 799,000 395 645,500 70 -153,500
Jun-11 799,000 436 604,500 66 -194,500
May-11 817,500 420 585,000 60 -232,500
Apr-11 799,000 404 630,000 59 -169,000
Mar-11 849,450 350 677,500 39 -171,950
Feb-11 799,700 290 518,476 26 -281,224
Jan-11 845,000 277 555,250 24 -289,750
Dec-10 845,000 314 531,344 38 -313,656
Nov-10 799,500 373 625,000 35 -174,500
Oct-10 799,000 411 595,000 23 -204,000
Sep-10 799,000 429 597,500 29 -201,500
Aug-10 799,000 467 565,750 48 -233,250
Jul-10 799,000 500 675,000 59 -124,000
Jun-10 799,500 505 518,500 76 -281,000
May-10 799,900 481 526,000 56 -273,900
Apr-10 742,000 474 532,000 48 -210,000
Mar-10 724,950 412 500,000 37 -224,950
Feb-10 749,000 349 498,700 34 -250,300
Jan-10 789,000 317 566,875 28 -222,125
Dec-09 765,000 327 497,500 34 -267,500
Clarus MarketMetrics® 2 of 2 01/04/2012
Information not guaranteed. © 2009-2010 Terradatum and its suppliers and licensors (www.terradatum.com/about/licensors.td).
www.TaylorRealEstateAustin.com | Direct: 512.796.4447 | Fax: 512.628.7720 | 2525 Wallingwood Bldg. 7C Austin, TX 78746
4 of 20
- 5. Blake Taylor Taylor Real Estate
Sold Properties by Month
Dec-09 vs. Dec-11: The number of Sold properties is down 6%
Dec-09 vs. Dec-11
Dec-09 Dec-11 Change %
34 32 -2 -6%
MLS: ACTRIS Period: 2 years (monthly) Price: All Construction Type: All Bedrooms: All Bathrooms: All Lot Size: All
Property Types: Residential: (House, Condo, Townhouse, Half Duplex, Modular) Sq Ft: All
MLS Areas: 8E, 8W
Clarus MarketMetrics® 1 of 2 01/04/2012
Information not guaranteed. © 2009-2010 Terradatum and its suppliers and licensors (www.terradatum.com/about/licensors.td).
www.TaylorRealEstateAustin.com | Direct: 512.796.4447 | Fax: 512.628.7720 | 2525 Wallingwood Bldg. 7C Austin, TX 78746
5 of 20
- 6. Blake Taylor Taylor Real Estate
Sold Properties by Month
Dec-09 vs. Dec-11: The number of Sold properties is down 6%
Full Market Bank Properties Non-Bank Properties
Time Period # Properties Median Price Average DOM # Properties % Bank Median Price # Properties % Non-Bank Median Price
Dec-11 32 600,000 79 0 32 100.0 600,000
Nov-11 30 571,500 106 2 6.7 395,256 28 93.3 577,500
Oct-11 37 774,000 78 0 37 100.0 774,000
Sep-11 42 552,500 77 2 4.8 967,500 40 95.2 539,250
Aug-11 52 587,500 73 1 1.9 300,000 51 98.1 590,000
Jul-11 70 645,500 71 2 2.9 520,000 68 97.1 657,000
Jun-11 66 604,500 75 2 3.0 372,500 64 97.0 624,500
May-11 60 585,000 68 0 60 100.0 585,000
Apr-11 59 630,000 81 3 5.1 299,900 56 94.9 636,250
Mar-11 39 677,500 138 1 2.6 325,000 38 97.4 680,362
Feb-11 26 518,476 84 2 7.7 750,000 24 92.3 512,500
Jan-11 24 555,250 81 1 4.2 322,000 23 95.8 568,000
Dec-10 38 531,344 105 1 2.6 352,500 37 97.4 533,688
Nov-10 35 625,000 99 1 2.9 390,000 34 97.1 629,625
Oct-10 23 595,000 80 1 4.3 976,000 22 95.7 572,000
Sep-10 29 597,500 73 2 6.9 396,500 27 93.1 690,000
Aug-10 48 565,750 90 2 4.2 708,500 46 95.8 565,750
Jul-10 59 675,000 68 1 1.7 999,000 58 98.3 652,750
Jun-10 76 518,500 79 1 1.3 272,500 75 98.7 520,000
May-10 56 526,000 64 1 1.8 359,900 55 98.2 530,000
Apr-10 48 532,000 86 2 4.2 295,750 46 95.8 537,000
Mar-10 37 500,000 73 0 37 100.0 500,000
Feb-10 34 498,700 86 3 8.8 392,040 31 91.2 527,400
Jan-10 28 566,875 82 1 3.6 282,500 27 96.4 568,750
Dec-09 34 497,500 104 2 5.9 1,167,500 32 94.1 472,500
Clarus MarketMetrics® 2 of 2 01/04/2012
Information not guaranteed. © 2009-2010 Terradatum and its suppliers and licensors (www.terradatum.com/about/licensors.td).
www.TaylorRealEstateAustin.com | Direct: 512.796.4447 | Fax: 512.628.7720 | 2525 Wallingwood Bldg. 7C Austin, TX 78746
6 of 20
- 7. Blake Taylor Taylor Real Estate
Under Contract Properties by Month
Dec-09 vs. Dec-11: The number of Under Contract properties is down 29%
Dec-09 vs. Dec-11
Dec-09 Dec-11 Change %
31 22 -9 -29%
MLS: ACTRIS Period: 2 years (monthly) Price: All Construction Type: All Bedrooms: All Bathrooms: All Lot Size: All
Property Types: Residential: (House, Condo, Townhouse, Half Duplex, Modular) Sq Ft: All
MLS Areas: 8E, 8W
Clarus MarketMetrics® 1 of 2 01/04/2012
Information not guaranteed. © 2009-2010 Terradatum and its suppliers and licensors (www.terradatum.com/about/licensors.td).
www.TaylorRealEstateAustin.com | Direct: 512.796.4447 | Fax: 512.628.7720 | 2525 Wallingwood Bldg. 7C Austin, TX 78746
7 of 20
- 8. Blake Taylor Taylor Real Estate
Under Contract Properties by Month
Dec-09 vs. Dec-11: The number of Under Contract properties is down 29%
Full Market Bank Properties Non-Bank Properties
Time Period # Properties Median Price Average DOM # Properties % Bank Median Price # Properties % Non-Bank Median Price
Dec-11 22 580,788 93 1 4.5 172,900 21 95.5 589,900
Nov-11 29 595,000 80 1 3.5 489,900 28 96.5 634,950
Oct-11 29 659,900 84 1 3.5 215,373 28 96.5 667,450
Sep-11 40 719,450 91 1 2.5 575,000 39 97.5 749,900
Aug-11 47 660,000 91 2 4.3 1,088,950 45 95.7 650,000
Jul-11 52 582,000 70 0 52 100.0 582,000
Jun-11 71 695,000 66 2 2.8 472,500 69 97.2 695,000
May-11 59 648,000 80 1 1.7 450,000 58 98.3 648,500
Apr-11 59 599,000 58 2 3.4 1,009,075 57 96.6 599,000
Mar-11 53 600,000 60 2 3.8 267,450 51 96.2 609,000
Feb-11 43 699,950 148 1 2.3 329,900 42 97.7 709,475
Jan-11 33 574,900 90 3 9.1 725,000 30 90.9 569,900
Dec-10 25 444,500 126 1 4.0 426,400 24 96.0 494,750
Nov-10 29 649,000 79 1 3.5 419,900 28 96.5 674,450
Oct-10 38 599,000 86 2 5.3 775,500 36 94.7 599,000
Sep-10 19 650,000 115 1 5.3 400,000 18 94.7 650,000
Aug-10 44 599,000 73 1 2.3 465,000 43 97.7 599,000
Jul-10 45 650,000 89 2 4.4 696,950 43 95.6 650,000
Jun-10 56 697,000 79 1 1.8 999,000 55 98.2 695,000
May-10 59 595,000 74 1 1.7 279,900 58 98.3 607,000
Apr-10 69 489,000 58 1 1.4 359,900 68 98.5 489,000
Mar-10 48 549,900 70 1 2.1 500,000 47 97.9 549,900
Feb-10 41 550,000 86 1 2.4 124,900 40 97.6 562,500
Jan-10 29 599,900 83 1 3.5 849,900 28 96.5 574,950
Dec-09 31 492,000 98 2 6.5 330,350 29 93.5 575,000
Clarus MarketMetrics® 2 of 2 01/04/2012
Information not guaranteed. © 2009-2010 Terradatum and its suppliers and licensors (www.terradatum.com/about/licensors.td).
www.TaylorRealEstateAustin.com | Direct: 512.796.4447 | Fax: 512.628.7720 | 2525 Wallingwood Bldg. 7C Austin, TX 78746
8 of 20
- 9. Blake Taylor Taylor Real Estate
New Properties by Month
Dec-09 vs. Dec-11: The number of New properties is down 43%
Dec-09 vs. Dec-11
Dec-09 Dec-11 Change %
30 17 -13 -43%
MLS: ACTRIS Period: 2 years (monthly) Price: All Construction Type: All Bedrooms: All Bathrooms: All Lot Size: All
Property Types: Residential: (House, Condo, Townhouse, Half Duplex, Modular) Sq Ft: All
MLS Areas: 8E, 8W
Clarus MarketMetrics® 1 of 2 01/04/2012
Information not guaranteed. © 2009-2010 Terradatum and its suppliers and licensors (www.terradatum.com/about/licensors.td).
www.TaylorRealEstateAustin.com | Direct: 512.796.4447 | Fax: 512.628.7720 | 2525 Wallingwood Bldg. 7C Austin, TX 78746
9 of 20
- 10. Blake Taylor Taylor Real Estate
New Properties by Month
Dec-09 vs. Dec-11: The number of New properties is down 43%
Full Market Bank Properties Non-Bank Properties
Time Period # Properties Median Price # Properties % Bank Median Price # Properties % Non-Bank Median Price
Dec-11 17 550,000 0 17 100.0 550,000
Nov-11 31 629,000 0 31 100.0 629,000
Oct-11 33 714,900 1 3.0 489,900 32 97.0 744,950
Sep-11 51 749,900 2 3.9 1,282,500 49 96.1 749,900
Aug-11 58 613,500 0 58 100.0 613,500
Jul-11 65 697,500 0 65 100.0 697,500
Jun-11 97 659,000 2 2.1 255,186 95 97.9 660,000
May-11 98 727,000 2 2.0 1,296,500 96 98.0 727,000
Apr-11 127 638,995 4 3.1 534,575 123 96.8 638,995
Mar-11 123 844,500 2 1.6 847,450 121 98.4 844,500
Feb-11 71 689,000 1 1.4 235,000 70 98.6 692,000
Jan-11 50 692,450 3 6.0 450,000 47 94.0 699,950
Dec-10 28 581,950 2 7.1 570,400 26 92.9 581,950
Nov-10 47 559,500 1 2.1 299,900 46 97.9 578,750
Oct-10 54 684,500 0 54 100.0 684,500
Sep-10 62 674,950 2 3.2 324,200 60 96.8 714,950
Aug-10 59 650,000 3 5.1 377,000 56 94.9 721,500
Jul-10 90 634,500 2 2.2 696,950 88 97.8 634,500
Jun-10 113 634,900 2 1.8 842,888 111 98.2 634,900
May-10 110 806,950 2 1.8 413,200 108 98.2 814,450
Apr-10 138 649,450 3 2.2 866,900 135 97.8 639,900
Mar-10 126 684,000 4 3.2 389,900 122 96.8 699,000
Feb-10 85 699,000 2 2.4 848,000 83 97.7 699,000
Jan-10 65 695,900 3 4.6 500,000 62 95.4 710,400
Dec-09 30 644,950 2 6.7 564,900 28 93.3 644,950
Clarus MarketMetrics® 2 of 2 01/04/2012
Information not guaranteed. © 2009-2010 Terradatum and its suppliers and licensors (www.terradatum.com/about/licensors.td).
www.TaylorRealEstateAustin.com | Direct: 512.796.4447 | Fax: 512.628.7720 | 2525 Wallingwood Bldg. 7C Austin, TX 78746
10 of 20
- 11. Blake Taylor Taylor Real Estate
For Sale Properties by Month
Dec-09 vs. Dec-11: The number of For Sale properties is down 41%
Dec-09 vs. Dec-11
Dec-09 Dec-11 Change %
327 194 -133 -41%
MLS: ACTRIS Period: 2 years (monthly) Price: All Construction Type: All Bedrooms: All Bathrooms: All Lot Size: All
Property Types: Residential: (House, Condo, Townhouse, Half Duplex, Modular) Sq Ft: All
MLS Areas: 8E, 8W
Clarus MarketMetrics® 1 of 2 01/04/2012
Information not guaranteed. © 2009-2010 Terradatum and its suppliers and licensors (www.terradatum.com/about/licensors.td).
www.TaylorRealEstateAustin.com | Direct: 512.796.4447 | Fax: 512.628.7720 | 2525 Wallingwood Bldg. 7C Austin, TX 78746
11 of 20
- 12. Blake Taylor Taylor Real Estate
For Sale Properties by Month
Dec-09 vs. Dec-11: The number of For Sale properties is down 41%
Full Market Bank Properties Non-Bank Properties
Time Period # Properties Median Price Average DOM # Properties % Bank Median Price # Properties % Non-Bank Median Price
Dec-11 194 896,684 186 4 2.1 1,296,500 190 97.9 896,684
Nov-11 243 849,000 162 6 2.5 591,950 237 97.5 850,000
Oct-11 295 845,000 149 7 2.4 489,900 288 97.6 849,000
Sep-11 338 849,500 137 7 2.1 575,000 331 97.9 850,000
Aug-11 377 824,942 128 7 1.9 694,000 370 98.1 824,971
Jul-11 395 799,000 118 7 1.8 694,000 388 98.2 799,000
Jun-11 436 799,000 104 9 2.1 650,000 427 97.9 799,000
May-11 420 817,500 106 8 1.9 672,000 412 98.1 832,000
Apr-11 404 799,000 102 8 2.0 550,000 396 98.0 799,250
Mar-11 350 849,450 109 6 1.7 432,500 344 98.3 849,900
Feb-11 290 799,700 140 6 2.1 362,200 284 97.9 807,450
Jan-11 277 845,000 153 9 3.2 450,000 268 96.8 862,500
Dec-10 314 845,000 162 9 2.9 426,400 305 97.1 849,900
Nov-10 373 799,500 146 8 2.1 423,150 365 97.9 799,900
Oct-10 411 799,000 136 9 2.2 426,400 402 97.8 799,250
Sep-10 429 799,000 130 12 2.8 423,150 417 97.2 799,000
Aug-10 467 799,000 120 12 2.6 445,700 455 97.4 799,000
Jul-10 500 799,000 110 11 2.2 609,000 489 97.8 799,000
Jun-10 505 799,500 102 11 2.2 509,777 494 97.8 799,900
May-10 481 799,900 102 10 2.1 445,700 471 97.9 814,000
Apr-10 474 742,000 102 9 1.9 465,000 465 98.1 750,000
Mar-10 412 724,950 112 10 2.4 442,450 402 97.6 726,000
Feb-10 349 749,000 126 7 2.0 500,000 342 98.0 749,450
Jan-10 317 789,000 142 6 1.9 674,950 311 98.1 789,000
Dec-09 327 765,000 146 6 1.8 604,950 321 98.2 765,000
Clarus MarketMetrics® 2 of 2 01/04/2012
Information not guaranteed. © 2009-2010 Terradatum and its suppliers and licensors (www.terradatum.com/about/licensors.td).
www.TaylorRealEstateAustin.com | Direct: 512.796.4447 | Fax: 512.628.7720 | 2525 Wallingwood Bldg. 7C Austin, TX 78746
12 of 20
- 13. Blake Taylor Taylor Real Estate
Expired Properties by Month
Dec-09 vs. Dec-11: The number of Expired properties is down 23%
Dec-09 vs. Dec-11
Dec-09 Dec-11 Change %
44 34 -10 -23%
MLS: ACTRIS Period: 2 years (monthly) Price: All Construction Type: All Bedrooms: All Bathrooms: All Lot Size: All
Property Types: Residential: (House, Condo, Townhouse, Half Duplex, Modular) Sq Ft: All
MLS Areas: 8E, 8W
Clarus MarketMetrics® 1 of 2 01/04/2012
Information not guaranteed. © 2009-2010 Terradatum and its suppliers and licensors (www.terradatum.com/about/licensors.td).
www.TaylorRealEstateAustin.com | Direct: 512.796.4447 | Fax: 512.628.7720 | 2525 Wallingwood Bldg. 7C Austin, TX 78746
13 of 20
- 14. Blake Taylor Taylor Real Estate
Expired Properties by Month
Dec-09 vs. Dec-11: The number of Expired properties is down 23%
Full Market Bank Properties Non-Bank Properties
Time Period # Properties Median Price Average DOM # Properties % Bank Median Price # Properties % Non-Bank Median Price
Dec-11 34 1,241,500 241 1 2.9 1,990,000 33 97.1 988,000
Nov-11 37 939,500 150 1 2.7 415,000 36 97.3 957,250
Oct-11 54 797,000 144 0 54 100.0 797,000
Sep-11 36 907,000 169 0 36 100.0 907,000
Aug-11 43 674,900 136 0 43 100.0 674,900
Jul-11 24 837,000 161 0 24 100.0 837,000
Jun-11 35 719,900 105 0 35 100.0 719,900
May-11 22 1,647,450 204 0 22 100.0 1,647,450
Apr-11 23 859,000 142 0 23 100.0 859,000
Mar-11 20 1,098,000 131 0 20 100.0 1,098,000
Feb-11 20 797,000 178 1 5.0 394,500 19 95.0 799,000
Jan-11 25 699,000 194 1 4.0 499,000 24 96.0 808,000
Dec-10 62 896,950 186 2 3.2 547,700 60 96.8 903,000
Nov-10 58 727,250 153 0 58 100.0 727,250
Oct-10 47 799,000 146 0 47 100.0 799,000
Sep-10 53 775,000 142 2 3.8 464,838 51 96.2 799,000
Aug-10 56 806,950 142 1 1.8 377,000 55 98.2 814,000
Jul-10 47 799,000 145 0 47 100.0 799,000
Jun-10 39 649,900 114 1 2.6 339,000 38 97.4 687,450
May-10 30 872,998 166 0 30 100.0 872,998
Apr-10 34 669,900 198 0 34 100.0 669,900
Mar-10 28 787,000 166 3 10.7 1,357,000 25 89.3 775,000
Feb-10 22 767,500 161 0 22 100.0 767,500
Jan-10 24 1,187,500 220 0 24 100.0 1,187,500
Dec-09 44 774,950 166 1 2.3 939,000 43 97.7 749,900
Clarus MarketMetrics® 2 of 2 01/04/2012
Information not guaranteed. © 2009-2010 Terradatum and its suppliers and licensors (www.terradatum.com/about/licensors.td).
www.TaylorRealEstateAustin.com | Direct: 512.796.4447 | Fax: 512.628.7720 | 2525 Wallingwood Bldg. 7C Austin, TX 78746
14 of 20
- 15. Blake Taylor Taylor Real Estate
Supply & Demand by Month
Dec-09 vs. Dec-11: The number of for sale properties is down 41% and the number of sold properties is down 6%
Dec-09 vs. Dec-11 Dec-09 vs. Dec-11
Dec-09 Dec-11 Change % Dec-09 Dec-11 Change %
327 194 -133 -41% 34 32 -2 -6%
MLS: ACTRIS Period: 2 years (monthly) Price: All Construction Type: All Bedrooms: All Bathrooms: All Lot Size: All
Property Types: Residential: (House, Condo, Townhouse, Half Duplex, Modular) Sq Ft: All
MLS Areas: 8E, 8W
Clarus MarketMetrics® 1 of 2 01/04/2012
Information not guaranteed. © 2009-2010 Terradatum and its suppliers and licensors (www.terradatum.com/about/licensors.td).
www.TaylorRealEstateAustin.com | Direct: 512.796.4447 | Fax: 512.628.7720 | 2525 Wallingwood Bldg. 7C Austin, TX 78746
15 of 20
- 16. Blake Taylor Taylor Real Estate
Supply & Demand by Month
Dec-09 vs. Dec-11: The number of for sale properties is down 41% and the number of sold properties is down 6%
# Properties Average DOM # Properties Average DOM
Time Period For Sale For Sale Sold Sold
Dec-11 194 186 32 79
Nov-11 243 162 30 106
Oct-11 295 149 37 78
Sep-11 338 137 42 77
Aug-11 377 128 52 73
Jul-11 395 118 70 71
Jun-11 436 104 66 75
May-11 420 106 60 68
Apr-11 404 102 59 81
Mar-11 350 109 39 138
Feb-11 290 140 26 84
Jan-11 277 153 24 81
Dec-10 314 162 38 105
Nov-10 373 146 35 99
Oct-10 411 136 23 80
Sep-10 429 130 29 73
Aug-10 467 120 48 90
Jul-10 500 110 59 68
Jun-10 505 102 76 79
May-10 481 102 56 64
Apr-10 474 102 48 86
Mar-10 412 112 37 73
Feb-10 349 126 34 86
Jan-10 317 142 28 82
Dec-09 327 146 34 104
Clarus MarketMetrics® 2 of 2 01/04/2012
Information not guaranteed. © 2009-2010 Terradatum and its suppliers and licensors (www.terradatum.com/about/licensors.td).
www.TaylorRealEstateAustin.com | Direct: 512.796.4447 | Fax: 512.628.7720 | 2525 Wallingwood Bldg. 7C Austin, TX 78746
16 of 20
- 17. Blake Taylor Taylor Real Estate
The Average Days on Market by Month
Dec-09 vs. Dec-11: The average days on market is down 6%
Dec-09 vs. Dec-11
Dec-09 Dec-11 Change %
98 93 -6 -6%
MLS: ACTRIS Period: 2 years (monthly) Price: All Construction Type: All Bedrooms: All Bathrooms: All Lot Size: All
Property Types: Residential: (House, Condo, Townhouse, Half Duplex, Modular) Sq Ft: All
MLS Areas: 8E, 8W
Clarus MarketMetrics® 1 of 2 01/04/2012
Information not guaranteed. © 2009-2010 Terradatum and its suppliers and licensors (www.terradatum.com/about/licensors.td).
www.TaylorRealEstateAustin.com | Direct: 512.796.4447 | Fax: 512.628.7720 | 2525 Wallingwood Bldg. 7C Austin, TX 78746
17 of 20
- 18. Blake Taylor Taylor Real Estate
The Average Days on Market by Month
Dec-09 vs. Dec-11: The average days on market is down 6%
Time Period Average DOM # UC Units
Dec-11 93 22
Nov-11 80 29
Oct-11 84 29
Sep-11 91 40
Aug-11 91 47
Jul-11 70 52
Jun-11 66 71
May-11 80 59
Apr-11 58 59
Mar-11 60 53
Feb-11 148 43
Jan-11 90 33
Dec-10 126 25
Nov-10 79 29
Oct-10 86 38
Sep-10 115 19
Aug-10 73 44
Jul-10 89 45
Jun-10 79 56
May-10 74 59
Apr-10 58 69
Mar-10 70 48
Feb-10 86 41
Jan-10 83 29
Dec-09 98 31
Clarus MarketMetrics® 2 of 2 01/04/2012
Information not guaranteed. © 2009-2010 Terradatum and its suppliers and licensors (www.terradatum.com/about/licensors.td).
www.TaylorRealEstateAustin.com | Direct: 512.796.4447 | Fax: 512.628.7720 | 2525 Wallingwood Bldg. 7C Austin, TX 78746
18 of 20
- 19. Blake Taylor Taylor Real Estate
Months Supply of Inventory
Dec-09 vs. Dec-11: The average months supply of inventory is down 23%
Dec-09 vs. Dec-11
Dec-09 Dec-11 Change %
8.1 6.3 -1.9 -23%
MLS: ACTRIS Period: 2 years (monthly) Price: All Construction Type: All Bedrooms: All Bathrooms: All Lot Size: All
Property Types: Residential: (House, Condo, Townhouse, Half Duplex, Modular) Sq Ft: All
MLS Areas: 8E, 8W
Clarus MarketMetrics® 1 of 2 01/04/2012
Information not guaranteed. © 2009-2010 Terradatum and its suppliers and licensors (www.terradatum.com/about/licensors.td).
www.TaylorRealEstateAustin.com | Direct: 512.796.4447 | Fax: 512.628.7720 | 2525 Wallingwood Bldg. 7C Austin, TX 78746
19 of 20
- 20. Blake Taylor Taylor Real Estate
Months Supply of Inventory
Dec-09 vs. Dec-11: The average months supply of inventory is down 23%
# Units For Sale # UC Units UC Average
Time Period Last Day of Month During Month MSI DOM
Dec-11 138 22 6.3 93
Nov-11 177 29 6.1 80
Oct-11 212 29 7.3 84
Sep-11 262 40 6.5 91
Aug-11 287 47 6.1 91
Jul-11 319 52 6.1 70
Jun-11 330 71 4.6 66
May-11 339 59 5.7 80
Apr-11 322 59 5.5 58
Mar-11 277 53 5.2 60
Feb-11 227 43 5.3 148
Jan-11 219 33 6.6 90
Dec-10 227 25 9.1 126
Nov-10 286 29 9.9 79
Oct-10 326 38 8.6 86
Sep-10 357 19 18.8 115
Aug-10 367 44 8.3 73
Jul-10 408 45 9.1 89
Jun-10 410 56 7.3 79
May-10 392 59 6.6 74
Apr-10 371 69 5.4 58
Mar-10 336 48 7.0 70
Feb-10 286 41 7.0 86
Jan-10 264 29 9.1 83
Dec-09 252 31 8.1 98
Clarus MarketMetrics® 2 of 2 01/04/2012
Information not guaranteed. © 2009-2010 Terradatum and its suppliers and licensors (www.terradatum.com/about/licensors.td).
www.TaylorRealEstateAustin.com | Direct: 512.796.4447 | Fax: 512.628.7720 | 2525 Wallingwood Bldg. 7C Austin, TX 78746
20 of 20