SlideShare una empresa de Scribd logo
1 de 6
Descargar para leer sin conexión
11	
  System	
  Design	
  Lessons	
  Learned	
  from	
  Muni	
  Wi-­‐Fi	


©	
  Ted	
  Boone.	
  All	
  Rights	
  Reserved	
   Page	
  1	
  
Intro	
  
Conjecture	
  and	
  rumor	
  about	
  earlier	
  large-­‐scale,	
  municipal	
  Wi-­‐Fi	
  networks	
  abound.	
  Here	
  are	
  some	
  
general	
  design	
  rules-­‐of-­‐thumb	
  backed	
  by	
  data	
  from	
  some	
  of	
  those	
  largest	
  municipal	
  deployments.	
  
Engineering	
  
1. Unlicensed	
  =	
  Noisy	
  
While	
  the	
  dollar	
  cost	
  of	
  unlicensed	
  spectrum	
  is	
  attractive,	
  the	
  noise	
  in	
  those	
  bands	
  has	
  to	
  be	
  properly	
  
accounted	
  for	
  during	
  system	
  design.	
  Here’s	
  a	
  chart	
  of	
  average	
  2.4	
  GHz	
  quiescent	
  noise	
  across	
  a	
  few	
  
thousand	
  Wi-­‐Fi	
  access	
  points	
  in	
  different	
  urban	
  areas.	


The	
  average	
  noise	
  floor	
  was	
  -­‐94dbm.	
  And	
  the	
  90th	
  percentile	
  noise	
  floor	
  was	
  -­‐88	
  dBm.	
  That's	
  a	
  useful	
  
number	
  for	
  design	
  purposes.	
  
Compared	
  with	
  the	
  thermal	
  noise	
  floor	
  of	
  -­‐101	
  dBm,	
  this	
  represents	
  a	
  13	
  dB	
  penalty	
  against	
  a	
  similar	
  
licensed	
  channel.	
  That's	
  more	
  than	
  4	
  times	
  the	
  range	
  in	
  free	
  space.	


0.00%	
  
2.00%	
  
4.00%	
  
6.00%	
  
8.00%	
  
10.00%	
  
12.00%	
  
14.00%	
  
<-­‐100	
  
-­‐100	
  
-­‐99	
  
-­‐98	
  
-­‐97	
  
-­‐96	
  
-­‐95	
  
-­‐94	
  
-­‐93	
  
-­‐92	
  
-­‐91	
  
-­‐90	
  
-­‐89	
  
-­‐88	
  
-­‐87	
  
-­‐86	
  
-­‐85	
  
-­‐84	
  
-­‐83	
  
-­‐82	
  
-­‐81	
  
-­‐80	
  
-­‐79	
  
-­‐78	
  
-­‐77	
  
-­‐73	
  
-­‐72	
  
-­‐71	
  
%	
  of	
  sample	
  
dBm	
  
Noise	
  Floor	
  DistribuWon	
  
90th	
  
percenWle	
  
cutoff	
  
11	
  System	
  Design	
  Lessons	
  Learned	
  from	
  Muni	
  Wi-­‐Fi	


©	
  Ted	
  Boone.	
  All	
  Rights	
  Reserved	
   Page	
  2	
  
2. Client	
  power	
  sets	
  density	
  …	
  and	
  network	
  cost	
  
An	
  analysis	
  of	
  the	
  network	
  link	
  budgets	
  pretty	
  quickly	
  identifies	
  the	
  weak	
  link	
  in	
  the	
  chain	
  as	
  the	
  link	
  
from	
  the	
  client	
  to	
  the	
  mesh	
  node.	
  For	
  a	
  fairly	
  typical	
  50	
  mW	
  client	
  (laptop	
  or	
  smartphone),	
  the	
  client	
  to	
  
node	
  link	
  is	
  16	
  dB	
  weaker	
  than	
  the	
  link	
  down	
  from	
  the	
  node	
  to	
  the	
  client.	
  
More than 3 times Mobile Range
Mobile Range
Mesh Node
Main Street
CPE
The Wi-Fi
mesh node
transmits a
very strong
signal
(> 1000 mW)
A typical CPE
transmits a
signal similar
to the mesh
node
(> 500 mW)
The typical
mobile
transmits a
much weaker
signal
(~50 mW)
	
  
This	
  means	
  that	
  the	
  target	
  client	
  device	
  generally	
  dictates	
  the	
  number	
  of	
  Wi-­‐Fi	
  nodes	
  required	
  to	
  cover	
  
an	
  area.	
  And	
  is	
  thus	
  the	
  primary	
  driver	
  for	
  the	
  cost	
  of	
  the	
  network.	
  
3. 4%	
  clients	
  gained	
  per	
  dB	
  improvement	
  
The	
  observed	
  uplink	
  SNR	
  threshold	
  for	
  a	
  reliable	
  link	
  is	
  13	
  dB.	
  The	
  following	
  graph	
  demonstrates	
  that	
  a	
  
single	
  dB	
  improvement	
  in	
  uplink	
  SNR	
  (usually	
  dictated	
  by	
  client	
  transmit	
  power)	
  moves	
  4%	
  of	
  clients	
  
across	
  that	
  critical	
  threshold	
  line.	
  Thus	
  a	
  single	
  dB	
  improvement	
  in	
  client	
  TX	
  power	
  or	
  antenna	
  gain	
  
equates	
  to	
  a	
  4%	
  improvement	
  in	
  client	
  coverage.	
  
11	
  System	
  Design	
  Lessons	
  Learned	
  from	
  Muni	
  Wi-­‐Fi	


©	
  Ted	
  Boone.	
  All	
  Rights	
  Reserved	
   Page	
  3	


4. 5	
  GHz	
  OFDM	
  equipment	
  delivers	
  ¼	
  bps/Hz	
  in	
  near-­‐	
  or	
  non-­‐line-­‐of-­‐sight	
  
A	
  weeklong	
  average	
  of	
  over	
  400	
  5GHz	
  CSMA/CD	
  OFDM	
  radios	
  with	
  most	
  devices	
  setup	
  in	
  near	
  line-­‐of-­‐
sight	
  shows	
  that	
  these	
  radios	
  achieve	
  an	
  average	
  of	
  ¼	
  bps/Hz	
  of	
  TCP	
  throughput	
  
5. 5	
  GHz	
  FSK	
  equipment	
  delivers	
  ¼	
  bps/Hz	
  in	
  line-­‐of-­‐sight	
  
A	
  weeklong	
  average	
  of	
  over	
  350	
  5GHz	
  scheduled	
  FSK	
  radios	
  with	
  most	
  devices	
  setup	
  in	
  line-­‐of-­‐sight	
  
shows	
  that	
  these	
  radios	
  achieve	
  an	
  average	
  of	
  ¼	
  bps/Hz	
  of	
  TCP	
  throughput.	
  
0%	
  
1%	
  
2%	
  
3%	
  
4%	
  
5%	
  
6%	
  
2	
   4	
   6	
   8	
   10	
   12	
   14	
   16	
   18	
   20	
   22	
   24	
   26	
   28	
   30	
   32	
   34	
   36	
   38	
   40	
  
%	
  Clients	
  
Uplink	
  SNR	
  
Client	
  DistribuWon	
  
11	
  System	
  Design	
  Lessons	
  Learned	
  from	
  Muni	
  Wi-­‐Fi	


©	
  Ted	
  Boone.	
  All	
  Rights	
  Reserved	
   Page	
  4	
  
6. 2.4	
  Wi-­‐Fi	
  Mesh	
  throughput	
  
Effective	
  mesh	
  throughput	
  is	
  strongly	
  dependant	
  on	
  the	
  number	
  of	
  hops	
  that	
  the	
  data	
  must	
  take	
  
through	
  the	
  mesh.	
  The	
  chart	
  below	
  is	
  for	
  single-­‐radio	
  2.4	
  GHz	
  mesh	
  nodes.	
  It	
  is	
  an	
  composite	
  of	
  over	
  
5000	
  devices.	
  The	
  mesh	
  throughput	
  rule-­‐of-­‐thumb	
  is	
  5.5	
  Mbps	
  divided	
  by	
  the	
  hopcount.	


7. 2.4	
  WiFi	
  Mesh	
  equipment	
  is	
  1/5	
  bps/Hz	
  
Another	
  rule-­‐of-­‐thumb	
  related	
  to	
  the	
  above	
  analysis	
  is	
  that	
  2.4	
  GHz	
  mesh	
  efficiency	
  is	
  1/5	
  bps/Hz	
  of	
  TCP	
  
throughput.	
  
0.0	
  
1.0	
  
2.0	
  
3.0	
  
4.0	
  
5.0	
  
6.0	
  
0	
   1	
   2	
   3	
   4	
   5	
   6	
   7	
   8	
   9	
  
TCP	
  Throughput	
  (Mbps)	
  
Hop	
  Count	
  
Single	
  Radio	
  Mesh	
  Throughput	
  
Down	
   Up	
   5.5/HC	
  
11	
  System	
  Design	
  Lessons	
  Learned	
  from	
  Muni	
  Wi-­‐Fi	


©	
  Ted	
  Boone.	
  All	
  Rights	
  Reserved	
   Page	
  5	
  
8. Network	
  Load	
  
Analysis	
  of	
  the	
  network	
  load	
  is	
  outlined	
  on	
  the	
  following	
  graph.	
  Note:	
  this	
  graph	
  contains	
  numerous	
  
assumptions	
  about	
  household	
  density,	
  over-­‐subscription,	
  and	
  subscriber	
  penetration.	
  It	
  is	
  broken	
  down	
  
into	
  initial	
  and	
  long-­‐term	
  load	
  curves	
  based	
  on	
  the	
  anticipated	
  subscriber	
  penetration	
  in	
  each	
  term.	


These	
  curves	
  conform	
  to	
  an	
  equation	
  where	
  the	
  load	
  looks	
  like	
  a	
  fixed	
  baseline	
  capacity	
  plus	
  the	
  high-­‐
end	
  oversubscribed	
  aggregate	
  
𝐿𝑜𝑎𝑑 =
𝑀𝑖𝑛𝑖𝑚𝑢𝑚  𝑆𝑒𝑟𝑣𝑖𝑐𝑒  𝐿𝑒𝑣𝑒𝑙 ∗ (𝐵𝑎𝑠𝑒𝑙𝑖𝑛𝑒  𝑆𝑒𝑟𝑣𝑖𝑐𝑒  𝐹𝑎𝑐𝑡𝑜𝑟 + 𝐻𝑜𝑢𝑠𝑒ℎ𝑜𝑙𝑑𝑠 ∗ 𝑃𝑒𝑛𝑒𝑡𝑟𝑎𝑡𝑖𝑜𝑛)
𝑂𝑣𝑒𝑟𝑠𝑢𝑏𝑠𝑐𝑟𝑖𝑝𝑡𝑖𝑜𝑛
	
  
9. Optimal	
  network	
  is	
  Capacity	
  =	
  Load	
  
All	
  the	
  mesh	
  network	
  capacity	
  numbers	
  and	
  load	
  curves	
  can	
  then	
  be	
  used	
  to	
  determine	
  the	
  density	
  of	
  
gateways	
  that	
  are	
  needed	
  for	
  optimal	
  network	
  design.	
  
The	
  optimal	
  network	
  design	
  is	
  achieved	
  where	
  the	
  capacity	
  is	
  just	
  equal	
  to	
  the	
  peak	
  load.	
  This	
  is	
  simply	
  
the	
  intersection	
  of	
  the	
  load	
  and	
  capacity	
  curves.	
  This	
  intersection	
  can	
  then	
  be	
  translated	
  into	
  the	
  
gateway	
  density	
  needed	
  to	
  support	
  the	
  expected	
  load.	
  	
  
0	
  
5	
  
10	
  
15	
  
20	
  
25	
  
30	
  
35	
  
40	
  
45	
  
50	
  
0	
   0.1	
   0.2	
   0.3	
   0.4	
   0.5	
   0.6	
   0.7	
   0.8	
   0.9	
   1	
  
Offered	
  Load	
  (Mbps)	
  
Range	
  (miles)	
  
Offered	
  Load	
  Curve	
  
Long-term load approaches the
oversubscription rate at the
long-term sub penetration
Initial load approaches the
oversubscription rate at the
initial sub penetration
11	
  System	
  Design	
  Lessons	
  Learned	
  from	
  Muni	
  Wi-­‐Fi	


©	
  Ted	
  Boone.	
  All	
  Rights	
  Reserved	
   Page	
  6	
  
10. Backend	
  Systems	
  Should	
  Come	
  First	
  
Management	
  of	
  a	
  network	
  with	
  more	
  than	
  5000	
  devices	
  is	
  an	
  enormous	
  task.	
  Attempting	
  this	
  without	
  a	
  
holistic,	
  structured,	
  automated	
  system	
  will	
  result	
  in	
  chaos	
  and	
  management	
  costs	
  will	
  scale	
  linearly	
  with	
  
network	
  size;	
  an	
  unsustainable	
  network	
  growth	
  model.	
  
Furthermore,	
  if	
  the	
  network	
  is	
  deployed	
  in	
  advance	
  of	
  proper	
  management	
  systems,	
  performance	
  issues	
  
due	
  to	
  improper	
  deployment	
  will	
  not	
  be	
  identified	
  early	
  enough	
  to	
  rectify	
  while	
  deployment	
  crews	
  are	
  
in	
  the	
  field.	
  Ideally	
  the	
  deployment	
  signoff	
  will	
  tie	
  directly	
  to	
  performance	
  metrics	
  reported	
  directly	
  from	
  
the	
  backend	
  systems.	
  
11. Household	
  density	
  tends	
  towards	
  the	
  80/20	
  rule	
  
An	
  analysis	
  of	
  household	
  density	
  in	
  several	
  municipalities	
  lends	
  support	
  to	
  the	
  80/20	
  rule.	
  That	
  is	
  that	
  
80%	
  of	
  the	
  population	
  resides	
  in	
  20%	
  of	
  the	
  land	
  area.	
  These	
  ratios	
  vary	
  significantly	
  with	
  municipality,	
  
but	
  simple	
  math	
  shows	
  that	
  the	
  costs	
  of	
  95%	
  street-­‐level	
  coverage	
  are	
  vastly	
  higher	
  and,	
  more	
  
importantly,	
  vastly	
  less	
  profitable,	
  than	
  a	
  model	
  that	
  targets	
  customer	
  use	
  areas	
  only.	
  Optimally,	
  devices	
  
would	
  be	
  added	
  on	
  a	
  device-­‐level	
  return-­‐on-­‐investment	
  basis	
  only.	
  

Más contenido relacionado

La actualidad más candente

Capacity utilization and admission control in the downlinkof WMAX
Capacity utilization and admission control in the downlinkof WMAX Capacity utilization and admission control in the downlinkof WMAX
Capacity utilization and admission control in the downlinkof WMAX marwaeng
 
Trends of desnified mobile network, yhkim
Trends of desnified mobile network, yhkimTrends of desnified mobile network, yhkim
Trends of desnified mobile network, yhkimYoung Hwan Kim
 
Network Planning and Optimization
Network Planning and OptimizationNetwork Planning and Optimization
Network Planning and Optimizationmathurrohitji
 
Link budjet radio and spread spectrum theory
Link budjet   radio and spread spectrum theoryLink budjet   radio and spread spectrum theory
Link budjet radio and spread spectrum theoryDiogo Edler Menezes
 
Wireless networks by Engineer Geremew T,
Wireless networks by Engineer Geremew T,Wireless networks by Engineer Geremew T,
Wireless networks by Engineer Geremew T,GeremewTefera1
 
HIGH SPEED WIRELESS COMMUNICATION
HIGH SPEED WIRELESS COMMUNICATIONHIGH SPEED WIRELESS COMMUNICATION
HIGH SPEED WIRELESS COMMUNICATIONRezaul Islam
 
Integrated Optical Wireless Network For Next Generation Wireless Systems
Integrated Optical Wireless Network For Next Generation Wireless SystemsIntegrated Optical Wireless Network For Next Generation Wireless Systems
Integrated Optical Wireless Network For Next Generation Wireless SystemsCSCJournals
 
GSM Cell planning and frequency reuse
GSM Cell planning and frequency reuseGSM Cell planning and frequency reuse
GSM Cell planning and frequency reuseShashank Asthana
 
802.11n Technology - Presented by Meru Networks and DTC
802.11n Technology - Presented by Meru Networks and DTC802.11n Technology - Presented by Meru Networks and DTC
802.11n Technology - Presented by Meru Networks and DTCDigitalTelecom
 
Tools of the Trade for Small Cell Backhaul
Tools of the Trade for Small Cell BackhaulTools of the Trade for Small Cell Backhaul
Tools of the Trade for Small Cell BackhaulCBNL
 
Nec presentation wireless backhaul
Nec presentation   wireless backhaulNec presentation   wireless backhaul
Nec presentation wireless backhaulNEC Europe Ltd
 

La actualidad más candente (20)

Capacity utilization and admission control in the downlinkof WMAX
Capacity utilization and admission control in the downlinkof WMAX Capacity utilization and admission control in the downlinkof WMAX
Capacity utilization and admission control in the downlinkof WMAX
 
Unit 1
Unit 1Unit 1
Unit 1
 
Wifi wimax
Wifi wimaxWifi wimax
Wifi wimax
 
Unit 3
Unit 3Unit 3
Unit 3
 
Trends of desnified mobile network, yhkim
Trends of desnified mobile network, yhkimTrends of desnified mobile network, yhkim
Trends of desnified mobile network, yhkim
 
Unit 4
Unit 4Unit 4
Unit 4
 
80211n look before_wp
80211n look before_wp80211n look before_wp
80211n look before_wp
 
Network Planning and Optimization
Network Planning and OptimizationNetwork Planning and Optimization
Network Planning and Optimization
 
Cloud ran wp_tfs_nse_ae
Cloud ran wp_tfs_nse_aeCloud ran wp_tfs_nse_ae
Cloud ran wp_tfs_nse_ae
 
Link budjet radio and spread spectrum theory
Link budjet   radio and spread spectrum theoryLink budjet   radio and spread spectrum theory
Link budjet radio and spread spectrum theory
 
2g 3g
2g 3g2g 3g
2g 3g
 
Wireless networks by Engineer Geremew T,
Wireless networks by Engineer Geremew T,Wireless networks by Engineer Geremew T,
Wireless networks by Engineer Geremew T,
 
HIGH SPEED WIRELESS COMMUNICATION
HIGH SPEED WIRELESS COMMUNICATIONHIGH SPEED WIRELESS COMMUNICATION
HIGH SPEED WIRELESS COMMUNICATION
 
ANU-MIMO_whitepaper
ANU-MIMO_whitepaperANU-MIMO_whitepaper
ANU-MIMO_whitepaper
 
Integrated Optical Wireless Network For Next Generation Wireless Systems
Integrated Optical Wireless Network For Next Generation Wireless SystemsIntegrated Optical Wireless Network For Next Generation Wireless Systems
Integrated Optical Wireless Network For Next Generation Wireless Systems
 
GSM Cell planning and frequency reuse
GSM Cell planning and frequency reuseGSM Cell planning and frequency reuse
GSM Cell planning and frequency reuse
 
802.11n Technology - Presented by Meru Networks and DTC
802.11n Technology - Presented by Meru Networks and DTC802.11n Technology - Presented by Meru Networks and DTC
802.11n Technology - Presented by Meru Networks and DTC
 
Tools of the Trade for Small Cell Backhaul
Tools of the Trade for Small Cell BackhaulTools of the Trade for Small Cell Backhaul
Tools of the Trade for Small Cell Backhaul
 
Nec presentation wireless backhaul
Nec presentation   wireless backhaulNec presentation   wireless backhaul
Nec presentation wireless backhaul
 
Iuwne10 S06 L02
Iuwne10 S06 L02Iuwne10 S06 L02
Iuwne10 S06 L02
 

Similar a 11 Lessons learned from the Muni Wi-Fi experiment

Powerful business model for fixed wireless data using outdoor antennas - Paper
Powerful business model for fixed wireless data using outdoor antennas - PaperPowerful business model for fixed wireless data using outdoor antennas - Paper
Powerful business model for fixed wireless data using outdoor antennas - PaperAndre Fourie
 
TECHNICAL WHITE PAPER: NetBackup Appliances WAN Optimization
TECHNICAL WHITE PAPER: NetBackup Appliances WAN OptimizationTECHNICAL WHITE PAPER: NetBackup Appliances WAN Optimization
TECHNICAL WHITE PAPER: NetBackup Appliances WAN OptimizationSymantec
 
Different Issues and Survey of Proposed Solutions in TCP over Wireless Enviro...
Different Issues and Survey of Proposed Solutions in TCP over Wireless Enviro...Different Issues and Survey of Proposed Solutions in TCP over Wireless Enviro...
Different Issues and Survey of Proposed Solutions in TCP over Wireless Enviro...Ranjeet Bidwe
 
Mini-Fiber Node Technology
Mini-Fiber Node TechnologyMini-Fiber Node Technology
Mini-Fiber Node TechnologyXiaolin Lu
 
Traffic Offloading Solutions: Femto, WiFi and Integrated Femto-WiFi
Traffic Offloading Solutions: Femto, WiFi and Integrated Femto-WiFiTraffic Offloading Solutions: Femto, WiFi and Integrated Femto-WiFi
Traffic Offloading Solutions: Femto, WiFi and Integrated Femto-WiFiShristi Pradhan
 
1Running Head Network Design3Network DesignUn.docx
1Running Head Network Design3Network DesignUn.docx1Running Head Network Design3Network DesignUn.docx
1Running Head Network Design3Network DesignUn.docxeugeniadean34240
 
Fixed Broadband Business Case - Short Version
Fixed Broadband Business Case - Short VersionFixed Broadband Business Case - Short Version
Fixed Broadband Business Case - Short VersionAndre Fourie
 
Data Transmission Analysis using MW-5000 at 5.8 GHz Frequency
Data Transmission Analysis using MW-5000  at 5.8 GHz Frequency Data Transmission Analysis using MW-5000  at 5.8 GHz Frequency
Data Transmission Analysis using MW-5000 at 5.8 GHz Frequency IJECEIAES
 
C ran-field-trail-exfo cstudy060-v2_en
C ran-field-trail-exfo cstudy060-v2_enC ran-field-trail-exfo cstudy060-v2_en
C ran-field-trail-exfo cstudy060-v2_enSaurabh Verma
 
5 maximazing networkcapacity_v4-jorge_alvarado
5 maximazing networkcapacity_v4-jorge_alvarado5 maximazing networkcapacity_v4-jorge_alvarado
5 maximazing networkcapacity_v4-jorge_alvaradoSSPI Brasil
 
Solving the Mobile Backhaul Challenge
Solving the Mobile Backhaul ChallengeSolving the Mobile Backhaul Challenge
Solving the Mobile Backhaul ChallengeCFN Services
 
Why pon ftt h &amp; fttb are so important for players and what is the end game
Why pon  ftt h &amp; fttb are so important for players and what is the end gameWhy pon  ftt h &amp; fttb are so important for players and what is the end game
Why pon ftt h &amp; fttb are so important for players and what is the end gameKoinonia Enterprises Pty Ltd.
 
Carrier grade wi fi integration architecture
Carrier grade wi fi integration architectureCarrier grade wi fi integration architecture
Carrier grade wi fi integration architectureSatish Chavan
 
What Is Wide Area Network (WAN): Live WAN Network Examples : Notes
What Is Wide Area Network (WAN): Live WAN Network Examples : NotesWhat Is Wide Area Network (WAN): Live WAN Network Examples : Notes
What Is Wide Area Network (WAN): Live WAN Network Examples : NotesSubhajit Sahu
 
OPERATORS CAN SAVE $14 MILLION YEARLY THROUGH DATA OFFLOADING
 OPERATORS CAN SAVE $14 MILLION YEARLY THROUGH DATA OFFLOADING OPERATORS CAN SAVE $14 MILLION YEARLY THROUGH DATA OFFLOADING
OPERATORS CAN SAVE $14 MILLION YEARLY THROUGH DATA OFFLOADINGGreen Packet
 
NLOS Wireless Backhaul for Small Cells - TCO Comparison with Optical Fiber
NLOS Wireless Backhaul for Small Cells - TCO Comparison with Optical FiberNLOS Wireless Backhaul for Small Cells - TCO Comparison with Optical Fiber
NLOS Wireless Backhaul for Small Cells - TCO Comparison with Optical FiberFrank Rayal
 

Similar a 11 Lessons learned from the Muni Wi-Fi experiment (20)

Powerful business model for fixed wireless data using outdoor antennas - Paper
Powerful business model for fixed wireless data using outdoor antennas - PaperPowerful business model for fixed wireless data using outdoor antennas - Paper
Powerful business model for fixed wireless data using outdoor antennas - Paper
 
TECHNICAL WHITE PAPER: NetBackup Appliances WAN Optimization
TECHNICAL WHITE PAPER: NetBackup Appliances WAN OptimizationTECHNICAL WHITE PAPER: NetBackup Appliances WAN Optimization
TECHNICAL WHITE PAPER: NetBackup Appliances WAN Optimization
 
TCP for Wireless Environments
TCP for Wireless EnvironmentsTCP for Wireless Environments
TCP for Wireless Environments
 
Different Issues and Survey of Proposed Solutions in TCP over Wireless Enviro...
Different Issues and Survey of Proposed Solutions in TCP over Wireless Enviro...Different Issues and Survey of Proposed Solutions in TCP over Wireless Enviro...
Different Issues and Survey of Proposed Solutions in TCP over Wireless Enviro...
 
Mini-Fiber Node Technology
Mini-Fiber Node TechnologyMini-Fiber Node Technology
Mini-Fiber Node Technology
 
Traffic Offloading Solutions: Femto, WiFi and Integrated Femto-WiFi
Traffic Offloading Solutions: Femto, WiFi and Integrated Femto-WiFiTraffic Offloading Solutions: Femto, WiFi and Integrated Femto-WiFi
Traffic Offloading Solutions: Femto, WiFi and Integrated Femto-WiFi
 
1Running Head Network Design3Network DesignUn.docx
1Running Head Network Design3Network DesignUn.docx1Running Head Network Design3Network DesignUn.docx
1Running Head Network Design3Network DesignUn.docx
 
Fixed Broadband Business Case - Short Version
Fixed Broadband Business Case - Short VersionFixed Broadband Business Case - Short Version
Fixed Broadband Business Case - Short Version
 
What is wlan?
What is wlan?What is wlan?
What is wlan?
 
Data Transmission Analysis using MW-5000 at 5.8 GHz Frequency
Data Transmission Analysis using MW-5000  at 5.8 GHz Frequency Data Transmission Analysis using MW-5000  at 5.8 GHz Frequency
Data Transmission Analysis using MW-5000 at 5.8 GHz Frequency
 
C ran-field-trail-exfo cstudy060-v2_en
C ran-field-trail-exfo cstudy060-v2_enC ran-field-trail-exfo cstudy060-v2_en
C ran-field-trail-exfo cstudy060-v2_en
 
5 maximazing networkcapacity_v4-jorge_alvarado
5 maximazing networkcapacity_v4-jorge_alvarado5 maximazing networkcapacity_v4-jorge_alvarado
5 maximazing networkcapacity_v4-jorge_alvarado
 
Lte transport requirements
Lte transport requirementsLte transport requirements
Lte transport requirements
 
Solving the Mobile Backhaul Challenge
Solving the Mobile Backhaul ChallengeSolving the Mobile Backhaul Challenge
Solving the Mobile Backhaul Challenge
 
Why pon ftt h &amp; fttb are so important for players and what is the end game
Why pon  ftt h &amp; fttb are so important for players and what is the end gameWhy pon  ftt h &amp; fttb are so important for players and what is the end game
Why pon ftt h &amp; fttb are so important for players and what is the end game
 
Carrier grade wi fi integration architecture
Carrier grade wi fi integration architectureCarrier grade wi fi integration architecture
Carrier grade wi fi integration architecture
 
What Is Wide Area Network (WAN): Live WAN Network Examples : Notes
What Is Wide Area Network (WAN): Live WAN Network Examples : NotesWhat Is Wide Area Network (WAN): Live WAN Network Examples : Notes
What Is Wide Area Network (WAN): Live WAN Network Examples : Notes
 
Lect3
Lect3Lect3
Lect3
 
OPERATORS CAN SAVE $14 MILLION YEARLY THROUGH DATA OFFLOADING
 OPERATORS CAN SAVE $14 MILLION YEARLY THROUGH DATA OFFLOADING OPERATORS CAN SAVE $14 MILLION YEARLY THROUGH DATA OFFLOADING
OPERATORS CAN SAVE $14 MILLION YEARLY THROUGH DATA OFFLOADING
 
NLOS Wireless Backhaul for Small Cells - TCO Comparison with Optical Fiber
NLOS Wireless Backhaul for Small Cells - TCO Comparison with Optical FiberNLOS Wireless Backhaul for Small Cells - TCO Comparison with Optical Fiber
NLOS Wireless Backhaul for Small Cells - TCO Comparison with Optical Fiber
 

11 Lessons learned from the Muni Wi-Fi experiment

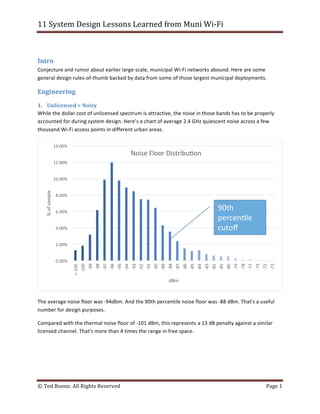
  • 1. 11  System  Design  Lessons  Learned  from  Muni  Wi-­‐Fi       ©  Ted  Boone.  All  Rights  Reserved   Page  1   Intro   Conjecture  and  rumor  about  earlier  large-­‐scale,  municipal  Wi-­‐Fi  networks  abound.  Here  are  some   general  design  rules-­‐of-­‐thumb  backed  by  data  from  some  of  those  largest  municipal  deployments.   Engineering   1. Unlicensed  =  Noisy   While  the  dollar  cost  of  unlicensed  spectrum  is  attractive,  the  noise  in  those  bands  has  to  be  properly   accounted  for  during  system  design.  Here’s  a  chart  of  average  2.4  GHz  quiescent  noise  across  a  few   thousand  Wi-­‐Fi  access  points  in  different  urban  areas.     The  average  noise  floor  was  -­‐94dbm.  And  the  90th  percentile  noise  floor  was  -­‐88  dBm.  That's  a  useful   number  for  design  purposes.   Compared  with  the  thermal  noise  floor  of  -­‐101  dBm,  this  represents  a  13  dB  penalty  against  a  similar   licensed  channel.  That's  more  than  4  times  the  range  in  free  space.       0.00%   2.00%   4.00%   6.00%   8.00%   10.00%   12.00%   14.00%   <-­‐100   -­‐100   -­‐99   -­‐98   -­‐97   -­‐96   -­‐95   -­‐94   -­‐93   -­‐92   -­‐91   -­‐90   -­‐89   -­‐88   -­‐87   -­‐86   -­‐85   -­‐84   -­‐83   -­‐82   -­‐81   -­‐80   -­‐79   -­‐78   -­‐77   -­‐73   -­‐72   -­‐71   %  of  sample   dBm   Noise  Floor  DistribuWon   90th   percenWle   cutoff  
  • 2. 11  System  Design  Lessons  Learned  from  Muni  Wi-­‐Fi       ©  Ted  Boone.  All  Rights  Reserved   Page  2   2. Client  power  sets  density  …  and  network  cost   An  analysis  of  the  network  link  budgets  pretty  quickly  identifies  the  weak  link  in  the  chain  as  the  link   from  the  client  to  the  mesh  node.  For  a  fairly  typical  50  mW  client  (laptop  or  smartphone),  the  client  to   node  link  is  16  dB  weaker  than  the  link  down  from  the  node  to  the  client.   More than 3 times Mobile Range Mobile Range Mesh Node Main Street CPE The Wi-Fi mesh node transmits a very strong signal (> 1000 mW) A typical CPE transmits a signal similar to the mesh node (> 500 mW) The typical mobile transmits a much weaker signal (~50 mW)   This  means  that  the  target  client  device  generally  dictates  the  number  of  Wi-­‐Fi  nodes  required  to  cover   an  area.  And  is  thus  the  primary  driver  for  the  cost  of  the  network.   3. 4%  clients  gained  per  dB  improvement   The  observed  uplink  SNR  threshold  for  a  reliable  link  is  13  dB.  The  following  graph  demonstrates  that  a   single  dB  improvement  in  uplink  SNR  (usually  dictated  by  client  transmit  power)  moves  4%  of  clients   across  that  critical  threshold  line.  Thus  a  single  dB  improvement  in  client  TX  power  or  antenna  gain   equates  to  a  4%  improvement  in  client  coverage.  
  • 3. 11  System  Design  Lessons  Learned  from  Muni  Wi-­‐Fi       ©  Ted  Boone.  All  Rights  Reserved   Page  3     4. 5  GHz  OFDM  equipment  delivers  ¼  bps/Hz  in  near-­‐  or  non-­‐line-­‐of-­‐sight   A  weeklong  average  of  over  400  5GHz  CSMA/CD  OFDM  radios  with  most  devices  setup  in  near  line-­‐of-­‐ sight  shows  that  these  radios  achieve  an  average  of  ¼  bps/Hz  of  TCP  throughput   5. 5  GHz  FSK  equipment  delivers  ¼  bps/Hz  in  line-­‐of-­‐sight   A  weeklong  average  of  over  350  5GHz  scheduled  FSK  radios  with  most  devices  setup  in  line-­‐of-­‐sight   shows  that  these  radios  achieve  an  average  of  ¼  bps/Hz  of  TCP  throughput.   0%   1%   2%   3%   4%   5%   6%   2   4   6   8   10   12   14   16   18   20   22   24   26   28   30   32   34   36   38   40   %  Clients   Uplink  SNR   Client  DistribuWon  
  • 4. 11  System  Design  Lessons  Learned  from  Muni  Wi-­‐Fi       ©  Ted  Boone.  All  Rights  Reserved   Page  4   6. 2.4  Wi-­‐Fi  Mesh  throughput   Effective  mesh  throughput  is  strongly  dependant  on  the  number  of  hops  that  the  data  must  take   through  the  mesh.  The  chart  below  is  for  single-­‐radio  2.4  GHz  mesh  nodes.  It  is  an  composite  of  over   5000  devices.  The  mesh  throughput  rule-­‐of-­‐thumb  is  5.5  Mbps  divided  by  the  hopcount.       7. 2.4  WiFi  Mesh  equipment  is  1/5  bps/Hz   Another  rule-­‐of-­‐thumb  related  to  the  above  analysis  is  that  2.4  GHz  mesh  efficiency  is  1/5  bps/Hz  of  TCP   throughput.   0.0   1.0   2.0   3.0   4.0   5.0   6.0   0   1   2   3   4   5   6   7   8   9   TCP  Throughput  (Mbps)   Hop  Count   Single  Radio  Mesh  Throughput   Down   Up   5.5/HC  
  • 5. 11  System  Design  Lessons  Learned  from  Muni  Wi-­‐Fi       ©  Ted  Boone.  All  Rights  Reserved   Page  5   8. Network  Load   Analysis  of  the  network  load  is  outlined  on  the  following  graph.  Note:  this  graph  contains  numerous   assumptions  about  household  density,  over-­‐subscription,  and  subscriber  penetration.  It  is  broken  down   into  initial  and  long-­‐term  load  curves  based  on  the  anticipated  subscriber  penetration  in  each  term.     These  curves  conform  to  an  equation  where  the  load  looks  like  a  fixed  baseline  capacity  plus  the  high-­‐ end  oversubscribed  aggregate   𝐿𝑜𝑎𝑑 = 𝑀𝑖𝑛𝑖𝑚𝑢𝑚  𝑆𝑒𝑟𝑣𝑖𝑐𝑒  𝐿𝑒𝑣𝑒𝑙 ∗ (𝐵𝑎𝑠𝑒𝑙𝑖𝑛𝑒  𝑆𝑒𝑟𝑣𝑖𝑐𝑒  𝐹𝑎𝑐𝑡𝑜𝑟 + 𝐻𝑜𝑢𝑠𝑒ℎ𝑜𝑙𝑑𝑠 ∗ 𝑃𝑒𝑛𝑒𝑡𝑟𝑎𝑡𝑖𝑜𝑛) 𝑂𝑣𝑒𝑟𝑠𝑢𝑏𝑠𝑐𝑟𝑖𝑝𝑡𝑖𝑜𝑛   9. Optimal  network  is  Capacity  =  Load   All  the  mesh  network  capacity  numbers  and  load  curves  can  then  be  used  to  determine  the  density  of   gateways  that  are  needed  for  optimal  network  design.   The  optimal  network  design  is  achieved  where  the  capacity  is  just  equal  to  the  peak  load.  This  is  simply   the  intersection  of  the  load  and  capacity  curves.  This  intersection  can  then  be  translated  into  the   gateway  density  needed  to  support  the  expected  load.     0   5   10   15   20   25   30   35   40   45   50   0   0.1   0.2   0.3   0.4   0.5   0.6   0.7   0.8   0.9   1   Offered  Load  (Mbps)   Range  (miles)   Offered  Load  Curve   Long-term load approaches the oversubscription rate at the long-term sub penetration Initial load approaches the oversubscription rate at the initial sub penetration
  • 6. 11  System  Design  Lessons  Learned  from  Muni  Wi-­‐Fi       ©  Ted  Boone.  All  Rights  Reserved   Page  6   10. Backend  Systems  Should  Come  First   Management  of  a  network  with  more  than  5000  devices  is  an  enormous  task.  Attempting  this  without  a   holistic,  structured,  automated  system  will  result  in  chaos  and  management  costs  will  scale  linearly  with   network  size;  an  unsustainable  network  growth  model.   Furthermore,  if  the  network  is  deployed  in  advance  of  proper  management  systems,  performance  issues   due  to  improper  deployment  will  not  be  identified  early  enough  to  rectify  while  deployment  crews  are   in  the  field.  Ideally  the  deployment  signoff  will  tie  directly  to  performance  metrics  reported  directly  from   the  backend  systems.   11. Household  density  tends  towards  the  80/20  rule   An  analysis  of  household  density  in  several  municipalities  lends  support  to  the  80/20  rule.  That  is  that   80%  of  the  population  resides  in  20%  of  the  land  area.  These  ratios  vary  significantly  with  municipality,   but  simple  math  shows  that  the  costs  of  95%  street-­‐level  coverage  are  vastly  higher  and,  more   importantly,  vastly  less  profitable,  than  a  model  that  targets  customer  use  areas  only.  Optimally,  devices   would  be  added  on  a  device-­‐level  return-­‐on-­‐investment  basis  only.