SlideShare una empresa de Scribd logo
1 de 68
Descargar para leer sin conexión
The Scarborough Hospital
                                                                                                                             Corporate Balanced Scorecard
                                                                                                                                      Q4 2010/11

                                                                   Our 1st Priority                                                                                                                   1st Qtr     Current       Previous                        Current     Risk
Strategic Direction                                                 (to 30-Jun-11)          Indicator                                                                                                Reported      Value         Value           Target         Status     Rating*   Page
                 Our Patients:
                 Create an environment of patient safety that                               Percentage of publicly reported patient safety indicators meeting the provincial target (see addendum)                  63%            63%           100%                  Y     n/a      2
                 exceeds our patients' highest expectations
                 and delivers care that is patient and family
                                                                                            Number of incident reports completed (medication and non-medication)                                                    768             730            490                 G     n/a      4
                 driven.                                               Service
                 Our People:                                       Excellence: To           Percentage of staff and physicians educated in Mission, Vision and Values defined behaviours               Q4           79%                           75%                  G     n/a      5
                 Be the first choice for motivated, talented      provide respectful        Employee Satisfaction survey results (Commitment composite score)                                                      50.9%          37.5%           59%                  Y     n/a      6
                 people who are inspired to deliver and
                                                                   and responsive           Physician Satisfaction survey results (Commitment composite score)                                                     42.7%          28.8%           43%                  Y     n/a      7
                 support excellent care in a diverse
                 environment.                                       service to our          Percentage of defined Model of Care positions transitioned                                                             100%           100%            100%                 G     n/a      8
                                                                  patients and each         Percentage of leaders with completed performance evaluations                                               Q4           21%                           50%                  Y     n/a      9
                                                                        other.              Percentage of Medical Directors with completed performance evaluations                                     Q3          100%            80%            100%                 G     n/a      10
                                                                                            Percentage of non-union staff with completed performance evaluations                                       Q4           46%                           50%                  Y     n/a      11
                                                                                            Percentage of unionized staff with completed performance evaluations                                       Q4            6%                           30%                  Y     n/a      12
                                                                                            Percentage of leaders educated in LEAN methodology                                                         Q4           17%                           100%                 Y     n/a      13
                 Our Programs, Plans and                                                    HIT indicator #17, Percentage of equipment cost to total expense                                                       5.2%            5.4%           5.9%                 R     M        14
                 Partners:
                 As a unified organization, lead the                                                                                                                                                   Q1
                                                                                            Number of standardized order sets used
                 development of a coordinated plan for the                                                                                                                                           2011/12
                 provision of care for all of Scarborough.                                  Percentage of Clinical Service Plan (CSP) recommendations implemented
                                                                                                                                                                                                       Q4
                                                                                                                                                                                                                                                 100%
                                                                                                                                                                                                     2011/12
                 Our Performance:                                                           Percentage of PMO project milestones met                                                                                40%            47%            80%                  R     L        15
                 Create an accountable, high performing
                                                                                            Percentage of Programs and Departments with performance indicator scorecards and action plans
                 organization that delivers measureable                                                                                                                                                             65%            75%            100%                 R     L        16
                 results.
                                                                                            that are posted and updated quarterly on the Intranet
                                                                                            Percentage of accountability agreement indicators achieved                                                              88%            88%            80%                  G     n/a      17
* Risk rating only completed for indicators that are not meeting the target and have not improved over the prior reporting period

Current Status Legend:                                                                                                                                                                                          Risk Rating Legend
Red = Performance indicator has not met the target for the current reporting period, and has not improved over the prior reporting period                                                                       L = Low reputational, financial or operational risk
Yellow = Performance is below the target, however it has improved over the previous reporting period                                                                                                            M = Medium reputational, financial or operational risk
Green = Performance indicator has met or exceeded or is not statistically different than the performance target for the current reporting period                                                                H = High reputational, financial or operational risk

                                                                          Vision: To be recognized as Canada’s leader in providing the best healthcare for a global community.
                                                                       Mission: To provide an outstanding care experience that meets the unique needs of each and every patient.
                                                                                        Values: I ntegrity, C ompassion, A ccountability, R espect, E xcellence


                                                                                                                                                   Page 1
The Scarborough Hospital
                                                                                                                                            Corporate Balanced Scorecard
                                                                                              Quality Improvement Plan (QIP), Hospital Services Accountability Agreement (HSAA)
                                                                                                            and Publicly Reported Patient Safety Indicators (PRPSI)
                                                                                                                                                                                                          1st Qtr                                                                                      2011/12 QIP
TSH Strategic Direction Indicator                                                                                                            Indicator Origin   QIP Dimension     QIP Priority Rating    Reported    Current Value   Previous Value   2010/11 Target   Current Status   Risk Rating*     Target      Page

                            1. Rate of Hospital Acquired C. difficile Associated Diarrhea (CDI)                                               QIP / PRPSI          Safety                 2                              0.50            0.47             0.33               R                            0.28       A1
                            2. Rate of Central Line Infection (CLI)                                                                           QIP / PRPSI          Safety                 1                              1.48            0.00             0.79               R               L            1.93       A2
                            3. Rate of Ventilator Associated Pneumonia (VAP)                                                                  QIP / PRPSI          Safety                 2                              0.00            0.61             1.33               G              n/a           1.46       A3
Our Patients                4. Rate of hand hygiene compliance before initial patient/patient environment contact                                 QIP              Safety                 2                              83%             93%              90%                R               L            90%        A4
                            5. Rate of hand hygiene compliance after patient/patient environment contact                                                                                                                 90%            100%              90%                G              n/a                      A4
                            6. Rate of Hospital Acquired Methicillin Resistant Staphylococcus Aureus (MRSA) Bacteraemia                          PRPSI                                                                   0.00            0.00             0.02               G              n/a                      A5
                            7. Rate of Hospital Acquired Vancomycin Resistant Enterococcus (VRE) Bacteraemia                                     PRPSI                                                                   0.00            0.00             0.00               G              n/a                      A6
                            8. Rate of Timely Administration of Prophylactic Antibiotics - Primary Hip                                           PRPSI                                                                 100.0%           97.1%            96.1%               G              n/a                      A7
                            9. Rate of Timely Administration of Prophylactic Antibiotics - Primary Knee                                          PRPSI                                                                  96.6%           97.7%            96.1%               G              n/a                      A8
                           10. WHO surgical checklist compliance                                                                                                                                                        100%            100%              98%                G              n/a                      A9
                           11. Hospital Standardized Mortality Ratio (HSMR)                                                                       QIP           Effectiveness             2                               74              84              100                G              n/a           100        A10
                           12. 30 day readmission rate to any facility - All tracked CMGs                                                        QIP            Effectiveness             2                             14.5%           14.5%            14.5%               G              n/a          14.5%       A11
                           13. Percentage of ALC days                                                                                         QIP / HSAA        Effectiveness             1                             15.9%           12.2%            12.2%               R               H           12.2%       A12
                           14. Emergency Department Wait Time for High Acuity Visits - General Campus                                            PRPSI                                                                  17:02            15:12            8:00               R               H                       A14
                           15. Emergency Department Wait Time for High Acuity Visits - Birchmount Campus                                         PRPSI                                                                  20:24            12:12            8:00               R               H                       A15
                           16. Emergency Department Wait Time for Low Acuity Visits - General Campus                                             PRPSI                                                                   5:16            4:48             4:00               R               H                       A16
                           17. Emergency Department Wait Time for Low Acuity Visits - Birchmount Campus                                          PRPSI                                                                   4:55            4:30             4:00               R               H                       A17
                           18. Admitted patient treated within the LOS target of less than 8 hours - General Campus                               P4R                                                                    30%             32%              31%                R               H                       A18
                           19. Admitted patient treated within the LOS target of less than 8 hours - Birchmount Campus                            P4R                                                                    27%             34%              36%                R               H                       A19
                           20. Non-admitted high acuity patients treated within their respective targets of <=8 hours - General Campus            P4R                                                                    91%             90%              87%                G              n/a                      A20
                           21. Non-admitted high acuity patients treated within their respective targets of <=8 hours - Birchmount Campus         P4R                                                                    89%             91%              90%                R               H                       A21
                           22. Non-admitted low acuity patients treated within their respective targets of <=4 hours - General Campus             P4R                                                                    85%             81%              81%                G              n/a                      A22
                           23. Non-admitted low acuity patients treated within their respective targets of <=4 hours - Birchmount Campus          P4R                                                                    81%             83%              77%                G              n/a                      A23
                           24. 90th percentile physician initial assessment time - General Campus                                                PRPSI                                                                   4:21            4:35             4:06               Y              n/a                      A24
                           25. 90th percentile physician initial assessment time - Birchmount Campus                                            PRPSI                                                                    3:40            3:06             3:48               G              n/a                      A25
                           26. 90th Percentile ER Lengh of Stay for Admitted Patients                                                         QIP / HSAA           Access                 1                             44:14            36:43           25:00               R               H           25:00       A26
                           27. 90th Percentile ER Length of Stay for Complex Condition Patients                                               QIP / HSAA           Access                 1                              8:01            8:19             8:00               Y              n/a           8:00       A27
                           28. Wait Time - General Surgery                                                                                   HSAA / PRPSI                                                                 76              67               182               G              n/a                      A28
                           29. Wait Time - Cancer Surgery                                                                                    HSAA / PRPSI                                                                 53              54               84                G              n/a                      A29
                           30. Wait Time - Cataract Surgery                                                                                  HSAA / PRPSI                                                                120              225              182               G              n/a                      A30
                           31. Wait Time - Total Hip Replacement                                                                             HSAA / PRPSI                                                                131              151              182               G              n/a                      A31
                           32. Wait time - Total Knee Replacement                                                                            HSAA / PRPSI                                                                108              153              182               G              n/a                      A32
                           33. Wait Time - CT                                                                                                HSAA / PRPSI                                                                 19              23               28                G              n/a                      A33
                           34. Wait Time - MRI                                                                                               HSAA / PRPSI                                                                 97              116              28                Y              n/a                      A34
                           35. Patient satisfaction - Overall Impression: Emergency Department                                                  QIP             Patient-Centred           1                              54.5            46.7              50                G              n/a            50        A35
                           36. Patient satisfaction - Overall Impression: In-patients                                                             QIP           Patient-Centred           1                              59.2            66.3              70                R               H             70        A36
                           37. Repeat Unplanned Emergency Visited within 30 Days for Mental Health Conditions                                    HSAA                                                   Q1 2011/12
                           38. Repeat Unplanned Emergency Visited within 30 Days for Substance Abuse Conditions                                  HSAA                                                   Q1 2011/12
39. Total margin                                                                                                      QIP / HSAA   Effectiveness   1                      0.04%           -0.31%             0%               G                n/a              0%          A38
                             40. Current Ratio                                                                                                       HSAA                                               0.34             0.39            0.39               R               M                            A39
                             41. Total weighted cases (Inpatient and Day Surgery)                                                                    HSAA                                              42,144           43,027          40,712             G                n/a                          A40
Our Performance              42. Mental Health Patient Days                                                                                          HSAA                                              15,970           15,425          15,000             G                n/a                          A41
                             43. Rehab Patient Days                                                                                                  HSAA                                               2,397           3,221            3,530              R               M                            A42
                             44. Emergency Visits                                                                                                    HSAA                                             103,351           99,915          98,000             G                n/a                          A43
                             45. Ambulatory Visits (excluding ER)                                                                                    HSAA                                             306,954          303,662         294,773             G                n/a                          A44
                             46. Total Hip and Knee Replacement                                                                                      HSAA                                               1,257           1,275            1,225             G                n/a                          A45
                             47. Cataract Surgeries                                                                                                  HSAA                                               5,756           5,894            5,815              R               M                            A46
                             48. Computed Tomography (CT)                                                                                            HSAA                                               8,037           8,352            7,245             G                n/a                          A47
                             49. Magnetic Resonance Imaging (MRI)                                                                                    HSAA                                               6,225           6,123            5,657             G                n/a                          A48

* Risk rating only completed for indicators that are not meeting the target and have not improved over the prior reporting period
Current Status Legend:                                                                                                                                                              Priority Legend
Red = Performance indicator has not met the target for the current reporting period, and has not improved over the prior reporting period                                           Priority 1 - Highest priority
Yellow = Performance is below the target, however it has improved over the previous reporting period                                                                                • Current performance below “benchmark” (if one exists) or below long term goal; significant improvements requ
Green = Performance indicator has met or exceeded or is not statistically different than the performance target for the current reporting period                                    • Aligned with organizational priorities/strategic plan, defined accreditation priority or recommendation, funding
                                                                                                                                                                                    tied to initiative, aligned with government agenda

Risk Rating Legend                                                                                                                                                                  Priority 2 - Moderate priority:
L = Low reputational, financial or operational risk                                                                                                                                 • Current performance just below “benchmark” (if one exists) or below long term goal; room for improvement
M = Medium reputational, financial or operational risk                                                                                                                              • Aligned with organizational priorities/strategic plan, defined accreditation priority or recommendation, funding
H = High reputational, financial or operational risk                                                                                                                                tied to initiative, aligned with government agenda
                                                                                                                                                                                    Priority 3 - Lower priority:
                                                                                                                                                                                    • Current performance at/above” benchmark”, provincial rate or long term goal
                                                                                                                                                                                    • Organizational priority

                                                                                            Vision: To be recognized as Canada’s leader in providing the best healthcare for a global community.
                                                                                         Mission: To provide an outstanding care experience that meets the unique needs of each and every patient.
                                                                                                          Values: I ntegrity, C ompassion, A ccountability, R espect, E xcellence
The Scarborough Hospital
                                                                                 Corporate Balanced Scorecard
                                      Quality Improvement Plan (QIP), Hospital Services Accountability Agreement (HSAA)
                                                    and Publicly Reported Patient Safety Indicators (PRPSI)

Indicator                    QIP - Rate of Hospital Acquired C. difficile Associated Diarrhea
Strategic Direction          Our Patients
Time Frame                   June 2011
Source                       Surveillance and Case Finding

Performance Measurement Summary
Definition
                                                                                           1.20


                                                                                                                                                                                                                                                                                                                                                                                                  1.09, n=9
Overall Rate of hospital acquired C. difficile associated diarrhea. Rate is based on
total number of inpatients/patients with confirmed infection per 1000 patient-days.


                                                                                                                                                                                                                                                                                                                                                                                                                                       0.85, n=5
                                                                                           1.00


                                                                                                                                                                                                                                                                                                                                                                                                          0.78, n=11
Significance
To track hospital acquired C. difficile rates in order to identify and implement
infection control measures to prevent nosocomial spread of C.difficile. While C.           0.80


                                                                                                                                                                                                                                                                               0.58, n=5

                                                                                                                                                                                                                                                                                           0.58, n=5
difficile does not usually present a big problem for reasonably healthy adults, it can


                                                                                                                                                                                                                                                                                                                                            0.53, n=5
                                                                                                           0.51, n=3


                                                                                                                                                                                                                                                                                                                                                                                                                                           0.50, n=7
                                                                                                                                                                 0.49, n=3
                                                                                                                                     0.49, n=3
be quite serious for those who are frail or have other health challenges.


                                                                                                                                                                                                                                                                                                                                                                                                                       0.48, n=4
                                                                                                                                                                                                                                                                          0.47, n=7
                                                                                                                                                                0.47, n=7


                                                                                                                                                                                                                                                                                                                                                                                                                       0.47, n=7
                                                                                                                                                                                                                                                                                                                                                                                                                       0.47, n=3
                                                                                                                                                                0.46, n=4


                                                                                                                                                                                                                                                                                                                                                                                      0.45, n=4
                                                                                                                                                                                                                                                                                                                        0.45, n=4
                                                                                                      0.43, n=6
C. difficile is communicable. It can live in the environment and on other surfaces.        0.60


                                                                                                                                                                                                                                                                                                                                    0.38, n=6
                                                                                                                                                                                     0.37, n=3
                                                                                                   0.36, n=3
Rigorous cleaning regimes, patient isolation and hand washing are some of the


                                                                                                                                                                                                                                                                                                   0.35, n=5


                                                                                                                                                                                                                                                                                                                                                                                                      0.34, n=2
                                                                                                                             0.34, n=5


                                                                                                                                                                                                           0.34, n=2


                                                                                                                                                                                                                                                                   0.33, n=2


                                                                                                                                                                                                                                                                                                                                                                               0.32, n=5
strategies used to combat C. difficile.


                                                                                                                                                                                                                                                                                                               0.26, n=4
                                                                                                                                                                                                                                                       0.26, n=2


                                                                                                                                                                                                                                                                                                                                                           0.25, n=2


                                                                                                                                                                                                                                                                                                                                                                                                                                   0.25, n=2
                                                                                                                                                    0.24, n=2
                                                                                                                       0.23, n=2


                                                                                                                                                                                                                                                                                                                                                          0.22, n=3
                                                                                                                                                                             0.22, n=3

                                                                                                                                                                                                     0.22, n=3
                                                                                           0.40                                                                                                        CHART PLACEHOLDER


                                                                                                                                                   0.20, n=3
Target


                                                                                                                                                                                                                                                                                                                                                        0.17, n=1
                                                                                                                                                 0.16, n=1


                                                                                                                                                                                                                                                                                                                                        0.15, n=1


                                                                                                                                                                                                                                                                                                                                                                       0.15, n=1
                                                                                                                                                                                                                                                 0.15, n=2
Ontario Average - 0.33, lower value is desired.


                                                                                                                                                                                                                              0.13, n=1
                                                                                                                                                                                                 0.13, n=1


                                                                                                                                                                                                                          0.07, n=1
Risk Rating
                                                                                           0.20


                                                                                                                                                                                 0.00, n=0


                                                                                                                                                                                                                       0.00, n=0

                                                                                                                                                                                                                                          0.00, n=0


                                                                                                                                                                                                                                                                                               0.00, n=0

                                                                                                                                                                                                                                                                                                                   0.00, n=0
n/a


Analysis                                                                                       -
QIP use rate for January to December 2010. There have been a few months of


                                                                                                                                                                                                     Jul 10
                                                                                                                            Mar 10


                                                                                                                                                                                                                                                                                               Nov 10

                                                                                                                                                                                                                                                                                                                   Dec 10

                                                                                                                                                                                                                                                                                                                                        Jan 11


                                                                                                                                                                                                                                                                                                                                                                            Mar 11
                                                                                                                                                                                                                                                                        Oct 10
                                                                                                       Feb 10


                                                                                                                                                   Apr 10

                                                                                                                                                                  May 10


                                                                                                                                                                                                                          Aug 10

                                                                                                                                                                                                                                               Sep 10


                                                                                                                                                                                                                                                                                                                                                          Feb 11


                                                                                                                                                                                                                                                                                                                                                                                                      Apr 11

                                                                                                                                                                                                                                                                                                                                                                                                                         May 11
                                                                                                                                                                                 Jun 10


                                                                                                                                                                                                                                                                                                                                                                                                                                       Jun 11
increased cases of C. difficile at the General Campus since February 2010. Rates
have begun to decline with increased monitoring and vigilance of infection control
practices in the inpatient areas. The Birchmount Campus remains below the                                                 General Campus                                                                                                                                                                       Birchmount Campus
Ontario Average.                                                                                                          TSH                                                                                                                                                                                  Ontario Average per 1,000 patient-days
                                                                                                                          TSH Rolling 12-month Average                                                                                                                                                         QIP Reported Value=0.26


Action Plan
SMART Initiative (Specific, Measureable, Attainable, Realistic, Time-Bound)              Lead                                                                   Date Initiated                                                                               Current Status
Indicator meeting or exceeding target, no action plan required                           n/a                                                                    n/a                                                                                          n/a


                                                                                                   Page A1
The Scarborough Hospital
                                                                                Corporate Balanced Scorecard
                                     Quality Improvement Plan (QIP), Hospital Services Accountability Agreement (HSAA)
                                                   and Publicly Reported Patient Safety Indicators (PRPSI)

Indicator                    QIP - Rate of Central Line Infection (CLI)
Strategic Direction          Our Patients
Time Frame                   Q1 2011/12
Source                       Surveillance and Case Finding

Performance Measurement Summary
Definition
Overall rate of hospital acquired Central Line Infection. Rate is based on total           8.00


                                                                                                                                                       6.32, n=6
number of CLI incidents diagnosed after two days of Critical Care admission per
1000 patient days.                                                                         7.00


                                                                                                                   4.98, n=5
Significance                                                                               6.00


                                                                                                                                                                               4.58, n=6
To track hospital acquired CLI rates in order to identify and implement necessary


                                                                                                                                           3.90, n=6
prevention plans to reduce the risk of infection from spreading.                           5.00


                                                                                           4.00


                                                                                                                                                                                                                                  2.54, n=1
                                                                                                                                                                                                       2.36, n=1


                                                                                                                                                                                                                                2.31, n=3
Target


                                                                                                                                                                                                                               2.21, n=2


                                                                                                                                                                                                                                                                  2.06, n=3
Ontario Average - 0.79, lower value is desired.


                                                                                                                               1.87, n=1
                                                                                           3.00                                                                            CHART PLACEHOLDER


                                                                                                                                                                                                                                                                                          1.48, n=3
Risk Rating


                                                                                                                                                                                                                                                                                                            0.78, n=1
                                                                                           2.00


                                                                                                                                                                                                                   0.69, n=1


                                                                                                                                                                                                                                                                                                           0.62, n=1
Low - Controlling the rate of infection is very important to TSH. The increase in the
rate of infection may cause some financial and reputational risk to the organization.


                                                                                                   0.00, n=0
                                                                                                   0.00, n=0
                                                                                                   0.00, n=0


                                                                                                                                                                   0.00, n=0


                                                                                                                                                                                           0.00, n=0


                                                                                                                                                                                                                                                   0.00, n=0
                                                                                                                                                                                                                                                   0.00, n=0
                                                                                                                                                                                                                                                   0.00, n=0


                                                                                                                                                                                                                                                                              0.00, n=0


                                                                                                                                                                                                                                                                                                      0.00, n=0
                                                                                           1.00
Analysis
QIP use rate for January to December 2010. There has been a marked
improvement to the number of CLI cases in 2010/11 at the General Campus. CLI               0.00
strategies to standardize processes across the campuses is showing improvements                   Q2 2009/10 Q3 2009/10 Q4 2009/10 Q1 2010/11 Q2 2010/11 Q3 2010/11 Q4 2010/11 Q1 2011/12
in the rates. There is lower rate of infection associated with PICC, therefore the use
of PICC has been increased.                                                                              General Campus                                                                                                                       Birchmount Campus
                                                                                                         TSH                                                                                                                                  Ontario Average per 1,000 patient-days
                                                                                                         TSH Rolling 12-month Average                                                                                                         QIP Reported Value=1.76


Action Plan
SMART Initiative (Specific, Measureable, Attainable, Realistic, Time-Bound)              Lead                                        Date Initiated                                                                     Current Status
Monthly monitoring of insertions and maintenance Bundle which includes hand         H. Clasky, D. Rose, P.                           Apr-10                                                                             Monthly audits
hygiene, maximal barrier precautions, and chlorhexidine skin antisepsis and optimal Tamlin, R. Lovinsky, C.
catheter side selection to adhere the compliance of 90% to decrease rate of CLI for Shelton
the next quarter
Expanded data collection to include the program that the hemodialysis patients are       H. Clasky, R. Lovinsky,                     Mar-11                                                                             Data collection in progress
coming from, type of line being used, and CLI reduction interventions such as the        IPAC
use of chlorhexidine dressing and bath to investigate higher rate of CLI in the
hemodialysis population by Q2 of 2011/12


                                                                                                  Page A2
Page A2
The Scarborough Hospital
                                                                              Corporate Balanced Scorecard
                                     Quality Improvement Plan (QIP), Hospital Services Accountability Agreement (HSAA)
                                                   and Publicly Reported Patient Safety Indicators (PRPSI)

Indicator                   QIP - Rate of Ventilator Associated Pneumonia (VAP)
Strategic Direction         Our Patients
Time Frame                  Q1 2011/12
Source                      Surveillance and Case Finding

Performance Measurement Summary
Definition
Overall Rate of hospital acquired Ventilator Associated Pneumonia. Rate is based       7.0
on total number of VAP incidents diagnosed after two days of Critical Care
admission per 1000 patient days.
                                                                                       6.0


                                                                                                                                                                                    0.00, n=0
Significance
                                                                                       5.0
To track hospital acquired VAP rates in order to identify and implement necessary
prevention plans to reduce the risk of development of pneumonia in the ICU patient
population.                                                                            4.0


                                                                                                                          2.47, n=2
Target                                                                                 3.0


                                                                                                                                                              1.63, n=2
Ontario Average - 1.33, lower value is desired.


                                                                                                                                          1.58, n=2


                                                                                                                                                                            1.40, n=1


                                                                                                                                                                                                                                                          1.36, n=2
                                                                                                                                              CHART PLACEHOLDER


                                                                                                                                                                                                                       1.14, n=1


                                                                                                                                                                                                                                                       0.97, n=1
                                                                                                                                                                                            0.90, n=1
                                                                                       2.0


                                                                                                                                                                                                                    0.76, n=1
Risk Rating
n/a


                                                                                              0.00, n=0
                                                                                              0.00, n=0
                                                                                              0.00, n=0


                                                                                                           0.00, n=0
                                                                                                           0.00, n=0
                                                                                                           0.00, n=0


                                                                                                                                  0.00, n=0


                                                                                                                                                      0.00, n=0
                                                                                                                                                      4.56, n=2


                                                                                                                                                                                                             0.00, n=0


                                                                                                                                                                                                                                   0.00, n=0
                                                                                                                                                                                                                                   0.00, n=0
                                                                                                                                                                                                                                   0.00, n=0


                                                                                                                                                                                                                                               2.26, n=1
                                                                                       1.0
Analysis
QIP use rate for January to December 2010. There were zero VAP case
                                                                                       0.0
identified in the Q4. Currently meeting target.
                                                                                             Q2 2009/10 Q3 2009/10 Q4 2009/10 Q1 2010/11 Q2 2010/11 Q3 2010/11 Q4 2010/11

                                                                                                      General Campus                                                                                    Birchmount Campus
                                                                                                      TSH                                                                                               Ontario Average per 1,000 patient-days
                                                                                                      TSH Rolling 12-month Average                                                                      QIP Reported Value=1.22


Action Plan
SMART Initiative (Specific, Measureable, Attainable, Realistic, Time-Bound)          Lead                        Date Initiated                                       Current Status
Indicator meeting or exceeding target, no action plan required                       n/a                         n/a                                                  n/a


                                                                                             Page A3
The Scarborough Hospital
                                                                                 Corporate Balanced Scorecard
                                         Quality Improvement Plan (QIP), Hospital Services Accountability Agreement (HSAA)
                                                       and Publicly Reported Patient Safety Indicators (PRPSI)

Indicator                    QIP - Rate of hand hygiene compliance
Strategic Direction          Our Patients
Time Frame                   Q1 2011/12
Source                       Surveillance and Case Finding

Performance Measurement Summary
Definition
The single most common way of transferring health care-associated infections (HAIs)         140%
in health care settings is on the hands of health care providers. Health care providers


                                                                                                                                                                                                                                                                  100%, n=56
                                                                                                                                                                                                                                                                  100%, n=56
                                                                                                                                             100%, n=7


                                                                                                                                                                                               96%, n=392
                                                                                                                                                                                               96%, n=392
move from patient to patient and room to room while providing care and working in the


                                                                                                                                                           92%, n=1180
                                                                                                                                                           92%, n=1187
                                                                                                                          97%, n=58


                                                                                                                                                                                                                  96%, n=25
                                                                                                                                                                                                                  96%, n=25


                                                                                                                                                                                                                                  96%, n=25
                                                                                                                                                                                                                                  96%, n=25
                                                                                            120%


                                                                                                           95%, n=57


                                                                                                                                                                                                                                                  93%, n=52
                                                                                                                                                                                                                                                  93%, n=52


                                                                                                                                                                                                                                                                                    93%, n=62


                                                                                                                                                                                                                                                                                                90%, n=301
                                                                                                                                                                                                                                                                                                90%, n=361
                                                                                                                       89%, n=412
patient environment. This movement provides many opportunities for the transmission


                                                                                                                                       85%, n=1070
                                                                                                                                       85%, n=1063
                                                                                                                       88%, n=354


                                                                                                                                                                              87%, n=360
                                                                                                                                                                              87%, n=360


                                                                                                                                                                                                                                                                                                90%, n=60
                                                                                                        85%, n=391
                                                                                                       84%, n=334


                                                                                                                                                                                                                                                                                83%, n=330
                                                                                                                                                         88%, n=7
of organisms on hands that can cause infections.


                                                                                                                                                                                                                                                                               81%, n=268
                                                                                            100%

Significance
Proper hand hygiene protects patients and providers and will reduce the spread of            80%
infections and the associated treatment costs, reduce hospital lengths of stay and
readmissions, reduce wait times, and prevent deaths.
                                                                                             60%

Target.                                                                                                                                                                  CHART PLACEHOLDER
Ontario Target - 90% Before and 90% After, higher value is desired.                          40%


Risk Rating
                                                                                             20%


                                                                                                                                                                          0%, n=0


                                                                                                                                                                                           0%, n=0


                                                                                                                                                                                                             0%, n=0


                                                                                                                                                                                                                              0%, n=0


                                                                                                                                                                                                                                              0%, n=0


                                                                                                                                                                                                                                                              0%, n=0
Low- Reputational, financial or operational risk.


Analysis                                                                                         0%
QIP use rate for 2009/10, only for before patient contact. Due to the lack of hand                     Before           After          Before             After           Before             After           Before             After         Before            After          Before            After
hygiene auditors and the VRE issue, there were not enough audits done to report for
Q3 at the General Campus. In Q4 IPAC trained unit based auditors to carryout the                           Q3 2009/10                      Q4 2009/10                          Q1 2010/11                         Q2 2010/11                       Q3 2010/11                      Q4 2010/11
audits to meet mandatory reporting requirements. The results of the before compliance
are below TSH target; however, well above the Ontario average of 72.17%.
                                                                                                      General Campus                                Birchmount Campus                                       TSH                     Target                     QIP Reported Value=92.3%


Action Plan
SMART Initiative (Specific, Measureable, Attainable, Realistic, Time-Bound)               Lead                                        Date Initiated                                                 Current Status
Development of a audit process to monitor unit based hand hygiene audits and      IPAC                                                Mar-11                                                         In progress, on a monthly basis
program overseen by IPAC and Decision Support. Monthly audit to observe number of
times hand hygiene performed before patient contact.


                                                                                                      Page A4
The Scarborough Hospital
                                                                               Corporate Balanced Scorecard
                                     Quality Improvement Plan (QIP), Hospital Services Accountability Agreement (HSAA)
                                                   and Publicly Reported Patient Safety Indicators (PRPSI)

Indicator                   Rate of Hospital Acquired Methicillin Resistant Staphylococcus Aureus (MRSA) Bacteraemia
Strategic Direction         Our Patients
Time Frame                  Q1 2011/12
Source                      Surveillance and Case Finding

Performance Measurement Summary
Definition                                                                                   0.16
Overall Rate of hospital acquired Methicillin Resistant Staphylococcus Aureus
(MRSA) bacteraemia. Rate is based on total number of inpatients/patients with
                                                                                             0.14
confirmed infection per 1000 patient-days.

                                                                                             0.12
Significance
Higher MRSA colonization rates will lead to higher rates of blood stream infections          0.10
with MRSA. Tracking hospital acquired MRSA Bacteraemia rates helps to identify


                                                                                                                       0.06, n=1
the clinical significance of MRSA colonization. This will help identify a need for           0.08
further strategies to prevent nosocomial spread of MRSA.


                                                                                                                                                                                                                                  0.04, n=1


                                                                                                                                                                                                                                                                                    0.04, n=1
                                                                                                                                                                             0.04, n=1
                                                                                                                                                     0.04, n=1
Target                                                                                       0.06


                                                                                                                                                                                                                            0.02, n=1


                                                                                                                                                                                                                                                                              0.02, n=1
                                                                                                                                                0.02, n=1


                                                                                                                                                                        0.02, n=1
                                                                                                                             0.02, n=1
Ontario Average - 0.02, lower value is desired.
                                                                                             0.04                                                                CHART PLACEHOLDER
Risk Rating


                                                                                                    0.00, n=0
                                                                                                    0.00, n=0
                                                                                                    0.00, n=0

                                                                                                                 0.00, n=0


                                                                                                                                         0.00, n=0


                                                                                                                                                                 0.00, n=0


                                                                                                                                                                                         0.00, n=0
                                                                                                                                                                                         0.00, n=0
                                                                                                                                                                                         0.00, n=0

                                                                                                                                                                                                     0.00, n=0
                                                                                                                                                                                                     0.00, n=0
                                                                                                                                                                                                     0.00, n=0


                                                                                                                                                                                                                    0.00, n=0


                                                                                                                                                                                                                                              0.00, n=0
                                                                                                                                                                                                                                              0.00, n=0
                                                                                                                                                                                                                                              0.00, n=0

                                                                                                                                                                                                                                                          0.00, n=0
                                                                                                                                                                                                                                                          0.00, n=0
                                                                                                                                                                                                                                                          0.00, n=0


                                                                                                                                                                                                                                                                      0.00, n=0
n/a
                                                                                             0.02

                                                                                             0.00
Analysis
Both General Campus and Birchmount Campus remains below the Ontario
Average.


                                                                                                           General Campus                                                                                        Birchmount Campus
                                                                                                           TSH                                                                                                   Ontario Average per 1,000 patient-days
                                                                                                           TSH Rolling 12-month Average


Action Plan
SMART Initiative (Specific, Measureable, Attainable, Realistic, Time-Bound)           Lead                                     Date Initiated                                                Current Status
Indicator meeting or exceeding target, no action plan required                        n/a                                      n/a                                                           n/a


                                                                                                Page A5
The Scarborough Hospital
                                                                              Corporate Balanced Scorecard
                                     Quality Improvement Plan (QIP), Hospital Services Accountability Agreement (HSAA)
                                                   and Publicly Reported Patient Safety Indicators (PRPSI)

Indicator                   Rate of Hospital Acquired Vancomycin Resistant Enterococcus (VRE) Bacteraemia
Strategic Direction         Our Patients
Time Frame                  Q1 2011/12
Source                      Surveillance and Case Finding

Performance Measurement Summary
Definition
Overall Rate of hospital acquired Vancomycin Resistant Enterococcus (VRE)               0.012
bacteraemia. Rate is based on total number of inpatients/patients with confirmed
infection per 1000 patient-days.
                                                                                        0.010

Significance
To track hospital acquired VRE bacteraemia rates in order to identify and implement     0.008
necessary prevention plans to reduce the risk of infection from spreading.
                                                                                        0.006

Target
                                                                                        0.004
Ontario Average - 0.00, lower value is desired.
                                                                                                                                         CHART PLACEHOLDER


                                                                                                 0.00, n=0
                                                                                                 0.00, n=0
                                                                                                 0.00, n=0

                                                                                                               0.00, n=0
                                                                                                               0.00, n=0
                                                                                                               0.00, n=0

                                                                                                                             0.00, n=0
                                                                                                                             0.00, n=0
                                                                                                                             0.00, n=0

                                                                                                                                         0.00, n=0
                                                                                                                                         0.00, n=0
                                                                                                                                         0.00, n=0

                                                                                                                                                     0.00, n=0
                                                                                                                                                     0.00, n=0
                                                                                                                                                     0.00, n=0

                                                                                                                                                                 0.00, n=0
                                                                                                                                                                 0.00, n=0
                                                                                                                                                                 0.00, n=0

                                                                                                                                                                                0.00, n=0
                                                                                                                                                                                0.00, n=0
                                                                                                                                                                                0.00, n=0

                                                                                                                                                                                            0.00, n=0
                                                                                                                                                                                            0.00, n=0
                                                                                                                                                                                            0.00, n=0

                                                                                                                                                                                                        0.00, n=0
                                                                                                                                                                                                        0.00, n=0
                                                                                                                                                                                                        0.00, n=0

                                                                                                                                                                                                                    0.00, n=0
                                                                                                                                                                                                                    0.00, n=0
                                                                                                                                                                                                                    0.00, n=0
Risk Rating                                                                             0.002
n/a

                                                                                        0.000
Analysis
There have been no reportable cases of VRE bacteraemia despite increased
numbers of VRE colonized patients since April 2010.

                                                                                                             General Campus                                                  Birchmount Campus
                                                                                                             TSH                                                             Ontario Average per 1,000 patient-days
                                                                                                             TSH Rolling 12-month Average


Action Plan
SMART Initiative (Specific, Measureable, Attainable, Realistic, Time-Bound)           Lead                             Date Initiated                      Current Status
Indicator meeting or exceeding target, no action plan required                        n/a                              n/a                                 n/a


                                                                                                Page A6
Tsh scorecard   corporate - 2010 11 q4 c

Más contenido relacionado

Destacado

Nuevo trabajo 2
Nuevo trabajo 2Nuevo trabajo 2
Nuevo trabajo 2alejoxs
 
plegable molecular
plegable molecularplegable molecular
plegable molecularHeyly
 
Counter trafficking problems and inefficiencies
Counter trafficking problems and inefficienciesCounter trafficking problems and inefficiencies
Counter trafficking problems and inefficienciesthemekongclub
 
Research and planning
Research and planningResearch and planning
Research and planningnsasu94
 
Dr. Jack West Oncology 2.0, to WA AG's Office
Dr. Jack West Oncology 2.0, to WA AG's OfficeDr. Jack West Oncology 2.0, to WA AG's Office
Dr. Jack West Oncology 2.0, to WA AG's OfficeH. Jack West
 
Step by Step Double Page Spread
Step by Step Double Page SpreadStep by Step Double Page Spread
Step by Step Double Page SpreadTori Sewart
 
Fcds mid term 3
Fcds mid term 3Fcds mid term 3
Fcds mid term 3dalufcds
 
NewcastleGateshead Initiative Partner Update Meeting 11.06.2015
NewcastleGateshead Initiative Partner Update Meeting 11.06.2015NewcastleGateshead Initiative Partner Update Meeting 11.06.2015
NewcastleGateshead Initiative Partner Update Meeting 11.06.2015newcastlegateshead
 
irem waseem, economic system
irem waseem, economic systemirem waseem, economic system
irem waseem, economic systemIrem Waseem
 
Production logsend
Production logsendProduction logsend
Production logsendnsasu94
 
Production log
Production logProduction log
Production lognsasu94
 
Lectores y escritores
Lectores y escritoresLectores y escritores
Lectores y escritoresLusy Chisag
 
Business leaders' briefing 12 september 2012 newcastle gateshead initiative f...
Business leaders' briefing 12 september 2012 newcastle gateshead initiative f...Business leaders' briefing 12 september 2012 newcastle gateshead initiative f...
Business leaders' briefing 12 september 2012 newcastle gateshead initiative f...newcastlegateshead
 
Business leaders' briefing 18 april 2012 newcastle gateshead initiative
Business leaders' briefing 18 april 2012 newcastle gateshead initiativeBusiness leaders' briefing 18 april 2012 newcastle gateshead initiative
Business leaders' briefing 18 april 2012 newcastle gateshead initiativenewcastlegateshead
 
Production log editing
Production log editingProduction log editing
Production log editingnsasu94
 

Destacado (19)

Smoking
SmokingSmoking
Smoking
 
Pollution of water- Ashish
Pollution of water- AshishPollution of water- Ashish
Pollution of water- Ashish
 
Nuevo trabajo 2
Nuevo trabajo 2Nuevo trabajo 2
Nuevo trabajo 2
 
plegable molecular
plegable molecularplegable molecular
plegable molecular
 
Counter trafficking problems and inefficiencies
Counter trafficking problems and inefficienciesCounter trafficking problems and inefficiencies
Counter trafficking problems and inefficiencies
 
Research and planning
Research and planningResearch and planning
Research and planning
 
Dr. Jack West Oncology 2.0, to WA AG's Office
Dr. Jack West Oncology 2.0, to WA AG's OfficeDr. Jack West Oncology 2.0, to WA AG's Office
Dr. Jack West Oncology 2.0, to WA AG's Office
 
Step by Step Double Page Spread
Step by Step Double Page SpreadStep by Step Double Page Spread
Step by Step Double Page Spread
 
Fcds mid term 3
Fcds mid term 3Fcds mid term 3
Fcds mid term 3
 
Partner Update 20th June 2013
Partner Update 20th June 2013Partner Update 20th June 2013
Partner Update 20th June 2013
 
NewcastleGateshead Initiative Partner Update Meeting 11.06.2015
NewcastleGateshead Initiative Partner Update Meeting 11.06.2015NewcastleGateshead Initiative Partner Update Meeting 11.06.2015
NewcastleGateshead Initiative Partner Update Meeting 11.06.2015
 
irem waseem, economic system
irem waseem, economic systemirem waseem, economic system
irem waseem, economic system
 
Production logsend
Production logsendProduction logsend
Production logsend
 
Production log
Production logProduction log
Production log
 
Evgeniy chilevskiy
Evgeniy chilevskiyEvgeniy chilevskiy
Evgeniy chilevskiy
 
Lectores y escritores
Lectores y escritoresLectores y escritores
Lectores y escritores
 
Business leaders' briefing 12 september 2012 newcastle gateshead initiative f...
Business leaders' briefing 12 september 2012 newcastle gateshead initiative f...Business leaders' briefing 12 september 2012 newcastle gateshead initiative f...
Business leaders' briefing 12 september 2012 newcastle gateshead initiative f...
 
Business leaders' briefing 18 april 2012 newcastle gateshead initiative
Business leaders' briefing 18 april 2012 newcastle gateshead initiativeBusiness leaders' briefing 18 april 2012 newcastle gateshead initiative
Business leaders' briefing 18 april 2012 newcastle gateshead initiative
 
Production log editing
Production log editingProduction log editing
Production log editing
 

Similar a Tsh scorecard corporate - 2010 11 q4 c

SGS NGO Benchmark Audit
SGS NGO Benchmark AuditSGS NGO Benchmark Audit
SGS NGO Benchmark AuditRaj RANA
 
Chevron Section1 V1
Chevron Section1 V1Chevron Section1 V1
Chevron Section1 V1mfeKEG
 
How to improve medical records completion: Locarno Hospital
How to improve medical records completion: Locarno HospitalHow to improve medical records completion: Locarno Hospital
How to improve medical records completion: Locarno HospitalGiovanni Rabito
 
EnergyPoint Research Company Overview (Apr 2010)
EnergyPoint Research Company Overview (Apr 2010)EnergyPoint Research Company Overview (Apr 2010)
EnergyPoint Research Company Overview (Apr 2010)Doug Sheridan
 
Session 5C Measuring Public Financial Management Performance - Charles Seibert
Session 5C Measuring Public Financial Management Performance - Charles SeibertSession 5C Measuring Public Financial Management Performance - Charles Seibert
Session 5C Measuring Public Financial Management Performance - Charles SeibertInternational Federation of Accountants
 
Heizer om10 ch06-managing quality
Heizer om10 ch06-managing qualityHeizer om10 ch06-managing quality
Heizer om10 ch06-managing qualityRozaimi Mohd Saad
 
Safe II Project Presentation June 2010
Safe II Project Presentation June 2010Safe II Project Presentation June 2010
Safe II Project Presentation June 2010Ada Dortch
 
Pharma Clinical Affairs Excellence Research Summary
Pharma Clinical Affairs Excellence Research SummaryPharma Clinical Affairs Excellence Research Summary
Pharma Clinical Affairs Excellence Research SummaryBest Practices
 
NEPT -Omthera reported positive phase 3 trial
NEPT -Omthera reported positive phase 3 trialNEPT -Omthera reported positive phase 3 trial
NEPT -Omthera reported positive phase 3 trialmarketscanners
 
Evaluation of trained Accredited Social Health Activist (ASHA) workers and Su...
Evaluation of trained Accredited Social Health Activist (ASHA) workers and Su...Evaluation of trained Accredited Social Health Activist (ASHA) workers and Su...
Evaluation of trained Accredited Social Health Activist (ASHA) workers and Su...Dr.Tanmay Singh
 
University of Toledo Medical Center Patient Experience Improvement Strategic ...
University of Toledo Medical Center Patient Experience Improvement Strategic ...University of Toledo Medical Center Patient Experience Improvement Strategic ...
University of Toledo Medical Center Patient Experience Improvement Strategic ...Ioan Duca
 

Similar a Tsh scorecard corporate - 2010 11 q4 c (20)

Tsh scorecard corporate - 2010 11 q3 d
Tsh scorecard   corporate - 2010 11 q3 dTsh scorecard   corporate - 2010 11 q3 d
Tsh scorecard corporate - 2010 11 q3 d
 
TSH Corporate Scorecard - 2010 11 q3 c
TSH Corporate Scorecard - 2010 11 q3 cTSH Corporate Scorecard - 2010 11 q3 c
TSH Corporate Scorecard - 2010 11 q3 c
 
Tsh scorecard corporate - 2010 11 q3 b
Tsh scorecard   corporate - 2010 11 q3 bTsh scorecard   corporate - 2010 11 q3 b
Tsh scorecard corporate - 2010 11 q3 b
 
Evaluating Environmental and Social Effects of International Projects
Evaluating Environmental and Social Effects of International ProjectsEvaluating Environmental and Social Effects of International Projects
Evaluating Environmental and Social Effects of International Projects
 
SGS NGO Benchmark Audit
SGS NGO Benchmark AuditSGS NGO Benchmark Audit
SGS NGO Benchmark Audit
 
Chevron Section1 V1
Chevron Section1 V1Chevron Section1 V1
Chevron Section1 V1
 
How to improve medical records completion: Locarno Hospital
How to improve medical records completion: Locarno HospitalHow to improve medical records completion: Locarno Hospital
How to improve medical records completion: Locarno Hospital
 
EnergyPoint Research Company Overview (Apr 2010)
EnergyPoint Research Company Overview (Apr 2010)EnergyPoint Research Company Overview (Apr 2010)
EnergyPoint Research Company Overview (Apr 2010)
 
Session 5C Measuring Public Financial Management Performance - Charles Seibert
Session 5C Measuring Public Financial Management Performance - Charles SeibertSession 5C Measuring Public Financial Management Performance - Charles Seibert
Session 5C Measuring Public Financial Management Performance - Charles Seibert
 
Heizer om10 ch06-managing quality
Heizer om10 ch06-managing qualityHeizer om10 ch06-managing quality
Heizer om10 ch06-managing quality
 
Safe II Project Presentation June 2010
Safe II Project Presentation June 2010Safe II Project Presentation June 2010
Safe II Project Presentation June 2010
 
Pharma Clinical Affairs Excellence Research Summary
Pharma Clinical Affairs Excellence Research SummaryPharma Clinical Affairs Excellence Research Summary
Pharma Clinical Affairs Excellence Research Summary
 
HMP Metrics™ Report October, 2010
HMP Metrics™ Report October, 2010HMP Metrics™ Report October, 2010
HMP Metrics™ Report October, 2010
 
@GRIAusConf_Report Quality and Assurance - Renzo Mori Junior
@GRIAusConf_Report Quality and Assurance - Renzo Mori Junior@GRIAusConf_Report Quality and Assurance - Renzo Mori Junior
@GRIAusConf_Report Quality and Assurance - Renzo Mori Junior
 
2008-2014 Math
2008-2014 Math 2008-2014 Math
2008-2014 Math
 
hris-1207896670311343-8
hris-1207896670311343-8hris-1207896670311343-8
hris-1207896670311343-8
 
NEPT -Omthera reported positive phase 3 trial
NEPT -Omthera reported positive phase 3 trialNEPT -Omthera reported positive phase 3 trial
NEPT -Omthera reported positive phase 3 trial
 
Evaluation of trained Accredited Social Health Activist (ASHA) workers and Su...
Evaluation of trained Accredited Social Health Activist (ASHA) workers and Su...Evaluation of trained Accredited Social Health Activist (ASHA) workers and Su...
Evaluation of trained Accredited Social Health Activist (ASHA) workers and Su...
 
University of Toledo Medical Center Patient Experience Improvement Strategic ...
University of Toledo Medical Center Patient Experience Improvement Strategic ...University of Toledo Medical Center Patient Experience Improvement Strategic ...
University of Toledo Medical Center Patient Experience Improvement Strategic ...
 
Reporting the Review Quiz
Reporting the Review QuizReporting the Review Quiz
Reporting the Review Quiz
 

Más de The Scarborough Hospital

Consent & Capacity - Substitute Decision Makers
Consent & Capacity - Substitute Decision MakersConsent & Capacity - Substitute Decision Makers
Consent & Capacity - Substitute Decision MakersThe Scarborough Hospital
 
The Scarborough Hospital Clinical Action Plan
The Scarborough Hospital Clinical Action PlanThe Scarborough Hospital Clinical Action Plan
The Scarborough Hospital Clinical Action PlanThe Scarborough Hospital
 

Más de The Scarborough Hospital (20)

Health System Transformation
Health System TransformationHealth System Transformation
Health System Transformation
 
Medical ethics aug2012
Medical ethics aug2012Medical ethics aug2012
Medical ethics aug2012
 
Eldercare: Planning Your Geriatric Future
Eldercare: Planning Your Geriatric FutureEldercare: Planning Your Geriatric Future
Eldercare: Planning Your Geriatric Future
 
TSH - Focusing on Excellence
TSH - Focusing on ExcellenceTSH - Focusing on Excellence
TSH - Focusing on Excellence
 
TSH Services
TSH ServicesTSH Services
TSH Services
 
TSH Services
TSH ServicesTSH Services
TSH Services
 
Consent & Capacity - Substitute Decision Makers
Consent & Capacity - Substitute Decision MakersConsent & Capacity - Substitute Decision Makers
Consent & Capacity - Substitute Decision Makers
 
The Scarborough Hospital Clinical Action Plan
The Scarborough Hospital Clinical Action PlanThe Scarborough Hospital Clinical Action Plan
The Scarborough Hospital Clinical Action Plan
 
Community resource guide
Community resource guideCommunity resource guide
Community resource guide
 
2011-12 hsaa - may 26-11
2011-12 hsaa - may 26-112011-12 hsaa - may 26-11
2011-12 hsaa - may 26-11
 
2011 05-28 tsh foundation
2011 05-28 tsh foundation2011 05-28 tsh foundation
2011 05-28 tsh foundation
 
2011 05-28 dr. john wright
2011 05-28 dr. john wright2011 05-28 dr. john wright
2011 05-28 dr. john wright
 
2011 05-28 pam marshall
2011 05-28 pam marshall2011 05-28 pam marshall
2011 05-28 pam marshall
 
scc-apr-21-2011
scc-apr-21-2011scc-apr-21-2011
scc-apr-21-2011
 
At issue april2010_web
At issue april2010_webAt issue april2010_web
At issue april2010_web
 
Celebrating 73 Success Stories
Celebrating 73 Success StoriesCelebrating 73 Success Stories
Celebrating 73 Success Stories
 
St paul's presentation sept 14, 2010
St paul's presentation   sept  14, 2010St paul's presentation   sept  14, 2010
St paul's presentation sept 14, 2010
 
Ryerson iss feb. 3, 2010
Ryerson iss   feb. 3, 2010Ryerson iss   feb. 3, 2010
Ryerson iss feb. 3, 2010
 
Ryerson oct.29, 2010
Ryerson   oct.29, 2010Ryerson   oct.29, 2010
Ryerson oct.29, 2010
 
Renascent feb 25 2011
Renascent  feb  25 2011Renascent  feb  25 2011
Renascent feb 25 2011
 

Último

VIP Mumbai Call Girls Hiranandani Gardens Just Call 9920874524 with A/C Room ...
VIP Mumbai Call Girls Hiranandani Gardens Just Call 9920874524 with A/C Room ...VIP Mumbai Call Girls Hiranandani Gardens Just Call 9920874524 with A/C Room ...
VIP Mumbai Call Girls Hiranandani Gardens Just Call 9920874524 with A/C Room ...Garima Khatri
 
Call Girls Varanasi Just Call 9907093804 Top Class Call Girl Service Available
Call Girls Varanasi Just Call 9907093804 Top Class Call Girl Service AvailableCall Girls Varanasi Just Call 9907093804 Top Class Call Girl Service Available
Call Girls Varanasi Just Call 9907093804 Top Class Call Girl Service AvailableDipal Arora
 
Top Rated Bangalore Call Girls Richmond Circle ⟟ 8250192130 ⟟ Call Me For Gen...
Top Rated Bangalore Call Girls Richmond Circle ⟟ 8250192130 ⟟ Call Me For Gen...Top Rated Bangalore Call Girls Richmond Circle ⟟ 8250192130 ⟟ Call Me For Gen...
Top Rated Bangalore Call Girls Richmond Circle ⟟ 8250192130 ⟟ Call Me For Gen...narwatsonia7
 
The Most Attractive Hyderabad Call Girls Kothapet 𖠋 6297143586 𖠋 Will You Mis...
The Most Attractive Hyderabad Call Girls Kothapet 𖠋 6297143586 𖠋 Will You Mis...The Most Attractive Hyderabad Call Girls Kothapet 𖠋 6297143586 𖠋 Will You Mis...
The Most Attractive Hyderabad Call Girls Kothapet 𖠋 6297143586 𖠋 Will You Mis...chandars293
 
Top Rated Bangalore Call Girls Mg Road ⟟ 8250192130 ⟟ Call Me For Genuine Sex...
Top Rated Bangalore Call Girls Mg Road ⟟ 8250192130 ⟟ Call Me For Genuine Sex...Top Rated Bangalore Call Girls Mg Road ⟟ 8250192130 ⟟ Call Me For Genuine Sex...
Top Rated Bangalore Call Girls Mg Road ⟟ 8250192130 ⟟ Call Me For Genuine Sex...narwatsonia7
 
Call Girls Jabalpur Just Call 9907093804 Top Class Call Girl Service Available
Call Girls Jabalpur Just Call 9907093804 Top Class Call Girl Service AvailableCall Girls Jabalpur Just Call 9907093804 Top Class Call Girl Service Available
Call Girls Jabalpur Just Call 9907093804 Top Class Call Girl Service AvailableDipal Arora
 
Best Rate (Hyderabad) Call Girls Jahanuma ⟟ 8250192130 ⟟ High Class Call Girl...
Best Rate (Hyderabad) Call Girls Jahanuma ⟟ 8250192130 ⟟ High Class Call Girl...Best Rate (Hyderabad) Call Girls Jahanuma ⟟ 8250192130 ⟟ High Class Call Girl...
Best Rate (Hyderabad) Call Girls Jahanuma ⟟ 8250192130 ⟟ High Class Call Girl...astropune
 
(👑VVIP ISHAAN ) Russian Call Girls Service Navi Mumbai🖕9920874524🖕Independent...
(👑VVIP ISHAAN ) Russian Call Girls Service Navi Mumbai🖕9920874524🖕Independent...(👑VVIP ISHAAN ) Russian Call Girls Service Navi Mumbai🖕9920874524🖕Independent...
(👑VVIP ISHAAN ) Russian Call Girls Service Navi Mumbai🖕9920874524🖕Independent...Taniya Sharma
 
All Time Service Available Call Girls Marine Drive 📳 9820252231 For 18+ VIP C...
All Time Service Available Call Girls Marine Drive 📳 9820252231 For 18+ VIP C...All Time Service Available Call Girls Marine Drive 📳 9820252231 For 18+ VIP C...
All Time Service Available Call Girls Marine Drive 📳 9820252231 For 18+ VIP C...Arohi Goyal
 
Russian Call Girls in Jaipur Riya WhatsApp ❤8445551418 VIP Call Girls Jaipur
Russian Call Girls in Jaipur Riya WhatsApp ❤8445551418 VIP Call Girls JaipurRussian Call Girls in Jaipur Riya WhatsApp ❤8445551418 VIP Call Girls Jaipur
Russian Call Girls in Jaipur Riya WhatsApp ❤8445551418 VIP Call Girls Jaipurparulsinha
 
Bangalore Call Girl Whatsapp Number 100% Complete Your Sexual Needs
Bangalore Call Girl Whatsapp Number 100% Complete Your Sexual NeedsBangalore Call Girl Whatsapp Number 100% Complete Your Sexual Needs
Bangalore Call Girl Whatsapp Number 100% Complete Your Sexual NeedsGfnyt
 
Call Girls Kochi Just Call 9907093804 Top Class Call Girl Service Available
Call Girls Kochi Just Call 9907093804 Top Class Call Girl Service AvailableCall Girls Kochi Just Call 9907093804 Top Class Call Girl Service Available
Call Girls Kochi Just Call 9907093804 Top Class Call Girl Service AvailableDipal Arora
 
Call Girls Dehradun Just Call 9907093804 Top Class Call Girl Service Available
Call Girls Dehradun Just Call 9907093804 Top Class Call Girl Service AvailableCall Girls Dehradun Just Call 9907093804 Top Class Call Girl Service Available
Call Girls Dehradun Just Call 9907093804 Top Class Call Girl Service AvailableDipal Arora
 
VIP Russian Call Girls in Varanasi Samaira 8250192130 Independent Escort Serv...
VIP Russian Call Girls in Varanasi Samaira 8250192130 Independent Escort Serv...VIP Russian Call Girls in Varanasi Samaira 8250192130 Independent Escort Serv...
VIP Russian Call Girls in Varanasi Samaira 8250192130 Independent Escort Serv...Neha Kaur
 
High Profile Call Girls Coimbatore Saanvi☎️ 8250192130 Independent Escort Se...
High Profile Call Girls Coimbatore Saanvi☎️  8250192130 Independent Escort Se...High Profile Call Girls Coimbatore Saanvi☎️  8250192130 Independent Escort Se...
High Profile Call Girls Coimbatore Saanvi☎️ 8250192130 Independent Escort Se...narwatsonia7
 
Low Rate Call Girls Kochi Anika 8250192130 Independent Escort Service Kochi
Low Rate Call Girls Kochi Anika 8250192130 Independent Escort Service KochiLow Rate Call Girls Kochi Anika 8250192130 Independent Escort Service Kochi
Low Rate Call Girls Kochi Anika 8250192130 Independent Escort Service KochiSuhani Kapoor
 
Best Rate (Guwahati ) Call Girls Guwahati ⟟ 8617370543 ⟟ High Class Call Girl...
Best Rate (Guwahati ) Call Girls Guwahati ⟟ 8617370543 ⟟ High Class Call Girl...Best Rate (Guwahati ) Call Girls Guwahati ⟟ 8617370543 ⟟ High Class Call Girl...
Best Rate (Guwahati ) Call Girls Guwahati ⟟ 8617370543 ⟟ High Class Call Girl...Dipal Arora
 
Call Girls Service Jaipur Grishma WhatsApp ❤8445551418 VIP Call Girls Jaipur
Call Girls Service Jaipur Grishma WhatsApp ❤8445551418 VIP Call Girls JaipurCall Girls Service Jaipur Grishma WhatsApp ❤8445551418 VIP Call Girls Jaipur
Call Girls Service Jaipur Grishma WhatsApp ❤8445551418 VIP Call Girls Jaipurparulsinha
 
Lucknow Call girls - 8800925952 - 24x7 service with hotel room
Lucknow Call girls - 8800925952 - 24x7 service with hotel roomLucknow Call girls - 8800925952 - 24x7 service with hotel room
Lucknow Call girls - 8800925952 - 24x7 service with hotel roomdiscovermytutordmt
 
Call Girls Cuttack Just Call 9907093804 Top Class Call Girl Service Available
Call Girls Cuttack Just Call 9907093804 Top Class Call Girl Service AvailableCall Girls Cuttack Just Call 9907093804 Top Class Call Girl Service Available
Call Girls Cuttack Just Call 9907093804 Top Class Call Girl Service AvailableDipal Arora
 

Último (20)

VIP Mumbai Call Girls Hiranandani Gardens Just Call 9920874524 with A/C Room ...
VIP Mumbai Call Girls Hiranandani Gardens Just Call 9920874524 with A/C Room ...VIP Mumbai Call Girls Hiranandani Gardens Just Call 9920874524 with A/C Room ...
VIP Mumbai Call Girls Hiranandani Gardens Just Call 9920874524 with A/C Room ...
 
Call Girls Varanasi Just Call 9907093804 Top Class Call Girl Service Available
Call Girls Varanasi Just Call 9907093804 Top Class Call Girl Service AvailableCall Girls Varanasi Just Call 9907093804 Top Class Call Girl Service Available
Call Girls Varanasi Just Call 9907093804 Top Class Call Girl Service Available
 
Top Rated Bangalore Call Girls Richmond Circle ⟟ 8250192130 ⟟ Call Me For Gen...
Top Rated Bangalore Call Girls Richmond Circle ⟟ 8250192130 ⟟ Call Me For Gen...Top Rated Bangalore Call Girls Richmond Circle ⟟ 8250192130 ⟟ Call Me For Gen...
Top Rated Bangalore Call Girls Richmond Circle ⟟ 8250192130 ⟟ Call Me For Gen...
 
The Most Attractive Hyderabad Call Girls Kothapet 𖠋 6297143586 𖠋 Will You Mis...
The Most Attractive Hyderabad Call Girls Kothapet 𖠋 6297143586 𖠋 Will You Mis...The Most Attractive Hyderabad Call Girls Kothapet 𖠋 6297143586 𖠋 Will You Mis...
The Most Attractive Hyderabad Call Girls Kothapet 𖠋 6297143586 𖠋 Will You Mis...
 
Top Rated Bangalore Call Girls Mg Road ⟟ 8250192130 ⟟ Call Me For Genuine Sex...
Top Rated Bangalore Call Girls Mg Road ⟟ 8250192130 ⟟ Call Me For Genuine Sex...Top Rated Bangalore Call Girls Mg Road ⟟ 8250192130 ⟟ Call Me For Genuine Sex...
Top Rated Bangalore Call Girls Mg Road ⟟ 8250192130 ⟟ Call Me For Genuine Sex...
 
Call Girls Jabalpur Just Call 9907093804 Top Class Call Girl Service Available
Call Girls Jabalpur Just Call 9907093804 Top Class Call Girl Service AvailableCall Girls Jabalpur Just Call 9907093804 Top Class Call Girl Service Available
Call Girls Jabalpur Just Call 9907093804 Top Class Call Girl Service Available
 
Best Rate (Hyderabad) Call Girls Jahanuma ⟟ 8250192130 ⟟ High Class Call Girl...
Best Rate (Hyderabad) Call Girls Jahanuma ⟟ 8250192130 ⟟ High Class Call Girl...Best Rate (Hyderabad) Call Girls Jahanuma ⟟ 8250192130 ⟟ High Class Call Girl...
Best Rate (Hyderabad) Call Girls Jahanuma ⟟ 8250192130 ⟟ High Class Call Girl...
 
(👑VVIP ISHAAN ) Russian Call Girls Service Navi Mumbai🖕9920874524🖕Independent...
(👑VVIP ISHAAN ) Russian Call Girls Service Navi Mumbai🖕9920874524🖕Independent...(👑VVIP ISHAAN ) Russian Call Girls Service Navi Mumbai🖕9920874524🖕Independent...
(👑VVIP ISHAAN ) Russian Call Girls Service Navi Mumbai🖕9920874524🖕Independent...
 
All Time Service Available Call Girls Marine Drive 📳 9820252231 For 18+ VIP C...
All Time Service Available Call Girls Marine Drive 📳 9820252231 For 18+ VIP C...All Time Service Available Call Girls Marine Drive 📳 9820252231 For 18+ VIP C...
All Time Service Available Call Girls Marine Drive 📳 9820252231 For 18+ VIP C...
 
Russian Call Girls in Jaipur Riya WhatsApp ❤8445551418 VIP Call Girls Jaipur
Russian Call Girls in Jaipur Riya WhatsApp ❤8445551418 VIP Call Girls JaipurRussian Call Girls in Jaipur Riya WhatsApp ❤8445551418 VIP Call Girls Jaipur
Russian Call Girls in Jaipur Riya WhatsApp ❤8445551418 VIP Call Girls Jaipur
 
Bangalore Call Girl Whatsapp Number 100% Complete Your Sexual Needs
Bangalore Call Girl Whatsapp Number 100% Complete Your Sexual NeedsBangalore Call Girl Whatsapp Number 100% Complete Your Sexual Needs
Bangalore Call Girl Whatsapp Number 100% Complete Your Sexual Needs
 
Call Girls Kochi Just Call 9907093804 Top Class Call Girl Service Available
Call Girls Kochi Just Call 9907093804 Top Class Call Girl Service AvailableCall Girls Kochi Just Call 9907093804 Top Class Call Girl Service Available
Call Girls Kochi Just Call 9907093804 Top Class Call Girl Service Available
 
Call Girls Dehradun Just Call 9907093804 Top Class Call Girl Service Available
Call Girls Dehradun Just Call 9907093804 Top Class Call Girl Service AvailableCall Girls Dehradun Just Call 9907093804 Top Class Call Girl Service Available
Call Girls Dehradun Just Call 9907093804 Top Class Call Girl Service Available
 
VIP Russian Call Girls in Varanasi Samaira 8250192130 Independent Escort Serv...
VIP Russian Call Girls in Varanasi Samaira 8250192130 Independent Escort Serv...VIP Russian Call Girls in Varanasi Samaira 8250192130 Independent Escort Serv...
VIP Russian Call Girls in Varanasi Samaira 8250192130 Independent Escort Serv...
 
High Profile Call Girls Coimbatore Saanvi☎️ 8250192130 Independent Escort Se...
High Profile Call Girls Coimbatore Saanvi☎️  8250192130 Independent Escort Se...High Profile Call Girls Coimbatore Saanvi☎️  8250192130 Independent Escort Se...
High Profile Call Girls Coimbatore Saanvi☎️ 8250192130 Independent Escort Se...
 
Low Rate Call Girls Kochi Anika 8250192130 Independent Escort Service Kochi
Low Rate Call Girls Kochi Anika 8250192130 Independent Escort Service KochiLow Rate Call Girls Kochi Anika 8250192130 Independent Escort Service Kochi
Low Rate Call Girls Kochi Anika 8250192130 Independent Escort Service Kochi
 
Best Rate (Guwahati ) Call Girls Guwahati ⟟ 8617370543 ⟟ High Class Call Girl...
Best Rate (Guwahati ) Call Girls Guwahati ⟟ 8617370543 ⟟ High Class Call Girl...Best Rate (Guwahati ) Call Girls Guwahati ⟟ 8617370543 ⟟ High Class Call Girl...
Best Rate (Guwahati ) Call Girls Guwahati ⟟ 8617370543 ⟟ High Class Call Girl...
 
Call Girls Service Jaipur Grishma WhatsApp ❤8445551418 VIP Call Girls Jaipur
Call Girls Service Jaipur Grishma WhatsApp ❤8445551418 VIP Call Girls JaipurCall Girls Service Jaipur Grishma WhatsApp ❤8445551418 VIP Call Girls Jaipur
Call Girls Service Jaipur Grishma WhatsApp ❤8445551418 VIP Call Girls Jaipur
 
Lucknow Call girls - 8800925952 - 24x7 service with hotel room
Lucknow Call girls - 8800925952 - 24x7 service with hotel roomLucknow Call girls - 8800925952 - 24x7 service with hotel room
Lucknow Call girls - 8800925952 - 24x7 service with hotel room
 
Call Girls Cuttack Just Call 9907093804 Top Class Call Girl Service Available
Call Girls Cuttack Just Call 9907093804 Top Class Call Girl Service AvailableCall Girls Cuttack Just Call 9907093804 Top Class Call Girl Service Available
Call Girls Cuttack Just Call 9907093804 Top Class Call Girl Service Available
 

Tsh scorecard corporate - 2010 11 q4 c

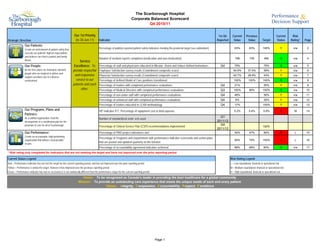
  • 1. The Scarborough Hospital Corporate Balanced Scorecard Q4 2010/11 Our 1st Priority 1st Qtr Current Previous Current Risk Strategic Direction (to 30-Jun-11) Indicator Reported Value Value Target Status Rating* Page Our Patients: Create an environment of patient safety that Percentage of publicly reported patient safety indicators meeting the provincial target (see addendum) 63% 63% 100% Y n/a 2 exceeds our patients' highest expectations and delivers care that is patient and family Number of incident reports completed (medication and non-medication) 768 730 490 G n/a 4 driven. Service Our People: Excellence: To Percentage of staff and physicians educated in Mission, Vision and Values defined behaviours Q4 79% 75% G n/a 5 Be the first choice for motivated, talented provide respectful Employee Satisfaction survey results (Commitment composite score) 50.9% 37.5% 59% Y n/a 6 people who are inspired to deliver and and responsive Physician Satisfaction survey results (Commitment composite score) 42.7% 28.8% 43% Y n/a 7 support excellent care in a diverse environment. service to our Percentage of defined Model of Care positions transitioned 100% 100% 100% G n/a 8 patients and each Percentage of leaders with completed performance evaluations Q4 21% 50% Y n/a 9 other. Percentage of Medical Directors with completed performance evaluations Q3 100% 80% 100% G n/a 10 Percentage of non-union staff with completed performance evaluations Q4 46% 50% Y n/a 11 Percentage of unionized staff with completed performance evaluations Q4 6% 30% Y n/a 12 Percentage of leaders educated in LEAN methodology Q4 17% 100% Y n/a 13 Our Programs, Plans and HIT indicator #17, Percentage of equipment cost to total expense 5.2% 5.4% 5.9% R M 14 Partners: As a unified organization, lead the Q1 Number of standardized order sets used development of a coordinated plan for the 2011/12 provision of care for all of Scarborough. Percentage of Clinical Service Plan (CSP) recommendations implemented Q4 100% 2011/12 Our Performance: Percentage of PMO project milestones met 40% 47% 80% R L 15 Create an accountable, high performing Percentage of Programs and Departments with performance indicator scorecards and action plans organization that delivers measureable 65% 75% 100% R L 16 results. that are posted and updated quarterly on the Intranet Percentage of accountability agreement indicators achieved 88% 88% 80% G n/a 17 * Risk rating only completed for indicators that are not meeting the target and have not improved over the prior reporting period Current Status Legend: Risk Rating Legend Red = Performance indicator has not met the target for the current reporting period, and has not improved over the prior reporting period L = Low reputational, financial or operational risk Yellow = Performance is below the target, however it has improved over the previous reporting period M = Medium reputational, financial or operational risk Green = Performance indicator has met or exceeded or is not statistically different than the performance target for the current reporting period H = High reputational, financial or operational risk Vision: To be recognized as Canada’s leader in providing the best healthcare for a global community. Mission: To provide an outstanding care experience that meets the unique needs of each and every patient. Values: I ntegrity, C ompassion, A ccountability, R espect, E xcellence Page 1
  • 2. The Scarborough Hospital Corporate Balanced Scorecard Quality Improvement Plan (QIP), Hospital Services Accountability Agreement (HSAA) and Publicly Reported Patient Safety Indicators (PRPSI) 1st Qtr 2011/12 QIP TSH Strategic Direction Indicator Indicator Origin QIP Dimension QIP Priority Rating Reported Current Value Previous Value 2010/11 Target Current Status Risk Rating* Target Page 1. Rate of Hospital Acquired C. difficile Associated Diarrhea (CDI) QIP / PRPSI Safety 2 0.50 0.47 0.33 R 0.28 A1 2. Rate of Central Line Infection (CLI) QIP / PRPSI Safety 1 1.48 0.00 0.79 R L 1.93 A2 3. Rate of Ventilator Associated Pneumonia (VAP) QIP / PRPSI Safety 2 0.00 0.61 1.33 G n/a 1.46 A3 Our Patients 4. Rate of hand hygiene compliance before initial patient/patient environment contact QIP Safety 2 83% 93% 90% R L 90% A4 5. Rate of hand hygiene compliance after patient/patient environment contact 90% 100% 90% G n/a A4 6. Rate of Hospital Acquired Methicillin Resistant Staphylococcus Aureus (MRSA) Bacteraemia PRPSI 0.00 0.00 0.02 G n/a A5 7. Rate of Hospital Acquired Vancomycin Resistant Enterococcus (VRE) Bacteraemia PRPSI 0.00 0.00 0.00 G n/a A6 8. Rate of Timely Administration of Prophylactic Antibiotics - Primary Hip PRPSI 100.0% 97.1% 96.1% G n/a A7 9. Rate of Timely Administration of Prophylactic Antibiotics - Primary Knee PRPSI 96.6% 97.7% 96.1% G n/a A8 10. WHO surgical checklist compliance 100% 100% 98% G n/a A9 11. Hospital Standardized Mortality Ratio (HSMR) QIP Effectiveness 2 74 84 100 G n/a 100 A10 12. 30 day readmission rate to any facility - All tracked CMGs QIP Effectiveness 2 14.5% 14.5% 14.5% G n/a 14.5% A11 13. Percentage of ALC days QIP / HSAA Effectiveness 1 15.9% 12.2% 12.2% R H 12.2% A12 14. Emergency Department Wait Time for High Acuity Visits - General Campus PRPSI 17:02 15:12 8:00 R H A14 15. Emergency Department Wait Time for High Acuity Visits - Birchmount Campus PRPSI 20:24 12:12 8:00 R H A15 16. Emergency Department Wait Time for Low Acuity Visits - General Campus PRPSI 5:16 4:48 4:00 R H A16 17. Emergency Department Wait Time for Low Acuity Visits - Birchmount Campus PRPSI 4:55 4:30 4:00 R H A17 18. Admitted patient treated within the LOS target of less than 8 hours - General Campus P4R 30% 32% 31% R H A18 19. Admitted patient treated within the LOS target of less than 8 hours - Birchmount Campus P4R 27% 34% 36% R H A19 20. Non-admitted high acuity patients treated within their respective targets of <=8 hours - General Campus P4R 91% 90% 87% G n/a A20 21. Non-admitted high acuity patients treated within their respective targets of <=8 hours - Birchmount Campus P4R 89% 91% 90% R H A21 22. Non-admitted low acuity patients treated within their respective targets of <=4 hours - General Campus P4R 85% 81% 81% G n/a A22 23. Non-admitted low acuity patients treated within their respective targets of <=4 hours - Birchmount Campus P4R 81% 83% 77% G n/a A23 24. 90th percentile physician initial assessment time - General Campus PRPSI 4:21 4:35 4:06 Y n/a A24 25. 90th percentile physician initial assessment time - Birchmount Campus PRPSI 3:40 3:06 3:48 G n/a A25 26. 90th Percentile ER Lengh of Stay for Admitted Patients QIP / HSAA Access 1 44:14 36:43 25:00 R H 25:00 A26 27. 90th Percentile ER Length of Stay for Complex Condition Patients QIP / HSAA Access 1 8:01 8:19 8:00 Y n/a 8:00 A27 28. Wait Time - General Surgery HSAA / PRPSI 76 67 182 G n/a A28 29. Wait Time - Cancer Surgery HSAA / PRPSI 53 54 84 G n/a A29 30. Wait Time - Cataract Surgery HSAA / PRPSI 120 225 182 G n/a A30 31. Wait Time - Total Hip Replacement HSAA / PRPSI 131 151 182 G n/a A31 32. Wait time - Total Knee Replacement HSAA / PRPSI 108 153 182 G n/a A32 33. Wait Time - CT HSAA / PRPSI 19 23 28 G n/a A33 34. Wait Time - MRI HSAA / PRPSI 97 116 28 Y n/a A34 35. Patient satisfaction - Overall Impression: Emergency Department QIP Patient-Centred 1 54.5 46.7 50 G n/a 50 A35 36. Patient satisfaction - Overall Impression: In-patients QIP Patient-Centred 1 59.2 66.3 70 R H 70 A36 37. Repeat Unplanned Emergency Visited within 30 Days for Mental Health Conditions HSAA Q1 2011/12 38. Repeat Unplanned Emergency Visited within 30 Days for Substance Abuse Conditions HSAA Q1 2011/12
  • 3. 39. Total margin QIP / HSAA Effectiveness 1 0.04% -0.31% 0% G n/a 0% A38 40. Current Ratio HSAA 0.34 0.39 0.39 R M A39 41. Total weighted cases (Inpatient and Day Surgery) HSAA 42,144 43,027 40,712 G n/a A40 Our Performance 42. Mental Health Patient Days HSAA 15,970 15,425 15,000 G n/a A41 43. Rehab Patient Days HSAA 2,397 3,221 3,530 R M A42 44. Emergency Visits HSAA 103,351 99,915 98,000 G n/a A43 45. Ambulatory Visits (excluding ER) HSAA 306,954 303,662 294,773 G n/a A44 46. Total Hip and Knee Replacement HSAA 1,257 1,275 1,225 G n/a A45 47. Cataract Surgeries HSAA 5,756 5,894 5,815 R M A46 48. Computed Tomography (CT) HSAA 8,037 8,352 7,245 G n/a A47 49. Magnetic Resonance Imaging (MRI) HSAA 6,225 6,123 5,657 G n/a A48 * Risk rating only completed for indicators that are not meeting the target and have not improved over the prior reporting period Current Status Legend: Priority Legend Red = Performance indicator has not met the target for the current reporting period, and has not improved over the prior reporting period Priority 1 - Highest priority Yellow = Performance is below the target, however it has improved over the previous reporting period • Current performance below “benchmark” (if one exists) or below long term goal; significant improvements requ Green = Performance indicator has met or exceeded or is not statistically different than the performance target for the current reporting period • Aligned with organizational priorities/strategic plan, defined accreditation priority or recommendation, funding tied to initiative, aligned with government agenda Risk Rating Legend Priority 2 - Moderate priority: L = Low reputational, financial or operational risk • Current performance just below “benchmark” (if one exists) or below long term goal; room for improvement M = Medium reputational, financial or operational risk • Aligned with organizational priorities/strategic plan, defined accreditation priority or recommendation, funding H = High reputational, financial or operational risk tied to initiative, aligned with government agenda Priority 3 - Lower priority: • Current performance at/above” benchmark”, provincial rate or long term goal • Organizational priority Vision: To be recognized as Canada’s leader in providing the best healthcare for a global community. Mission: To provide an outstanding care experience that meets the unique needs of each and every patient. Values: I ntegrity, C ompassion, A ccountability, R espect, E xcellence
  • 4. The Scarborough Hospital Corporate Balanced Scorecard Quality Improvement Plan (QIP), Hospital Services Accountability Agreement (HSAA) and Publicly Reported Patient Safety Indicators (PRPSI) Indicator QIP - Rate of Hospital Acquired C. difficile Associated Diarrhea Strategic Direction Our Patients Time Frame June 2011 Source Surveillance and Case Finding Performance Measurement Summary Definition 1.20 1.09, n=9 Overall Rate of hospital acquired C. difficile associated diarrhea. Rate is based on total number of inpatients/patients with confirmed infection per 1000 patient-days. 0.85, n=5 1.00 0.78, n=11 Significance To track hospital acquired C. difficile rates in order to identify and implement infection control measures to prevent nosocomial spread of C.difficile. While C. 0.80 0.58, n=5 0.58, n=5 difficile does not usually present a big problem for reasonably healthy adults, it can 0.53, n=5 0.51, n=3 0.50, n=7 0.49, n=3 0.49, n=3 be quite serious for those who are frail or have other health challenges. 0.48, n=4 0.47, n=7 0.47, n=7 0.47, n=7 0.47, n=3 0.46, n=4 0.45, n=4 0.45, n=4 0.43, n=6 C. difficile is communicable. It can live in the environment and on other surfaces. 0.60 0.38, n=6 0.37, n=3 0.36, n=3 Rigorous cleaning regimes, patient isolation and hand washing are some of the 0.35, n=5 0.34, n=2 0.34, n=5 0.34, n=2 0.33, n=2 0.32, n=5 strategies used to combat C. difficile. 0.26, n=4 0.26, n=2 0.25, n=2 0.25, n=2 0.24, n=2 0.23, n=2 0.22, n=3 0.22, n=3 0.22, n=3 0.40 CHART PLACEHOLDER 0.20, n=3 Target 0.17, n=1 0.16, n=1 0.15, n=1 0.15, n=1 0.15, n=2 Ontario Average - 0.33, lower value is desired. 0.13, n=1 0.13, n=1 0.07, n=1 Risk Rating 0.20 0.00, n=0 0.00, n=0 0.00, n=0 0.00, n=0 0.00, n=0 n/a Analysis - QIP use rate for January to December 2010. There have been a few months of Jul 10 Mar 10 Nov 10 Dec 10 Jan 11 Mar 11 Oct 10 Feb 10 Apr 10 May 10 Aug 10 Sep 10 Feb 11 Apr 11 May 11 Jun 10 Jun 11 increased cases of C. difficile at the General Campus since February 2010. Rates have begun to decline with increased monitoring and vigilance of infection control practices in the inpatient areas. The Birchmount Campus remains below the General Campus Birchmount Campus Ontario Average. TSH Ontario Average per 1,000 patient-days TSH Rolling 12-month Average QIP Reported Value=0.26 Action Plan SMART Initiative (Specific, Measureable, Attainable, Realistic, Time-Bound) Lead Date Initiated Current Status Indicator meeting or exceeding target, no action plan required n/a n/a n/a Page A1
  • 5. The Scarborough Hospital Corporate Balanced Scorecard Quality Improvement Plan (QIP), Hospital Services Accountability Agreement (HSAA) and Publicly Reported Patient Safety Indicators (PRPSI) Indicator QIP - Rate of Central Line Infection (CLI) Strategic Direction Our Patients Time Frame Q1 2011/12 Source Surveillance and Case Finding Performance Measurement Summary Definition Overall rate of hospital acquired Central Line Infection. Rate is based on total 8.00 6.32, n=6 number of CLI incidents diagnosed after two days of Critical Care admission per 1000 patient days. 7.00 4.98, n=5 Significance 6.00 4.58, n=6 To track hospital acquired CLI rates in order to identify and implement necessary 3.90, n=6 prevention plans to reduce the risk of infection from spreading. 5.00 4.00 2.54, n=1 2.36, n=1 2.31, n=3 Target 2.21, n=2 2.06, n=3 Ontario Average - 0.79, lower value is desired. 1.87, n=1 3.00 CHART PLACEHOLDER 1.48, n=3 Risk Rating 0.78, n=1 2.00 0.69, n=1 0.62, n=1 Low - Controlling the rate of infection is very important to TSH. The increase in the rate of infection may cause some financial and reputational risk to the organization. 0.00, n=0 0.00, n=0 0.00, n=0 0.00, n=0 0.00, n=0 0.00, n=0 0.00, n=0 0.00, n=0 0.00, n=0 0.00, n=0 1.00 Analysis QIP use rate for January to December 2010. There has been a marked improvement to the number of CLI cases in 2010/11 at the General Campus. CLI 0.00 strategies to standardize processes across the campuses is showing improvements Q2 2009/10 Q3 2009/10 Q4 2009/10 Q1 2010/11 Q2 2010/11 Q3 2010/11 Q4 2010/11 Q1 2011/12 in the rates. There is lower rate of infection associated with PICC, therefore the use of PICC has been increased. General Campus Birchmount Campus TSH Ontario Average per 1,000 patient-days TSH Rolling 12-month Average QIP Reported Value=1.76 Action Plan SMART Initiative (Specific, Measureable, Attainable, Realistic, Time-Bound) Lead Date Initiated Current Status Monthly monitoring of insertions and maintenance Bundle which includes hand H. Clasky, D. Rose, P. Apr-10 Monthly audits hygiene, maximal barrier precautions, and chlorhexidine skin antisepsis and optimal Tamlin, R. Lovinsky, C. catheter side selection to adhere the compliance of 90% to decrease rate of CLI for Shelton the next quarter Expanded data collection to include the program that the hemodialysis patients are H. Clasky, R. Lovinsky, Mar-11 Data collection in progress coming from, type of line being used, and CLI reduction interventions such as the IPAC use of chlorhexidine dressing and bath to investigate higher rate of CLI in the hemodialysis population by Q2 of 2011/12 Page A2
  • 7. The Scarborough Hospital Corporate Balanced Scorecard Quality Improvement Plan (QIP), Hospital Services Accountability Agreement (HSAA) and Publicly Reported Patient Safety Indicators (PRPSI) Indicator QIP - Rate of Ventilator Associated Pneumonia (VAP) Strategic Direction Our Patients Time Frame Q1 2011/12 Source Surveillance and Case Finding Performance Measurement Summary Definition Overall Rate of hospital acquired Ventilator Associated Pneumonia. Rate is based 7.0 on total number of VAP incidents diagnosed after two days of Critical Care admission per 1000 patient days. 6.0 0.00, n=0 Significance 5.0 To track hospital acquired VAP rates in order to identify and implement necessary prevention plans to reduce the risk of development of pneumonia in the ICU patient population. 4.0 2.47, n=2 Target 3.0 1.63, n=2 Ontario Average - 1.33, lower value is desired. 1.58, n=2 1.40, n=1 1.36, n=2 CHART PLACEHOLDER 1.14, n=1 0.97, n=1 0.90, n=1 2.0 0.76, n=1 Risk Rating n/a 0.00, n=0 0.00, n=0 0.00, n=0 0.00, n=0 0.00, n=0 0.00, n=0 0.00, n=0 0.00, n=0 4.56, n=2 0.00, n=0 0.00, n=0 0.00, n=0 0.00, n=0 2.26, n=1 1.0 Analysis QIP use rate for January to December 2010. There were zero VAP case 0.0 identified in the Q4. Currently meeting target. Q2 2009/10 Q3 2009/10 Q4 2009/10 Q1 2010/11 Q2 2010/11 Q3 2010/11 Q4 2010/11 General Campus Birchmount Campus TSH Ontario Average per 1,000 patient-days TSH Rolling 12-month Average QIP Reported Value=1.22 Action Plan SMART Initiative (Specific, Measureable, Attainable, Realistic, Time-Bound) Lead Date Initiated Current Status Indicator meeting or exceeding target, no action plan required n/a n/a n/a Page A3
  • 8. The Scarborough Hospital Corporate Balanced Scorecard Quality Improvement Plan (QIP), Hospital Services Accountability Agreement (HSAA) and Publicly Reported Patient Safety Indicators (PRPSI) Indicator QIP - Rate of hand hygiene compliance Strategic Direction Our Patients Time Frame Q1 2011/12 Source Surveillance and Case Finding Performance Measurement Summary Definition The single most common way of transferring health care-associated infections (HAIs) 140% in health care settings is on the hands of health care providers. Health care providers 100%, n=56 100%, n=56 100%, n=7 96%, n=392 96%, n=392 move from patient to patient and room to room while providing care and working in the 92%, n=1180 92%, n=1187 97%, n=58 96%, n=25 96%, n=25 96%, n=25 96%, n=25 120% 95%, n=57 93%, n=52 93%, n=52 93%, n=62 90%, n=301 90%, n=361 89%, n=412 patient environment. This movement provides many opportunities for the transmission 85%, n=1070 85%, n=1063 88%, n=354 87%, n=360 87%, n=360 90%, n=60 85%, n=391 84%, n=334 83%, n=330 88%, n=7 of organisms on hands that can cause infections. 81%, n=268 100% Significance Proper hand hygiene protects patients and providers and will reduce the spread of 80% infections and the associated treatment costs, reduce hospital lengths of stay and readmissions, reduce wait times, and prevent deaths. 60% Target. CHART PLACEHOLDER Ontario Target - 90% Before and 90% After, higher value is desired. 40% Risk Rating 20% 0%, n=0 0%, n=0 0%, n=0 0%, n=0 0%, n=0 0%, n=0 Low- Reputational, financial or operational risk. Analysis 0% QIP use rate for 2009/10, only for before patient contact. Due to the lack of hand Before After Before After Before After Before After Before After Before After hygiene auditors and the VRE issue, there were not enough audits done to report for Q3 at the General Campus. In Q4 IPAC trained unit based auditors to carryout the Q3 2009/10 Q4 2009/10 Q1 2010/11 Q2 2010/11 Q3 2010/11 Q4 2010/11 audits to meet mandatory reporting requirements. The results of the before compliance are below TSH target; however, well above the Ontario average of 72.17%. General Campus Birchmount Campus TSH Target QIP Reported Value=92.3% Action Plan SMART Initiative (Specific, Measureable, Attainable, Realistic, Time-Bound) Lead Date Initiated Current Status Development of a audit process to monitor unit based hand hygiene audits and IPAC Mar-11 In progress, on a monthly basis program overseen by IPAC and Decision Support. Monthly audit to observe number of times hand hygiene performed before patient contact. Page A4
  • 9. The Scarborough Hospital Corporate Balanced Scorecard Quality Improvement Plan (QIP), Hospital Services Accountability Agreement (HSAA) and Publicly Reported Patient Safety Indicators (PRPSI) Indicator Rate of Hospital Acquired Methicillin Resistant Staphylococcus Aureus (MRSA) Bacteraemia Strategic Direction Our Patients Time Frame Q1 2011/12 Source Surveillance and Case Finding Performance Measurement Summary Definition 0.16 Overall Rate of hospital acquired Methicillin Resistant Staphylococcus Aureus (MRSA) bacteraemia. Rate is based on total number of inpatients/patients with 0.14 confirmed infection per 1000 patient-days. 0.12 Significance Higher MRSA colonization rates will lead to higher rates of blood stream infections 0.10 with MRSA. Tracking hospital acquired MRSA Bacteraemia rates helps to identify 0.06, n=1 the clinical significance of MRSA colonization. This will help identify a need for 0.08 further strategies to prevent nosocomial spread of MRSA. 0.04, n=1 0.04, n=1 0.04, n=1 0.04, n=1 Target 0.06 0.02, n=1 0.02, n=1 0.02, n=1 0.02, n=1 0.02, n=1 Ontario Average - 0.02, lower value is desired. 0.04 CHART PLACEHOLDER Risk Rating 0.00, n=0 0.00, n=0 0.00, n=0 0.00, n=0 0.00, n=0 0.00, n=0 0.00, n=0 0.00, n=0 0.00, n=0 0.00, n=0 0.00, n=0 0.00, n=0 0.00, n=0 0.00, n=0 0.00, n=0 0.00, n=0 0.00, n=0 0.00, n=0 0.00, n=0 0.00, n=0 n/a 0.02 0.00 Analysis Both General Campus and Birchmount Campus remains below the Ontario Average. General Campus Birchmount Campus TSH Ontario Average per 1,000 patient-days TSH Rolling 12-month Average Action Plan SMART Initiative (Specific, Measureable, Attainable, Realistic, Time-Bound) Lead Date Initiated Current Status Indicator meeting or exceeding target, no action plan required n/a n/a n/a Page A5
  • 10. The Scarborough Hospital Corporate Balanced Scorecard Quality Improvement Plan (QIP), Hospital Services Accountability Agreement (HSAA) and Publicly Reported Patient Safety Indicators (PRPSI) Indicator Rate of Hospital Acquired Vancomycin Resistant Enterococcus (VRE) Bacteraemia Strategic Direction Our Patients Time Frame Q1 2011/12 Source Surveillance and Case Finding Performance Measurement Summary Definition Overall Rate of hospital acquired Vancomycin Resistant Enterococcus (VRE) 0.012 bacteraemia. Rate is based on total number of inpatients/patients with confirmed infection per 1000 patient-days. 0.010 Significance To track hospital acquired VRE bacteraemia rates in order to identify and implement 0.008 necessary prevention plans to reduce the risk of infection from spreading. 0.006 Target 0.004 Ontario Average - 0.00, lower value is desired. CHART PLACEHOLDER 0.00, n=0 0.00, n=0 0.00, n=0 0.00, n=0 0.00, n=0 0.00, n=0 0.00, n=0 0.00, n=0 0.00, n=0 0.00, n=0 0.00, n=0 0.00, n=0 0.00, n=0 0.00, n=0 0.00, n=0 0.00, n=0 0.00, n=0 0.00, n=0 0.00, n=0 0.00, n=0 0.00, n=0 0.00, n=0 0.00, n=0 0.00, n=0 0.00, n=0 0.00, n=0 0.00, n=0 0.00, n=0 0.00, n=0 0.00, n=0 Risk Rating 0.002 n/a 0.000 Analysis There have been no reportable cases of VRE bacteraemia despite increased numbers of VRE colonized patients since April 2010. General Campus Birchmount Campus TSH Ontario Average per 1,000 patient-days TSH Rolling 12-month Average Action Plan SMART Initiative (Specific, Measureable, Attainable, Realistic, Time-Bound) Lead Date Initiated Current Status Indicator meeting or exceeding target, no action plan required n/a n/a n/a Page A6