SlideShare a Scribd company logo
1 of 4
Download to read offline
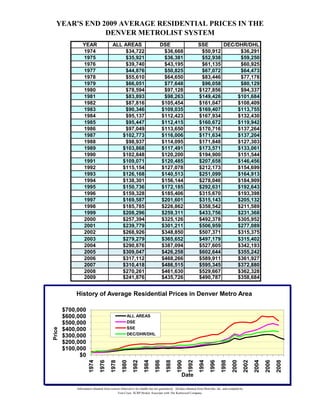
YEAR'S END 2009 AVERAGE RESIDENTIAL PRICES IN THE
               DENVER METROLIST SYSTEM
                 YEAR                    ALL AREAS                            DSE                            SSE      DEC/DHR/DHL
                 1974                        $34,722                           $36,668                        $50,912       $36,291
                 1975                        $35,921                           $36,381                        $52,938       $59,250
                 1976                        $39,740                           $43,195                        $61,135       $60,925
                 1977                        $44,876                           $50,825                        $67,072       $64,473
                 1978                        $55,610                           $64,650                        $83,446       $77,178
                 1979                        $66,051                           $77,648                        $96,058       $80,129
                 1980                        $78,594                           $97,128                       $127,856       $94,337
                 1981                        $83,893                           $98,263                       $149,426      $101,684
                 1982                        $87,816                          $105,454                       $161,047      $108,409
                 1983                        $90,346                          $109,035                       $169,407      $113,755
                 1984                        $95,137                          $112,423                       $167,934      $132,430
                 1985                        $95,447                          $112,415                       $160,672      $119,942
                 1986                        $97,049                          $113,650                       $170,716      $137,264
                 1987                       $102,773                          $116,006                       $171,634      $137,204
                 1988                        $98,937                          $114,095                       $171,848      $127,303
                 1989                       $103,868                          $117,491                       $173,571      $133,061
                 1990                       $102,848                          $120,200                       $194,900      $151,544
                 1991                       $109,071                          $120,485                       $207,658      $146,456
                 1992                       $115,154                          $127,078                       $212,173      $154,699
                 1993                       $126,168                          $140,513                       $251,099      $164,913
                 1994                       $138,301                          $156,144                       $278,046      $184,909
                 1995                       $150,736                          $172,185                       $292,631      $192,643
                 1996                       $159,328                          $185,406                       $315,670      $193,398
                 1997                       $169,587                          $201,601                       $315,143      $205,132
                 1998                       $185,785                          $226,862                       $358,542      $211,589
                 1999                       $208,296                          $259,311                       $433,756      $231,368
                 2000                       $257,394                          $325,126                       $492,378      $305,952
                 2001                       $239,779                          $301,211                       $506,959      $277,089
                 2002                       $268,926
                                            $268 926                          $348,850
                                                                              $348 850                       $507,371
                                                                                                             $507 371      $315,375
                                                                                                                           $315 375
                 2003                       $279,279                          $365,652                       $497,179      $315,402
                 2004                       $290,876                          $387,094                       $527,605      $342,193
                 2005                       $309,047                          $426,258                       $602,644      $355,242
                 2006                       $317,112                          $468,266                       $589,911      $361,927
                 2007                       $310,418                          $486,515                       $595,345      $372,880
                 2008                       $270,261                          $461,630                       $529,667      $362,328
                 2009                       $241,876                          $435,726                       $490,787      $358,684


            History of Average Residential Prices in Denver Metro Area

        $700,000
        $600,000                                    ALL AREAS
        $500,000                                    DSE
                                                    SSE
Price


        $400,000
        $300,000                                    DEC/DHR/DHL

        $200,000
        $100,000
              $0
                      1974
                               1976
                                        1978
                                                1980
                                                         1982
                                                                  1984
                                                                           1986
                                                                                   1988
                                                                                            1990
                                                                                                     1992
                                                                                                              1994
                                                                                                                      1996
                                                                                                                               1998
                                                                                                                                        2000
                                                                                                                                                    2002
                                                                                                                                                           2004
                                                                                                                                                                  2006
                                                                                                                                                                         2008


                                                                                                Date

             Information obtained from sources believed to be reliable but not guaranteed. All data obtained from Metrolist, Inc. and compiled by
                                            Tom Cryer, SCRP Broker Associate with The Kentwood Company.
Total # of Listings and Sales at Year's End 2009 Denver MLS System
         YEAR                LISTINGS           SALES               RATIO
                             Total Count      Total Count
        12/31/75                   35,728            19,156            1.87         Potential negative market signal (Above 2.50)
        12/31/76                   40,223            24,354            1.65         Potential positive market signal (Below 2.00)
        12/31/77                   41,598            29,875            1.39         Potential neutral market signal (Between 2.00 & 2.50)
        12/31/78                   49,675            31,213            1.59         Too soon to tell // Year to date // Inconclusive
        12/31/79                   59,384            31,024            1.91         Indicates all time high or low
        12/31/80                   55,438            23,952            2.31
        12/31/81                   49,755            22,125            2.25
        12/31/82                   52,817            18,756            2.82
        12/31/83                   63,585            23,566            2.70
        12/31/84                   69,041            23,264            2.97
        12/31/85                   73,279            24,489            2.99
        12/31/86                   75,694            25,865            2.93
        12/31/87                   69,740            23,414            2.98
        12/31/88                   62,521            24,120            2.59
        12/31/89                   50,112            25,142            1.99
        12/31/90                   53,682            26,436            2.03
        12/31/91                   53,286            27,375            1.95
        12/31/92                   48,103            34,828            1.38
        12/31/93                   69,118            40,291            1.72
        12/31/94                   73,637            40,068            1.84
        12/31/95                   78,969            37,767            2.09
        12/31/96                   84,909            39,849            2.13
        12/31/97                   90,813            41,959            2.16
        12/31/98                  103,402            47,836            2.16
        12/31/99                   72,842            48,795            1.49
        12/31/00                  100,672            50,499            1.99
        12/31/01                  133,688            49,372            2.71
        12/27/02                  138,445            49,326            2.81
        12/29/03                  123,596            47,731            2.59
        12/31/04                  127,989            53,710            2.38
        12/31/05                  135,008            54,072            2.50
        12/31/06                  152,807            52,220            2.93
        12/31/07                  143,400            51,304            2.80
        12/31/08                  123,655            48,926            2.53
        12/31/09                  104,330            42,962            2.43

7/1/2008 (EST)               LISTINGS             SALES             RATIO
      Res                         76,534             33,114          2.31
     Cond                         21,990              8,956          2.46
     Land                          3,819                463          8.25
      Inc                          1,987                429          4.63
     Totals                      104,330             42,962          2.43

                                                           Ratio of Listings to Sales
        4.00
        3.00
Ratio


        2.00
        1.00
        0.00
               1975   1977   1979   1981   1983   1985   1987   1989    1991    1993    1995   1997   1999    2001   2003    2005    2007   2009
                                                                       Date


           Information obtained from sources believed to be reliable but not guaranteed. All data obtained from year to date statistics provided by
                             Metrolist, Inc. and compiled by Tom Cryer, SCRP Broker Associate with The Kentwood Company
DENVER METRO SINGLE FAMILY MARKET SHARE BY PRICE RANGE AS OF YEAR END 2009

 LISTING RANGES    ACTIVE LISTINGS    UNDER CONTRACT         SALES     % MKT SHARE

ALL PRICES                   17,098                  4,431    40,391        100.00%
$0‐200K                       4,215                  2,329    17,058         42.23%
$200‐400K                     7,116                  1,531    17,552         43.46%
$400‐750K                     3,636                    485     5,108         12.65%
$750K‐1M                        972                     75       650          1.61%
$1M +                         1,345                     79       480          1.19%
                                                                            101.13%
           SUPPLY IN MONTHS OF SFR INVENTORY
LISTING RANGES     TOTAL # SALES     MONTHS SUPPLY

ALL PRICES                   40,391                   5.08
$0‐200K                      17058                    2.97
$200‐400K                    17552                    4.87
$400‐750K                     5108                    8.54
$750K‐1M                        650                  17.94
$1M +                           480                  33.63
HISTORY OF FORECLOSURE ACTIVITY BY COUNTY IN DENVER METRO YEAR END 2009


  35000
                  Arapahoe County
  30000           Jefferson County

                  Denver County
  25000
                  Douglas County

  20000           Boulder County

                  Adams County
  15000
                  Total Metro Area

  10000


   5000


      0
          Year 1972197419761978198019821984198619881990199219941996199820002002200420062008

More Related Content

What's hot

What's hot (16)

Sexto bimestre2010
Sexto bimestre2010Sexto bimestre2010
Sexto bimestre2010
 
H W 2010 07 De
H W 2010 07 DeH W 2010 07 De
H W 2010 07 De
 
Segundo bimestre2011
Segundo bimestre2011Segundo bimestre2011
Segundo bimestre2011
 
Cuarto bimestre2010
Cuarto bimestre2010Cuarto bimestre2010
Cuarto bimestre2010
 
Austin Real Estate Update January '08
Austin Real Estate Update January '08Austin Real Estate Update January '08
Austin Real Estate Update January '08
 
Lease Operating Report
Lease Operating ReportLease Operating Report
Lease Operating Report
 
Segundo bimestre2010
Segundo bimestre2010Segundo bimestre2010
Segundo bimestre2010
 
Excel chartslesson8andsurvey h.t.
Excel chartslesson8andsurvey h.t.Excel chartslesson8andsurvey h.t.
Excel chartslesson8andsurvey h.t.
 
Coldwell Banker C&C Properties Sales Dec 2010
Coldwell Banker C&C Properties Sales Dec 2010Coldwell Banker C&C Properties Sales Dec 2010
Coldwell Banker C&C Properties Sales Dec 2010
 
Wag Report 2009 11 De
Wag Report 2009 11 DeWag Report 2009 11 De
Wag Report 2009 11 De
 
Denver, Colorado Monthly Mls Stats 2010
Denver, Colorado Monthly Mls Stats 2010Denver, Colorado Monthly Mls Stats 2010
Denver, Colorado Monthly Mls Stats 2010
 
Grand Lake OK 2005 2011 full year real estate market analysis
Grand Lake OK 2005   2011 full year real estate market analysisGrand Lake OK 2005   2011 full year real estate market analysis
Grand Lake OK 2005 2011 full year real estate market analysis
 
Saleskit Standard Morgan
Saleskit Standard MorganSaleskit Standard Morgan
Saleskit Standard Morgan
 
Primer bimestre2010
Primer bimestre2010Primer bimestre2010
Primer bimestre2010
 
Student Loan Calculator
Student Loan CalculatorStudent Loan Calculator
Student Loan Calculator
 
H W 2011 10 De
H W 2011 10 DeH W 2011 10 De
H W 2011 10 De
 

Similar to DENVER MARKET WATCH YEAR END 2009

Similar to DENVER MARKET WATCH YEAR END 2009 (20)

toll brothers Toll_23Year
toll brothers Toll_23Yeartoll brothers Toll_23Year
toll brothers Toll_23Year
 
Toll_23Year
Toll_23YearToll_23Year
Toll_23Year
 
Toll_23Year
Toll_23YearToll_23Year
Toll_23Year
 
tollbrothers Toll_23Year
 tollbrothers   Toll_23Year tollbrothers   Toll_23Year
tollbrothers Toll_23Year
 
Funciones
FuncionesFunciones
Funciones
 
年金終值計算
年金終值計算年金終值計算
年金終值計算
 
Data Warehouse Project-Report Analysis
Data Warehouse Project-Report AnalysisData Warehouse Project-Report Analysis
Data Warehouse Project-Report Analysis
 
summary
summarysummary
summary
 
summary
summarysummary
summary
 
summary
summarysummary
summary
 
toll brothers summary
toll brothers summarytoll brothers summary
toll brothers summary
 
tollbrothers summary
 tollbrothers   summary tollbrothers   summary
tollbrothers summary
 
Quinto bimestre2009
Quinto bimestre2009Quinto bimestre2009
Quinto bimestre2009
 
Segundo bimestre2009
Segundo bimestre2009Segundo bimestre2009
Segundo bimestre2009
 
Cuarto bimestre2009
Cuarto bimestre2009Cuarto bimestre2009
Cuarto bimestre2009
 
Tercer bimestre2009
Tercer bimestre2009Tercer bimestre2009
Tercer bimestre2009
 
Stm eng
Stm engStm eng
Stm eng
 
Primer bimestre2009
Primer bimestre2009Primer bimestre2009
Primer bimestre2009
 
Asta data spots_howmanytravelagents&agenciesarethere_slideshow
Asta data spots_howmanytravelagents&agenciesarethere_slideshowAsta data spots_howmanytravelagents&agenciesarethere_slideshow
Asta data spots_howmanytravelagents&agenciesarethere_slideshow
 
Practicas
PracticasPracticas
Practicas
 

More from Tom Cryer

Residential Price Trends Feeding into Cherry Creek High School 2010
Residential Price Trends Feeding into Cherry Creek High School 2010Residential Price Trends Feeding into Cherry Creek High School 2010
Residential Price Trends Feeding into Cherry Creek High School 2010Tom Cryer
 
MyTownCryer Mid Year 2010 Analysis
MyTownCryer Mid Year 2010 AnalysisMyTownCryer Mid Year 2010 Analysis
MyTownCryer Mid Year 2010 AnalysisTom Cryer
 
MyTownCryer July, 2010
MyTownCryer July, 2010MyTownCryer July, 2010
MyTownCryer July, 2010Tom Cryer
 
MyTownCryer June, 2010
MyTownCryer June, 2010MyTownCryer June, 2010
MyTownCryer June, 2010Tom Cryer
 
A Three Year Sales History for Foxfield, Colorado 80016
A Three Year Sales History for Foxfield, Colorado 80016A Three Year Sales History for Foxfield, Colorado 80016
A Three Year Sales History for Foxfield, Colorado 80016Tom Cryer
 
AVERAGE PRICE AND TRANSACTION COUNT FOR HIGHLANDS RANCH COLORADO 2010
AVERAGE PRICE AND TRANSACTION COUNT FOR HIGHLANDS RANCH COLORADO 2010AVERAGE PRICE AND TRANSACTION COUNT FOR HIGHLANDS RANCH COLORADO 2010
AVERAGE PRICE AND TRANSACTION COUNT FOR HIGHLANDS RANCH COLORADO 2010Tom Cryer
 
The Social Benefits Of Stable Housing
The Social Benefits Of Stable HousingThe Social Benefits Of Stable Housing
The Social Benefits Of Stable HousingTom Cryer
 
Mother\'s Day Denver 2010
Mother\'s Day Denver 2010Mother\'s Day Denver 2010
Mother\'s Day Denver 2010Tom Cryer
 
AVERAGE PRICE HISTORY LAST THREE YEARS IN GREENWOOD VILLAGE, COLORADO
AVERAGE PRICE HISTORY LAST THREE YEARS IN GREENWOOD VILLAGE, COLORADOAVERAGE PRICE HISTORY LAST THREE YEARS IN GREENWOOD VILLAGE, COLORADO
AVERAGE PRICE HISTORY LAST THREE YEARS IN GREENWOOD VILLAGE, COLORADOTom Cryer
 
Weekly Economic Financial Commentary March 26, 2010
Weekly Economic Financial Commentary March 26, 2010Weekly Economic Financial Commentary March 26, 2010
Weekly Economic Financial Commentary March 26, 2010Tom Cryer
 
It Pays to Buy Now!
It Pays to Buy Now!It Pays to Buy Now!
It Pays to Buy Now!Tom Cryer
 
Cherry Hills Village March 2010
Cherry Hills Village March 2010Cherry Hills Village March 2010
Cherry Hills Village March 2010Tom Cryer
 
February Foreclosure List for Denver, Colorado
February Foreclosure List for Denver, ColoradoFebruary Foreclosure List for Denver, Colorado
February Foreclosure List for Denver, ColoradoTom Cryer
 
Wells Fargo 2010 Annual Outlook
Wells Fargo 2010 Annual OutlookWells Fargo 2010 Annual Outlook
Wells Fargo 2010 Annual OutlookTom Cryer
 
A COMPREHENSIVE ANALYSIS OF $1M+ TRANSACTIONS IN THE DENVER METRO AREA AS OF ...
A COMPREHENSIVE ANALYSIS OF $1M+ TRANSACTIONS IN THE DENVER METRO AREA AS OF ...A COMPREHENSIVE ANALYSIS OF $1M+ TRANSACTIONS IN THE DENVER METRO AREA AS OF ...
A COMPREHENSIVE ANALYSIS OF $1M+ TRANSACTIONS IN THE DENVER METRO AREA AS OF ...Tom Cryer
 
University Hills Denver, CO Real Estate Report
University Hills Denver, CO Real Estate ReportUniversity Hills Denver, CO Real Estate Report
University Hills Denver, CO Real Estate ReportTom Cryer
 
2009 Us Corporate Relocation Benchmarking Survey
2009 Us Corporate Relocation Benchmarking Survey2009 Us Corporate Relocation Benchmarking Survey
2009 Us Corporate Relocation Benchmarking SurveyTom Cryer
 
University of Denver Community Residential Real Estate Trends
University of Denver Community Residential Real Estate TrendsUniversity of Denver Community Residential Real Estate Trends
University of Denver Community Residential Real Estate TrendsTom Cryer
 
Mortgage Brokers Association Data
Mortgage Brokers Association DataMortgage Brokers Association Data
Mortgage Brokers Association DataTom Cryer
 
Defeating Procrastination
Defeating ProcrastinationDefeating Procrastination
Defeating ProcrastinationTom Cryer
 

More from Tom Cryer (20)

Residential Price Trends Feeding into Cherry Creek High School 2010
Residential Price Trends Feeding into Cherry Creek High School 2010Residential Price Trends Feeding into Cherry Creek High School 2010
Residential Price Trends Feeding into Cherry Creek High School 2010
 
MyTownCryer Mid Year 2010 Analysis
MyTownCryer Mid Year 2010 AnalysisMyTownCryer Mid Year 2010 Analysis
MyTownCryer Mid Year 2010 Analysis
 
MyTownCryer July, 2010
MyTownCryer July, 2010MyTownCryer July, 2010
MyTownCryer July, 2010
 
MyTownCryer June, 2010
MyTownCryer June, 2010MyTownCryer June, 2010
MyTownCryer June, 2010
 
A Three Year Sales History for Foxfield, Colorado 80016
A Three Year Sales History for Foxfield, Colorado 80016A Three Year Sales History for Foxfield, Colorado 80016
A Three Year Sales History for Foxfield, Colorado 80016
 
AVERAGE PRICE AND TRANSACTION COUNT FOR HIGHLANDS RANCH COLORADO 2010
AVERAGE PRICE AND TRANSACTION COUNT FOR HIGHLANDS RANCH COLORADO 2010AVERAGE PRICE AND TRANSACTION COUNT FOR HIGHLANDS RANCH COLORADO 2010
AVERAGE PRICE AND TRANSACTION COUNT FOR HIGHLANDS RANCH COLORADO 2010
 
The Social Benefits Of Stable Housing
The Social Benefits Of Stable HousingThe Social Benefits Of Stable Housing
The Social Benefits Of Stable Housing
 
Mother\'s Day Denver 2010
Mother\'s Day Denver 2010Mother\'s Day Denver 2010
Mother\'s Day Denver 2010
 
AVERAGE PRICE HISTORY LAST THREE YEARS IN GREENWOOD VILLAGE, COLORADO
AVERAGE PRICE HISTORY LAST THREE YEARS IN GREENWOOD VILLAGE, COLORADOAVERAGE PRICE HISTORY LAST THREE YEARS IN GREENWOOD VILLAGE, COLORADO
AVERAGE PRICE HISTORY LAST THREE YEARS IN GREENWOOD VILLAGE, COLORADO
 
Weekly Economic Financial Commentary March 26, 2010
Weekly Economic Financial Commentary March 26, 2010Weekly Economic Financial Commentary March 26, 2010
Weekly Economic Financial Commentary March 26, 2010
 
It Pays to Buy Now!
It Pays to Buy Now!It Pays to Buy Now!
It Pays to Buy Now!
 
Cherry Hills Village March 2010
Cherry Hills Village March 2010Cherry Hills Village March 2010
Cherry Hills Village March 2010
 
February Foreclosure List for Denver, Colorado
February Foreclosure List for Denver, ColoradoFebruary Foreclosure List for Denver, Colorado
February Foreclosure List for Denver, Colorado
 
Wells Fargo 2010 Annual Outlook
Wells Fargo 2010 Annual OutlookWells Fargo 2010 Annual Outlook
Wells Fargo 2010 Annual Outlook
 
A COMPREHENSIVE ANALYSIS OF $1M+ TRANSACTIONS IN THE DENVER METRO AREA AS OF ...
A COMPREHENSIVE ANALYSIS OF $1M+ TRANSACTIONS IN THE DENVER METRO AREA AS OF ...A COMPREHENSIVE ANALYSIS OF $1M+ TRANSACTIONS IN THE DENVER METRO AREA AS OF ...
A COMPREHENSIVE ANALYSIS OF $1M+ TRANSACTIONS IN THE DENVER METRO AREA AS OF ...
 
University Hills Denver, CO Real Estate Report
University Hills Denver, CO Real Estate ReportUniversity Hills Denver, CO Real Estate Report
University Hills Denver, CO Real Estate Report
 
2009 Us Corporate Relocation Benchmarking Survey
2009 Us Corporate Relocation Benchmarking Survey2009 Us Corporate Relocation Benchmarking Survey
2009 Us Corporate Relocation Benchmarking Survey
 
University of Denver Community Residential Real Estate Trends
University of Denver Community Residential Real Estate TrendsUniversity of Denver Community Residential Real Estate Trends
University of Denver Community Residential Real Estate Trends
 
Mortgage Brokers Association Data
Mortgage Brokers Association DataMortgage Brokers Association Data
Mortgage Brokers Association Data
 
Defeating Procrastination
Defeating ProcrastinationDefeating Procrastination
Defeating Procrastination
 

Recently uploaded

Lowrate Call Girls In Sector 18 Noida ❤️8860477959 Escorts 100% Genuine Servi...
Lowrate Call Girls In Sector 18 Noida ❤️8860477959 Escorts 100% Genuine Servi...Lowrate Call Girls In Sector 18 Noida ❤️8860477959 Escorts 100% Genuine Servi...
Lowrate Call Girls In Sector 18 Noida ❤️8860477959 Escorts 100% Genuine Servi...lizamodels9
 
Digital Transformation in the PLM domain - distrib.pdf
Digital Transformation in the PLM domain - distrib.pdfDigital Transformation in the PLM domain - distrib.pdf
Digital Transformation in the PLM domain - distrib.pdfJos Voskuil
 
Call Girls Miyapur 7001305949 all area service COD available Any Time
Call Girls Miyapur 7001305949 all area service COD available Any TimeCall Girls Miyapur 7001305949 all area service COD available Any Time
Call Girls Miyapur 7001305949 all area service COD available Any Timedelhimodelshub1
 
The CMO Survey - Highlights and Insights Report - Spring 2024
The CMO Survey - Highlights and Insights Report - Spring 2024The CMO Survey - Highlights and Insights Report - Spring 2024
The CMO Survey - Highlights and Insights Report - Spring 2024christinemoorman
 
NewBase 19 April 2024 Energy News issue - 1717 by Khaled Al Awadi.pdf
NewBase  19 April  2024  Energy News issue - 1717 by Khaled Al Awadi.pdfNewBase  19 April  2024  Energy News issue - 1717 by Khaled Al Awadi.pdf
NewBase 19 April 2024 Energy News issue - 1717 by Khaled Al Awadi.pdfKhaled Al Awadi
 
8447779800, Low rate Call girls in Saket Delhi NCR
8447779800, Low rate Call girls in Saket Delhi NCR8447779800, Low rate Call girls in Saket Delhi NCR
8447779800, Low rate Call girls in Saket Delhi NCRashishs7044
 
Intro to BCG's Carbon Emissions Benchmark_vF.pdf
Intro to BCG's Carbon Emissions Benchmark_vF.pdfIntro to BCG's Carbon Emissions Benchmark_vF.pdf
Intro to BCG's Carbon Emissions Benchmark_vF.pdfpollardmorgan
 
Kenya Coconut Production Presentation by Dr. Lalith Perera
Kenya Coconut Production Presentation by Dr. Lalith PereraKenya Coconut Production Presentation by Dr. Lalith Perera
Kenya Coconut Production Presentation by Dr. Lalith Pereraictsugar
 
Youth Involvement in an Innovative Coconut Value Chain by Mwalimu Menza
Youth Involvement in an Innovative Coconut Value Chain by Mwalimu MenzaYouth Involvement in an Innovative Coconut Value Chain by Mwalimu Menza
Youth Involvement in an Innovative Coconut Value Chain by Mwalimu Menzaictsugar
 
Call Us 📲8800102216📞 Call Girls In DLF City Gurgaon
Call Us 📲8800102216📞 Call Girls In DLF City GurgaonCall Us 📲8800102216📞 Call Girls In DLF City Gurgaon
Call Us 📲8800102216📞 Call Girls In DLF City Gurgaoncallgirls2057
 
Call Girls In Sikandarpur Gurgaon ❤️8860477959_Russian 100% Genuine Escorts I...
Call Girls In Sikandarpur Gurgaon ❤️8860477959_Russian 100% Genuine Escorts I...Call Girls In Sikandarpur Gurgaon ❤️8860477959_Russian 100% Genuine Escorts I...
Call Girls In Sikandarpur Gurgaon ❤️8860477959_Russian 100% Genuine Escorts I...lizamodels9
 
FULL ENJOY Call girls in Paharganj Delhi | 8377087607
FULL ENJOY Call girls in Paharganj Delhi | 8377087607FULL ENJOY Call girls in Paharganj Delhi | 8377087607
FULL ENJOY Call girls in Paharganj Delhi | 8377087607dollysharma2066
 
Keppel Ltd. 1Q 2024 Business Update Presentation Slides
Keppel Ltd. 1Q 2024 Business Update  Presentation SlidesKeppel Ltd. 1Q 2024 Business Update  Presentation Slides
Keppel Ltd. 1Q 2024 Business Update Presentation SlidesKeppelCorporation
 
APRIL2024_UKRAINE_xml_0000000000000 .pdf
APRIL2024_UKRAINE_xml_0000000000000 .pdfAPRIL2024_UKRAINE_xml_0000000000000 .pdf
APRIL2024_UKRAINE_xml_0000000000000 .pdfRbc Rbcua
 
Case study on tata clothing brand zudio in detail
Case study on tata clothing brand zudio in detailCase study on tata clothing brand zudio in detail
Case study on tata clothing brand zudio in detailAriel592675
 
Kenya’s Coconut Value Chain by Gatsby Africa
Kenya’s Coconut Value Chain by Gatsby AfricaKenya’s Coconut Value Chain by Gatsby Africa
Kenya’s Coconut Value Chain by Gatsby Africaictsugar
 
Flow Your Strategy at Flight Levels Day 2024
Flow Your Strategy at Flight Levels Day 2024Flow Your Strategy at Flight Levels Day 2024
Flow Your Strategy at Flight Levels Day 2024Kirill Klimov
 
Ten Organizational Design Models to align structure and operations to busines...
Ten Organizational Design Models to align structure and operations to busines...Ten Organizational Design Models to align structure and operations to busines...
Ten Organizational Design Models to align structure and operations to busines...Seta Wicaksana
 
Organizational Structure Running A Successful Business
Organizational Structure Running A Successful BusinessOrganizational Structure Running A Successful Business
Organizational Structure Running A Successful BusinessSeta Wicaksana
 

Recently uploaded (20)

Lowrate Call Girls In Sector 18 Noida ❤️8860477959 Escorts 100% Genuine Servi...
Lowrate Call Girls In Sector 18 Noida ❤️8860477959 Escorts 100% Genuine Servi...Lowrate Call Girls In Sector 18 Noida ❤️8860477959 Escorts 100% Genuine Servi...
Lowrate Call Girls In Sector 18 Noida ❤️8860477959 Escorts 100% Genuine Servi...
 
Digital Transformation in the PLM domain - distrib.pdf
Digital Transformation in the PLM domain - distrib.pdfDigital Transformation in the PLM domain - distrib.pdf
Digital Transformation in the PLM domain - distrib.pdf
 
Call Girls Miyapur 7001305949 all area service COD available Any Time
Call Girls Miyapur 7001305949 all area service COD available Any TimeCall Girls Miyapur 7001305949 all area service COD available Any Time
Call Girls Miyapur 7001305949 all area service COD available Any Time
 
Corporate Profile 47Billion Information Technology
Corporate Profile 47Billion Information TechnologyCorporate Profile 47Billion Information Technology
Corporate Profile 47Billion Information Technology
 
The CMO Survey - Highlights and Insights Report - Spring 2024
The CMO Survey - Highlights and Insights Report - Spring 2024The CMO Survey - Highlights and Insights Report - Spring 2024
The CMO Survey - Highlights and Insights Report - Spring 2024
 
NewBase 19 April 2024 Energy News issue - 1717 by Khaled Al Awadi.pdf
NewBase  19 April  2024  Energy News issue - 1717 by Khaled Al Awadi.pdfNewBase  19 April  2024  Energy News issue - 1717 by Khaled Al Awadi.pdf
NewBase 19 April 2024 Energy News issue - 1717 by Khaled Al Awadi.pdf
 
8447779800, Low rate Call girls in Saket Delhi NCR
8447779800, Low rate Call girls in Saket Delhi NCR8447779800, Low rate Call girls in Saket Delhi NCR
8447779800, Low rate Call girls in Saket Delhi NCR
 
Intro to BCG's Carbon Emissions Benchmark_vF.pdf
Intro to BCG's Carbon Emissions Benchmark_vF.pdfIntro to BCG's Carbon Emissions Benchmark_vF.pdf
Intro to BCG's Carbon Emissions Benchmark_vF.pdf
 
Kenya Coconut Production Presentation by Dr. Lalith Perera
Kenya Coconut Production Presentation by Dr. Lalith PereraKenya Coconut Production Presentation by Dr. Lalith Perera
Kenya Coconut Production Presentation by Dr. Lalith Perera
 
Youth Involvement in an Innovative Coconut Value Chain by Mwalimu Menza
Youth Involvement in an Innovative Coconut Value Chain by Mwalimu MenzaYouth Involvement in an Innovative Coconut Value Chain by Mwalimu Menza
Youth Involvement in an Innovative Coconut Value Chain by Mwalimu Menza
 
Call Us 📲8800102216📞 Call Girls In DLF City Gurgaon
Call Us 📲8800102216📞 Call Girls In DLF City GurgaonCall Us 📲8800102216📞 Call Girls In DLF City Gurgaon
Call Us 📲8800102216📞 Call Girls In DLF City Gurgaon
 
Call Girls In Sikandarpur Gurgaon ❤️8860477959_Russian 100% Genuine Escorts I...
Call Girls In Sikandarpur Gurgaon ❤️8860477959_Russian 100% Genuine Escorts I...Call Girls In Sikandarpur Gurgaon ❤️8860477959_Russian 100% Genuine Escorts I...
Call Girls In Sikandarpur Gurgaon ❤️8860477959_Russian 100% Genuine Escorts I...
 
FULL ENJOY Call girls in Paharganj Delhi | 8377087607
FULL ENJOY Call girls in Paharganj Delhi | 8377087607FULL ENJOY Call girls in Paharganj Delhi | 8377087607
FULL ENJOY Call girls in Paharganj Delhi | 8377087607
 
Keppel Ltd. 1Q 2024 Business Update Presentation Slides
Keppel Ltd. 1Q 2024 Business Update  Presentation SlidesKeppel Ltd. 1Q 2024 Business Update  Presentation Slides
Keppel Ltd. 1Q 2024 Business Update Presentation Slides
 
APRIL2024_UKRAINE_xml_0000000000000 .pdf
APRIL2024_UKRAINE_xml_0000000000000 .pdfAPRIL2024_UKRAINE_xml_0000000000000 .pdf
APRIL2024_UKRAINE_xml_0000000000000 .pdf
 
Case study on tata clothing brand zudio in detail
Case study on tata clothing brand zudio in detailCase study on tata clothing brand zudio in detail
Case study on tata clothing brand zudio in detail
 
Kenya’s Coconut Value Chain by Gatsby Africa
Kenya’s Coconut Value Chain by Gatsby AfricaKenya’s Coconut Value Chain by Gatsby Africa
Kenya’s Coconut Value Chain by Gatsby Africa
 
Flow Your Strategy at Flight Levels Day 2024
Flow Your Strategy at Flight Levels Day 2024Flow Your Strategy at Flight Levels Day 2024
Flow Your Strategy at Flight Levels Day 2024
 
Ten Organizational Design Models to align structure and operations to busines...
Ten Organizational Design Models to align structure and operations to busines...Ten Organizational Design Models to align structure and operations to busines...
Ten Organizational Design Models to align structure and operations to busines...
 
Organizational Structure Running A Successful Business
Organizational Structure Running A Successful BusinessOrganizational Structure Running A Successful Business
Organizational Structure Running A Successful Business
 

DENVER MARKET WATCH YEAR END 2009

  • 1. YEAR'S END 2009 AVERAGE RESIDENTIAL PRICES IN THE DENVER METROLIST SYSTEM YEAR ALL AREAS DSE SSE DEC/DHR/DHL 1974 $34,722 $36,668 $50,912 $36,291 1975 $35,921 $36,381 $52,938 $59,250 1976 $39,740 $43,195 $61,135 $60,925 1977 $44,876 $50,825 $67,072 $64,473 1978 $55,610 $64,650 $83,446 $77,178 1979 $66,051 $77,648 $96,058 $80,129 1980 $78,594 $97,128 $127,856 $94,337 1981 $83,893 $98,263 $149,426 $101,684 1982 $87,816 $105,454 $161,047 $108,409 1983 $90,346 $109,035 $169,407 $113,755 1984 $95,137 $112,423 $167,934 $132,430 1985 $95,447 $112,415 $160,672 $119,942 1986 $97,049 $113,650 $170,716 $137,264 1987 $102,773 $116,006 $171,634 $137,204 1988 $98,937 $114,095 $171,848 $127,303 1989 $103,868 $117,491 $173,571 $133,061 1990 $102,848 $120,200 $194,900 $151,544 1991 $109,071 $120,485 $207,658 $146,456 1992 $115,154 $127,078 $212,173 $154,699 1993 $126,168 $140,513 $251,099 $164,913 1994 $138,301 $156,144 $278,046 $184,909 1995 $150,736 $172,185 $292,631 $192,643 1996 $159,328 $185,406 $315,670 $193,398 1997 $169,587 $201,601 $315,143 $205,132 1998 $185,785 $226,862 $358,542 $211,589 1999 $208,296 $259,311 $433,756 $231,368 2000 $257,394 $325,126 $492,378 $305,952 2001 $239,779 $301,211 $506,959 $277,089 2002 $268,926 $268 926 $348,850 $348 850 $507,371 $507 371 $315,375 $315 375 2003 $279,279 $365,652 $497,179 $315,402 2004 $290,876 $387,094 $527,605 $342,193 2005 $309,047 $426,258 $602,644 $355,242 2006 $317,112 $468,266 $589,911 $361,927 2007 $310,418 $486,515 $595,345 $372,880 2008 $270,261 $461,630 $529,667 $362,328 2009 $241,876 $435,726 $490,787 $358,684 History of Average Residential Prices in Denver Metro Area $700,000 $600,000 ALL AREAS $500,000 DSE SSE Price $400,000 $300,000 DEC/DHR/DHL $200,000 $100,000 $0 1974 1976 1978 1980 1982 1984 1986 1988 1990 1992 1994 1996 1998 2000 2002 2004 2006 2008 Date Information obtained from sources believed to be reliable but not guaranteed. All data obtained from Metrolist, Inc. and compiled by Tom Cryer, SCRP Broker Associate with The Kentwood Company.
  • 2. Total # of Listings and Sales at Year's End 2009 Denver MLS System YEAR LISTINGS SALES RATIO Total Count Total Count 12/31/75 35,728 19,156 1.87 Potential negative market signal (Above 2.50) 12/31/76 40,223 24,354 1.65 Potential positive market signal (Below 2.00) 12/31/77 41,598 29,875 1.39 Potential neutral market signal (Between 2.00 & 2.50) 12/31/78 49,675 31,213 1.59 Too soon to tell // Year to date // Inconclusive 12/31/79 59,384 31,024 1.91 Indicates all time high or low 12/31/80 55,438 23,952 2.31 12/31/81 49,755 22,125 2.25 12/31/82 52,817 18,756 2.82 12/31/83 63,585 23,566 2.70 12/31/84 69,041 23,264 2.97 12/31/85 73,279 24,489 2.99 12/31/86 75,694 25,865 2.93 12/31/87 69,740 23,414 2.98 12/31/88 62,521 24,120 2.59 12/31/89 50,112 25,142 1.99 12/31/90 53,682 26,436 2.03 12/31/91 53,286 27,375 1.95 12/31/92 48,103 34,828 1.38 12/31/93 69,118 40,291 1.72 12/31/94 73,637 40,068 1.84 12/31/95 78,969 37,767 2.09 12/31/96 84,909 39,849 2.13 12/31/97 90,813 41,959 2.16 12/31/98 103,402 47,836 2.16 12/31/99 72,842 48,795 1.49 12/31/00 100,672 50,499 1.99 12/31/01 133,688 49,372 2.71 12/27/02 138,445 49,326 2.81 12/29/03 123,596 47,731 2.59 12/31/04 127,989 53,710 2.38 12/31/05 135,008 54,072 2.50 12/31/06 152,807 52,220 2.93 12/31/07 143,400 51,304 2.80 12/31/08 123,655 48,926 2.53 12/31/09 104,330 42,962 2.43 7/1/2008 (EST) LISTINGS SALES RATIO Res 76,534 33,114 2.31 Cond 21,990 8,956 2.46 Land 3,819 463 8.25 Inc 1,987 429 4.63 Totals 104,330 42,962 2.43 Ratio of Listings to Sales 4.00 3.00 Ratio 2.00 1.00 0.00 1975 1977 1979 1981 1983 1985 1987 1989 1991 1993 1995 1997 1999 2001 2003 2005 2007 2009 Date Information obtained from sources believed to be reliable but not guaranteed. All data obtained from year to date statistics provided by Metrolist, Inc. and compiled by Tom Cryer, SCRP Broker Associate with The Kentwood Company
  • 3. DENVER METRO SINGLE FAMILY MARKET SHARE BY PRICE RANGE AS OF YEAR END 2009 LISTING RANGES ACTIVE LISTINGS UNDER CONTRACT SALES % MKT SHARE ALL PRICES 17,098 4,431 40,391 100.00% $0‐200K 4,215 2,329 17,058 42.23% $200‐400K 7,116 1,531 17,552 43.46% $400‐750K 3,636 485 5,108 12.65% $750K‐1M 972 75 650 1.61% $1M + 1,345 79 480 1.19% 101.13%  SUPPLY IN MONTHS OF SFR INVENTORY LISTING RANGES TOTAL # SALES MONTHS SUPPLY ALL PRICES 40,391 5.08 $0‐200K 17058 2.97 $200‐400K 17552 4.87 $400‐750K 5108 8.54 $750K‐1M 650 17.94 $1M + 480 33.63
  • 4. HISTORY OF FORECLOSURE ACTIVITY BY COUNTY IN DENVER METRO YEAR END 2009 35000 Arapahoe County 30000 Jefferson County Denver County 25000 Douglas County 20000 Boulder County Adams County 15000 Total Metro Area 10000 5000 0 Year 1972197419761978198019821984198619881990199219941996199820002002200420062008