
Recomendados
Más contenido relacionado
Más de Translinked
Más de Translinked (13)
Último
Último (20)
Genesee flint msa-platinum_profile-04-10-2012
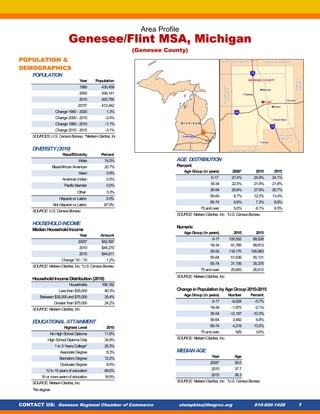
- 1. Area Profile Genesee/Flint MSA, Michigan (Genesee County) POPULATION & DEMOGRAPHICS POPULATION Year Population 1990 430,459 2000 436,141 2010 425,790 2015* 412,442 Change 1990 - 2000 1.3% Change 2000 - 2010 -2.4% Change 1990 - 2010 -1.1% Change 2010 - 2015 -3.1% SOURCES: U.S. Census Bureau, *Nielsen-Claritas, Inc DIVERSITY (2010) Race/Ethnicity Percent White 74.5% AGE DISTRIBUTION Black/African American 20.7% Percent Asian 0.9% Age Group (in years) 2000* 2010 2015 American Indian 0.5% 0-17 27.4% 24.9% 24.1% Pacific Islander 0.0% 18-34 22.5% 21.6% 21.8% 35-54 29.8% 27.9% 25.7% Other 3.3% 55-64 8.7% 12.2% 13.4% Hispanic or Latino 3.0% 65-74 6.6% 7.3% 8.6% Not Hispanic or Latino 97.0% 75 and over 5.0% 6.1% 6.5% SOURCE: U.S. Census Bureau SOURCE: Nielsen-Claritas, Inc. *U.S. Census Bureau HOUSEHOLD INCOME Numeric Median Household Income Age Group (in years) 2010 2015 Year Amount 0-17 105,552 99,528 2000* $42,597 18-34 91,785 89,813 2010 $44,270 35-54 118,170 105,983 2015 $44,811 55-64 51,639 55,131 Change '10 - '15 1.2% 65-74 31,156 35,375 SOURCE: Nielsen-Claritas, Inc, *U.S. Census Bureau 75 and over 25,683 26,612 SOURCE: Nielsen-Claritas, Inc. Household Income Distribution (2010) Households 168,182 Less than $35,000 40.3% Change in Population by Age Group 2010-2015 Between $35,000 and $75,000 35.4% Age Group (in years) Number Percent Greater than $75,000 24.2% 0-17 -6,024 -5.7% SOURCE: Nielsen-Claritas, Inc. 18-34 -1,972 -2.1% 35-54 -12,187 -10.3% 55-64 3,492 6.8% EDUCATIONAL ATTAINMENT Highest Level 2010 65-74 4,219 13.5% No High School Diploma 11.6% 75 and over 929 3.6% High School Diploma Only 34.9% SOURCE: Nielsen-Claritas, Inc. 1 to 3 Years College* 26.3% Associate Degree 8.3% MEDIAN AGE Bachelors Degree 12.2% Year Age Graduate Degree 6.6% 2000* 35.0 12 to 15 years of education 69.6% 2010 37.7 16 or more years of education 18.9% 2015 38.3 SOURCE: Nielsen-Claritas, Inc. SOURCE: Nielsen-Claritas, Inc. *U.S. Census Bureau *No degree CONTACT US: Genesee Regional Chamber of Commerce stompkins@thegrcc.org 810-600-1428 1
- 2. Area Profile: Genesee/Flint MSA, Michigan (Genesee County) LABOR FORCE CIVILIAN LABOR FORCE UNEMPLOYMENT Number Number Percent 2000 215,024 2000 9,519 4.4% 2010 190,785 2010 26,142 13.7% February, 2012 186,062 February, 2012 18,215 10.0% % Change 2000 - 2010 -11.3% SOURCE: U.S. Bureau of Labor Statistics SOURCE: U.S. Bureau of Labor Statistics LABOR PARTICIPATION (2010) EMPLOYMENT Number Percent Number Percent Male 101,666 65.1% 2000 205,505 95.6% Female 97,339 55.7% 2010 164,643 86.3% Total 199,005 60.2% February, 2012 167,847 90.2% SOURCE: Nielsen-Claritas, Inc. SOURCE: U.S. Bureau of Labor Statistics ESTABLISHMENT EMPLOYMENT BY INDUSTRY (2010) RESIDENT EMPLOYMENT BY OCCUPATION (2010) Industry Employment* Percent Occupational Groupm ploym ent Percent Total 126,260 100% Total 164,643 100% Agriculture, Forestry, Fishing and Hunting 214 0.2% Management, Incl. Farmers and Farm Mgrs 12,035 7.3% Mining 12 0.0% Business and Financial Operations 4,836 2.9% Utilities N/D - Computer and Mathematical 2,115 1.3% Construction 3,490 2.8% Architecture and Engineering 4,416 2.7% Manufacturing 9,718 7.7% Life, Physical, and Social Science 919 0.6% Wholesale Trade 4,421 3.5% Community and Social Services 2,811 1.7% Retail Trade 19,183 15.2% Legal 1,028 0.6% Transportation and Warehousing 934 0.7% Education, Training, and Library 8,695 5.3% Information 3,060 2.4% Arts, Design, Entertainment, Sports, and Media 2,479 1.5% Finance and Insurance 4,630 3.7% Healthcare Practitioners and Technical 10,072 6.1% Real Estate and Rental and Leasing 1,413 1.1% Healthcare Support 5,670 3.4% Professional, Scientific, and Technical Services 4,668 3.7% Protective Service 3,744 2.3% Management of Companies and Enterprises 192 0.2% Food Preparation and Serving Related 9,972 6.1% Administrative and Support and Waste Building, Grounds Cleaning, and Maintenance* 7,005 4.3% 7,174 5.7% Service : Personal Care and Service 7,267 4.4% Management and Remediation Services Educational Services 2,879 2.3% Sales and Related Occupations 19,971 12.1% Health Care and Social Assistance 21,974 17.4% Office and Administrative Support 22,052 13.4% Arts, Entertainment, and Recreation 1,807 1.4% Farming, Fishing, and Forestry* 168 0.1% Accommodation and Food Services 12,244 9.7% Construction and Extraction* 6,997 4.2% Other Services (except Public Administration) 3,998 3.2% Installation, Maintenance, and Repair* 5,485 3.3% Public Administration 5,219 4.1% Production* 16,159 9.8% SOURCE: U.S. Bureau of Labor Statistics, (QCEW) Transportation and Material Moving* 10,747 6.5% N/D: Data not available SOURCE: Nielsen-Claritas, Inc., U.S. Bureau of Labor Statistics * Total exceeds the sum of the parts due to non-disclosed data for some industries *Blue-collar occupations RESIDENT HIGH-KNOWLEDGE OCCUPATIONAL WHITE- AND BLUE-COLLAR OCCUPATIONAL EMPLOYMENT (2010) DISTRIBUTION (2010) Occupational Group Employment Percent Total 46,595 100% Occupational Group Employment Percent Healthcare Practitioner/Technician 10,072 21.6% Blue-Collar 46,561 28.3% Life/Physical/Social Science 919 2.0% White-Collar 118,082 71.7% Architecture/Engineering 4,416 9.5% SOURCE: Nielsen-Claritas, Inc., U.S. Bureau of Labor Statistics Arts/Design/Entertainment/Sports/Media 2,479 5.3% Business and Financial Operations 4,836 10.4% Computer and Mathematical 2,115 4.5% Education/Training/Library 8,695 18.7% Legal 1,028 2.2% Management including Farmers/Farm Mgrs 12,035 25.8% SOURCE: Nielsen-Claritas, Inc., U.S. Bureau of Labor Statistics CONTACT US: Genesee Regional Chamber of Commerce stompkins@thegrcc.org 810-600-1428 2
- 3. Area Profile: Genesee/Flint MSA, Michigan (Genesee County) LABOR FORCE, continued COMMUTATION PATTERNS (2009) Where Employees Live Where Residents Work Residence Location Percent Employm Location ent Percent Total 100% Total 100% Genesee County, MI 58.9% Genesee County, MI 52.7% Oakland County, MI 7.6% Oakland County, MI 14.0% Wayne County, MI 4.8% Wayne County, MI 5.1% Saginaw County, MI 3.6% Ingham County, MI 4.6% Macomb County, MI 2.8% Saginaw County, MI 3.6% Shiawassee County, MI 2.4% Macomb County, MI 3.4% Lapeer County, MI 2.4% Washtenaw County, MI 2.5% Livingston County, MI 2.3% Livingston County, MI 2.1% St. Clair County, MI 1.4% Kent County, MI 1.6% Tuscola County, MI 1.4% Lapeer County, MI 1.5% All Other Locations 12.4% All Other Locations 8.8% Non-residents as % of residents working 41% 47% % of county em ployees outside of hom county e SOURCE: U.S. Bureau of the Census OnTheMap SOURCE: U.S. Bureau of the Census OnTheMap AVERAGE ANNUAL EARNINGS BY INDUSTRY MEDIAN ANNUAL SALARIES BY OCCUPATION (2011) (2010 - Genesee County) Occupation Description Median* NAICS Industry Earnings Accounting Clerk, Intermediate Level $34,572 ------ Total $38,894 General Clerk, Intermediate Level $29,148 11---- Forestry, fishing, hunting, agriculture support $26,552 Call Center Representative II-inbound $31,082 21---- Mining $29,901 Customer Service Representative, Intermediate Level $34,002 22---- Utilities N/D Customer Service Representative, e-Commerce $27,678 23---- Construction $47,215 Electrician, Intermediate Level $46,523 31---- Manufacturing $63,066 Computer Operator, Intermediate Level $39,240 42---- Wholesale trade $53,634 Network Administrator, Intermediate Level $59,674 44---- Retail trade $24,190 Programmer, Intermediate Level $61,919 48---- Transportation & warehousing N/D Fork Lift Operator $28,790 51---- Information $44,008 General Laborer $26,369 52---- Finance & insurance $57,025 Operations Research Analyst, Intermediate Level $57,907 53---- Real estate & rental & leasing $29,643 SOURCE: Salary.com *Flint, MI 54---- Professional, scientific & technical services $49,374 55---- Management of companies & enterprises $84,070 Administration & Support, Waste 56---- Management and Remediation $29,639 61---- Educational services $31,148 62---- Health care and social assistance $45,899 71---- Arts, entertainment & recreation $16,936 72---- Accommodation & food services $13,038 81---- Other services (except public administration) $24,703 SOURCE: U.S. Bureau of Labor Statistics (QCEW) N/D: Data not available CONTACT US: Genesee Regional Chamber of Commerce stompkins@thegrcc.org 810-600-1428 3
- 4. Area Profile: Genesee/Flint MSA, Michigan (Genesee County) EDUCATION PUBLIC SCHOOLS & SECONDARY INSTITUTIONS (2009-2010) Total number of public schools 136 Expenditure per pupil by county* $4,992 Elementary schools 78 Middle schools 26 High schools 23 Public Acadamies 9 High school enrollment - Total 24,673 High school graduation rates: 83.82% SOURCE: State of Michigan *www.bestplaces.net COUNTY POST-SECONDARY INSTITUTIONS Total Fall Enrollment Graduates Less-than-Four-Year Institutions Address (2010) (2009-2010) Mott Community College Flint MI 11,850 1,830 Total Fall Enrollment Graduates Four-or-More-Year Institutions Address (2010) (2009-2010) Baker College of Flint Flint MI 7,104 764 Kettering University - Flint Flint MI 2051 509 University of Michigan - Flint Flint MI 8,138 1,295 SOURCE: U.S. Department of Education, National Center for Education Statistics (IPEDS) TOP DEGREES, CERTIFICATES AND DIPLOMAS BY NUMBER AWARDED 2009-2010 Certificates (2-Years Associates Bachelors Masters Description or Below) Degree Degree Degree Doctorate Health Professions and Related Programs 180 504 247 45 34 Liberal Arts and Sciences- General Studies and Humanities 12 682 12 Business- Management- Marketing- and Related Support Services 24 206 252 185 Engineering 365 17 Biological and Biomedical Sciences 188 61 7 Education 7 159 63 Computer and Information Sciences and Support Services 26 81 42 17 Engineering Technologies and Engineering-related Fields 39 86 11 Homeland Security- Law Enforcement- Firefighting- and Related Protective Service 6 104 22 Family and Consumer Sciences/Human Sciences 1 78 15 Public Administration and Social Service Professions 33 55 Visual and Performing Arts 2 37 38 English Language and Literature/Letters 54 19 Personal and Culinary Services 67 Mechanic and Repair Technologies/Technicians 30 23 Social Sciences 1 39 6 Communication- Journalism- and Related Programs 38 Psychology 35 Multi/Interdisciplinary Studies 34 History 21 TOTAL 321 2,063 1,466 426 34 SOURCE: U.S. Department of Education, National Center for Education Statistics (IPEDS) CONTACT US: Genesee Regional Chamber of Commerce stompkins@thegrcc.org 810-600-1428 4
- 5. Area Profile: Genesee/Flint MSA, Michigan (Genesee County) TRANSPORTATION & ACCESS QUALITY OF LIFE DRIVING DISTANCES AND TIMES COMMUTATION (2010) TO SELECTED LOCATIONS Distance % of Workforce with: Percent Destination in Miles* Time Under 15-minute commute or work at home 31.6% Lansing, MI 56 56 mins. 15 to 29-minute commute 37.8% Saginaw, MI 37 39 mins. 30 to 59-minute commute 21.4% Ann Arbor, MI 54 54 mins. 60-minute or more commute 9.2% Detroit, MI 68 1 hr, 8 mins. SOURCE: Nielsen-Claritas, Inc. London, Ont 130 2 hrs, 51 mins. MEDIAN HOME VALUE (2010) Grand Rapids, MI 114 1 hr, 48 mins. Value Chicago, IL 274 4 hrs, 30 mins. Median Home Value $43,260 Toledo, OH 107 1 hr, 43 mins. SOURCE: Nielsen-Claritas, Inc. Fort Wayne, IN 183 2 hrs, 47 mins. Cleveland, OH 222 3 hrs, 39 mins. CLIMATE SOURCE: MapQuest - *From Flint Average High Temp. °F (July) 82 Average Low Temp. °F (January) 14.9 NEAREST COMMERCIAL AIRPORTS AND DISTANCE Average Annual Rainfall (inches) 30.1 Distance Average Annual Snowfall (inches) 21.6 Airport Nam Category e in Miles* Average Precipitation Days 108 Bishop International Airport, Flint, MI Small Hub 5 Average Clear Days 169 Capital Region International, Lansing, MI Non-Hub 56 SOURCE: BestPlaces.net SOURCE: Federal Aviation Authority *From Flint COST-OF-LIVING INDEX VS. U.S. (U.S.=100) Cost of Living 73 SOURCE: BestPlaces.net LABOR LEGISLATION, WORKERS’ COMPENSATION, AND UNEMPLOYMENT INSURANCE TAXES (2011) WORKERS' COMPENSATION INSURANCE (2010) STATE CORPORATE INCOME TAX Rate - average manufacturing (2009) 4.13 Maximum Rate 4.95% Rate - clerical code 8810 0.33 Taxable Base Gross Maximum weekly benefit $752 SOURCE: State of Michigan SOURCE: State of Michigan SALES AND USE TAX STATE UNEMPLOYMENT INSURANCE (2010) State Rate 6.0% Unemployment insurance rate (avg. existing employers) 0.8% - 10.3% Local Add-On None Unemployment insurance rate (for new employers) 2.70% SOURCE: State of Michigan Unemployment insurance taxable base $9,000 Unemployment insurance maximum weekly benefit $362 PERSONAL STATE INCOME TAX SOURCE: ADP, Inc. Maximum State Tax Rate 4.35% Federal Adjusted Taxable Base STATE LABOR LEGISLATION Gross Income Employment-at-Will Legislation in effect? Yes SOURCE: State of Michigan Right-to-Work law in effect? No SOURCE: State of Michigan PROPERTY TAX (County Average) Effective Property Tax Rate per $1,000 of home value $12.85 SOURCE: BestPlaces.net CONTACT US: Genesee Regional Chamber of Commerce stompkins@thegrcc.org 810-600-1428 5
- 6. Area Profile: Genesee/Flint MSA, Michigan (Genesee County) MAJOR EMPLOYERS (Top 10 by Employment) Prim Product ary Nam e Employment NAICS or Service Location General Motors: 6,504 33611 Automotive Manufacturing Flint Flint Truck Assembly Flint Metal Center Flint Engine Operations Grand Blanc WTC Flint Tool and Die Customer Care, After-Sales Hdqtr. CCA, Swartz Creek CCA, Davidson Road Genesys Medical Center 4,000 62211 General Medical & Surgical Hospitals Grand Blanc McLaren Regional Medical Center 2,600 62211 General Medical & Surgical Hospitals Flint Hurley Medical Center 2,400 62211 General Medical & Surgical Hospitals Flint Citizens Bank 2,164 52211 Financial Institution Flint Flint Schools 1,396 61111 Public School System Flint Mott Community College 1,179 61131 Colleges & Universities Flint Genesee County Government 1,100 92 Government Flint Meijer 1,081 44511 Supermarkets and Grocery Stores Flint Baker College 1,014 61131 Colleges & Universities Flint University of Michigan 1,000 61131 Colleges & Universities Flint City of Flint 850 92 Government Flint Kettering University 386 61131 Colleges & Universities Flint SOURCE: Genesee Economic Development; ReferenceUSA EMPLOYMENT CLUSTERS (County Level) Location Location Quotient Quotient INDUSTRY CLUSTERS U.S.=1.00 OCCUPATIONAL CLUSTERS U.S.=1.00 Advanced Materials 1.00 Managerial, Sales, Marketing and HR 0.77 Agribusiness, Food Processing & Technology 1.06 Skilled Production Workers: Technicians, Operators, Trades, Installers & Repairers 0.92 Apparel & Textiles 0.49 Health Care and Medical Science (Aggregate) 1.34 Arts, Entertainment, Recreation & Vistor Industries 0.63 Health Care and Medical Science (Medical Practitioners and Scientists) 1.43 Biomedical/Biotechnical (Life Sciences) 0.86 Health Care and Medical Science (Medical Technicians) 1.58 Business & Financial Services 4.72 Health Care and Medical Science (Therapy, Counseling and Rehabilitation ) 1.22 Chemicals & Chemical-Based Products 0.88 Mathematics, Statistics, Data and Accounting 0.63 Defense & Security 0.78 Legal and Financial Services, and Real Estate (L & FIRE) 0.84 Education & Knowledge Creation 0.72 Information Technology (IT) 0.76 Energy (Fossil & Renewable) 1.07 Natural Sciences and Environmental Management 0.35 Forest & Wood Products 0.93 Agribusiness and Food Technology 0.48 Glass & Ceramics 0.96 Primary/Secondary and Vocational Education, Remediation & Social Services 1.11 Information Technology & Telecommunications 1.00 Building, Landscape and Construction Design 0.59 Transportation & Logistics 0.63 Engineering and Related Sciences 0.54 Manufacturing Supercluster: 0.88 Personal Services Occupations 1.83 Primary Metal Mfg 0.59 Arts, Entertainment, Publishing and Broadcasting 0.85 Fabricated Metal Product Mfg 1.23 Public Safety and Domestic Security 0.74 Machinery Mfg 1.95 Post-secondary Education and Knowledge Creation 0.87 Computer & Electronic Product Mfg 0.56 Technology-Based Knowledge Clusters 0.79 Electrical Equipment, Appliance & Component Mfg 0.64 SOURCE: StatsAmerica Transportation Equipment Mfg 2.18 Mining 0.59 Printing & Publishing 0.67 SOURCE: StatsAmerica CONTACT US: Genesee Regional Chamber of Commerce stompkins@thegrcc.org 810-600-1428 6
- 7. 30-Minute Labor-Shed Profile 519 S. Saginaw Street, Flint, MI POPULATION & DEMOGRAPHICS POPULATION AGE DISTRIBUTION Year Population Percent 1990 565,416 Age Group (in years) 2000 2010 2015 2000 589,534 0-17 27.3% 24.3% 23.3% 2010 (est) 580,408 18-34 21.9% 21.4% 21.8% 2015 (est) 568,243 35-54 30.8% 28.5% 25.9% Change 1990 - 2000 4.3% 55-64 8.9% 12.6% 13.9% Change 2000 - 2010 -1.5% 65-74 6.3% 7.4% 8.9% Change 1990 - 2010 2.7% 75 and over 4.8% 5.8% 6.2% Change 2010 - 2015 -2.1% SOURCE: Nielsen-Claritas, Inc. Numeric Age Group (in years) 2010 2015 DIVERSITY (2010) 0-17 140,935 132,221 Race/Ethnicity Percent 18-34 124,123 123,879 White 81.2% 35-54 165,439 147,414 Black/African American 14.3% 55-64 73,257 78,895 Asian 0.9% 65-74 43,152 50,339 American Indian 0.5% 75 and over 33,502 35,496 Pacific Islander 0.0% Other 3.1% Change in Population by Age Group (2010-2015) Hispanic or Latino 2.5% Age Group (in years) Number Percent Not Hispanic or Latino 97.5% 0-17 -8,714 -6.2% SOURCE: Nielsen-Claritas, Inc. 18-34 -244 -0.2% 35-54 -18,025 -10.9% HOUSEHOLD INCOME (2010) 55-64 5,638 7.7% Median Household Income 65-74 7,187 16.7% Year Amount 75 and over 1,994 6.0% 2000 $45,858 SOURCE: Nielsen-Claritas, Inc. 2010 $48,213 2015 $49,038 MEDIAN AGE Change '10 - '15 1.7% Year Age SOURCE: Nielsen-Claritas, Inc. 2000 35.5 2010 38.3 Household Income Distribution (2010) 2015 39.2 Households 226,358 SOURCE: Nielsen-Claritas, Inc. Less than $35,000 36.5% Between $35,000 and $75,000 35.5% Greater than $75,000 28.0% SOURCE: Nielsen-Claritas, Inc. EDUCATIONAL ATTAINMENT Highest Level 2010 No High School Diploma 11.0% High School Diploma Only 34.3% 1 to 3 Years College* 26.2% Associate Degree 8.6% Bachelors Degree 12.9% Graduate Degree 7.1% 12 to 15 years of education 69.1% 16 or more years of education 19.9% SOURCE: Nielsen-Claritas, Inc. *No degree CONTACT US: Genesee Regional Chamber of Commerce stompkins@thegrcc.org 810-600-1428 7
- 8. 30-Minute Labor-Shed Profile: 519 S. Saginaw Street, Flint, MI LABOR FORCE CIVILIAN LABOR FORCE UNEMPLOYMENT Number Number Percent 2000 286,403 2000 18,324 6.4% 2010 280,997 2010 29,330 10.4% % Change 2000 - 2010 -1.9% SOURCE: Nielsen-Claritas, Inc. SOURCE: Nielsen-Claritas, Inc. LABOR PARTICIPATION (2010) EMPLOYMENT Number Percent Number Percent Male 88,712 100.0% 2000 268,079 93.6% Female 134,945 56.8% 2010 251,667 89.6% Total 280,997 61.6% SOURCE: Nielsen-Claritas, Inc. SOURCE: Nielsen-Claritas, Inc. RESIDENT EMPLOYMENT BY INDUSTRY (2010) RESIDENT EMPLOYMENT BY OCCUPATION (2010) Industry Employment Percent Occupational Group Employment Percent Total 251,667 100% Total 251,667 100% Agriculture/Forest/Fish/Hunt 1,254 0.5% Management , Including Farmers and Farm Managers 20,192 8.0% Construction 14,282 5.7% Business and Financial Operations 8,542 3.4% Total Manufacturing 46,675 18.5% Computer and Mathematical 3,485 1.4% Wholesale Trade 6,636 2.6% Architecture and Engineering 7,729 3.1% Retail Trade 33,152 13.2% Life, Physical, and Social Science 1,252 0.5% Transport/Warehse/Utils 10,048 4.0% Community and Social Services 4,158 1.7% Information 4,689 1.9% Legal 1,905 0.8% Fin/Insur/RE/Rent/Lse 13,010 5.2% Education, Training, and Library 12,898 5.1% Prof/Sci/Tech/Admin 10,916 4.3% Arts, Design, Entertainment, Sports, and Media 3,721 1.5% Mgmt of Companies 171 0.1% Healthcare Practitioners and Technical 14,462 5.7% Admin/Spprt/Waste Mgmt 10,541 4.2% Healthcare Support 7,603 3.0% Educational Svcs 21,331 8.5% Protective Service 5,618 2.2% Health Care/Soc Asst 36,819 14.6% Food Preparation and Serving Related 14,757 5.9% Entertainment/Rec Svcs 4,196 1.7% Building and Grounds Cleaning, and Maintenance* 10,165 4.0% Accommodation and Food Services 17,714 7.0% Service : Personal Care and Service 10,613 4.2% Other Services (excluding Public Administration) 11,431 4.5% Sales and Related Occupations 29,275 11.6% Public Administration 8,803 3.5% Office and Administrative Support 33,321 13.2% SOURCE: Nielsen-Claritas, Inc. Farming, Fishing, and Forestry* 406 0.2% Construction and Extraction* 11,527 4.6% Installation, Maintenance, and Repair* 9,215 3.7% Production* 24,439 9.7% Transportation and Material Moving* 16,383 6.5% SOURCE: Nielsen-Claritas, Inc. *Blue-collar occupations RESIDENT HIGH-KNOWLEDGE OCCUPATIONAL WHITE- AND BLUE-COLLAR OCCUPATIONAL EMPLOYMENT (2010) DISTRIBUTION (2010) Occupational Group Employment Percent Occupational Group Employment Percent Total 74,187 100.0% Blue Collar 72,135 28.7% Healthcare Practitioner/Technician 14,462 19.5% White Collar 179,532 71.3% Life/Physical/Social Science 1,252 1.7% SOURCE: Nielsen-Claritas, Inc. Architecture/Engineering 7,729 10.4% Arts/Design/Entertainment/Sports/Media 3,721 5.0% Business and Financial Operations 8,542 11.5% FOR MORE INFORMATION, PLEASE CONTACT Computer and Mathematical 3,485 4.7% Genesee Regional Chamber of Commerce Education/Training/Library 12,898 17.4% 519 S. Saginaw Street, Suite 200, Flint, MI 48502 Sherry Tompkins, Director of Marketing Legal 1,905 2.6% Phone: 810-600-1428 Management including Farmers/Farm Mgrs 20,192 27.2% E-mail: stompkins@thegrcc.org SOURCE: Nielsen-Claritas, Inc. Website: www.thegrcc.org PREPARED BY WADLEY-DONOVAN GROWTHTECH, LLC: 02-13-2012 CONTACT US: Genesee Regional Chamber of Commerce stompkins@thegrcc.org 810-600-1428 8