SlideShare una empresa de Scribd logo
1 de 4
Descargar para leer sin conexión
Q4 2010 | OFFICE


       METRO DETROIT & WASHTENAW MARKET

 RESEARCH REPORT


                                                                          Detroit Office Market
                                                                          DETROIT OFFICE MARKET REPORTS A SLIGHT INCREASE IN RENTAL RATES AND
                                                                          DECREASE IN VACANCY RATES
                                                                          At the end of 2010, the fourth quarter Metro Detroit office market area has finally shown
                                                                          positive results after a long steady decline due to the current recession that the entire
                                                                          Nation is experiencing. Net absorption totaled a positive 924,996 square feet at the end of
      MARKET INDICATORS Q4                                                the fourth quarter 2010. Vacancy rates decreased to 19 percent this quarter. Rental rates
                                           2009      2010                 slightly increased to $18.77 per square foot.
                             VACANCY
                                                                          The Detroit Michigan real estate market has taken a hard hit over the last few years due to
                       NET ABSORPTION                                     increasing unemployment and continuing downsizing of organizations. New development
                                                                          and construction are practically nonexistent. Through 2011, challenges remain for
                        CONSTRUCTION                                      commercial property owners as mortgages become due, vacancies remain high and new
                                                                          projects are scarce.
                          RENTAL RATE


                         1500000                                            0.2
                                                                                                   UNDER CONSTRUCTION BY SUBMARKET
                         1000000                                            0.195
                                                                                                              0%
                                                                                                                                    I-696 Corridor
                          500000
M illion Square Feet


                                                                            0.19
                                                                                    V acancy (^)


                                                                                                        23%                         Northern Oakland
                               0
                                                                                                                                    County
                                                                            0.185
                         -500000                                                                                                    Macomb County
                                                                                                                                    Area
                                                                            0.18
                        -1000000                                                                                                    I-96 Corridor
                                                                                                                      77%
                        -1500000                                            0.175
                                                                                                                                    Washtenaw County

                        -2000000                                            0.17
                                    Q4   Q1         Q2       Q3     Q4
                                   2009 2010       2010     2010   2010

                             Completions          Absorption         Vacancy Rate (%)


       www.colliers.com/detroit
RESEARCH REPORT | Q4 2010 | OFFICE | DETROIT


                                                         RENTAL RATES                                       Local landlords must continue to offer
Total office inventory in the Detroit market             A building’s vacancy is the major factor in        aggressive incentives on both new leases
area amounted to 164,292,884 Square feet in              its rental rate rather than the overall            and renewals.
2,940 properties.                                        performance of a market sector. Rates
                                                         range from $12.04 to $25.58.                       CONSTRUCTION
Total year to date net absorption at the end of
2010 totaled a positive 223,249 square feet.                                                                Fourth quarter delivered any additional
                                                         The Metro Detroit’s average rental rate            44,500 square feet of office product to the
                                                         increased since third quarter 2010 and             market. All Class B type and located in the
                                                         stands at $18.77 per square foot. This             Oakland County Central Submarket.
                                                         represented a $0.33 decrease from 12
                                                         months ago.                                        Construction activity decreased this quarter
                                                                                                            compared to third quarter. With 8,885
                                                         Currently, the average rental rate in fourth       square feet of office space reported under
                                                         quarter for Class A was $22.49, Class B            construction, mainly concentrated in the
                                                         was $18.17 and Class C was at $14.38.              Suburban market and majority Class B type
                                                         Detroit’s Downtown average asking rental           property.
                                                         rate decreased $0.06 to $18.45 while a
                                                         $0.04 increase to $18.70 reported in the            continued on page 4
                                                         suburban markets.


 SALES ACTIVITY

 PROPERTY ADDRESS                                 CITY                      SALE DATE            SALE PRICE            SIZE        PRICE PER SF
 333 E Jefferson Ave (3 Properties)               Detroit                  12/2/2010             37,800,000            550,094
 401-411 S Old Woodward Ave                       Birmingham               11/12/2010            15,300,000            250,000     61.2
 38525 Woodward Ave                               Bloomfield Hills         12/17/2010            7,000,000             63,186      110.78
 43630 Hayes Rd (5 Properties)                                             12/29/2010            6,525,000             98,830      66.02
 17199 N Laurel Park Dr                           Livonia                  12/23/2010            6,000,000             124,000     48.39
 1349 S Rochester Rd                              Rochester Hills          12/22/2010            2,825,000             64,000      44.14
 500 Avis Dr                                      Ann Arbor                10/29/2010            2,000,000             27,160      73.64
 6001 N Adams Rd                                  Bloomfield Hills         12/28/2010            2,000,000             67,484      29.64
 29621 Northwestern Hwy                           Southfield               11/5/2010             1,875,000             26,500      70.75
 800-900 W University Blvd                        Rochester                12/3/2010             1,500,000             40,400      37.13
 6050 Greenfield Rd                               Dearborn                 11/5/2010             1,434,532             15,100      95
 17000 Executive Plaza Dr                         Dearborn                 11/30/2010            1,250,000             60,000      20.83


 LEASE ACTIVITY

 BUILDING NAME                                    SUBMARKET                TENANT                                                   SIZE SF
 28333 Telegraph Rd.                              Southfield               Int. AutomotiveComponentsGroup                           113,894
 401 - 407 E. Liberty St.                         Washtenaw                Google                                                   81,292
 100 Galleria                                     Southfield               NA                                                       41,865
 2800 Livernois Rd.                               Troy                     Carlson Marketing                                        36,720


P. 2   | COLLIERS INTERNATIONAL
RESEARCH REPORT | Q4 2010 | OFFICE | DETROIT
                                                        SUBLEASE                              NET ABSORPTION                 U/C & PROPOSED                    AVG
   EXISTING PROPERTIES          DIRECT VACANCY          VACANCY          TOTAL VACANCY              - SF     NEW SUPPLY - SF        - SF                       RENT
                     Total
                   Inventory                                                                    4Q                   Current             Under
 Class   Bldgs.     Sq. Ft.      Sq. Ft.    Rate      Sq. Ft.    Rate      Sq. Ft.    Rate    Period        YTD      Period     YTD      Constr. Proposed      Rate
DOWNTOWN MARKETS
                                                                 Detroit CBD and New Center Area
  A       24      11,563,170    2,012,289   17.4%      2,704     0.0%     2,014,993   17.4%     815      (282,975)     0         0         0       194,604     $23.00
  B       96      15,919,800    2,574,908   16.2%     45,831     0.3%     2,620,739   16.5%    7,362     (249,448)     0         0         0          0        $16.89
  C       50       2,963,362     545,473    18.4%        0       0.0%     545,473     18.4%   42,721       83,915      0         0         0          0        $15.81
  All     170     30,446,332    5,132,670   16.9%     48,535     0.2%     5,181,206   17.0%   50,898     (448,508)     0         0         0       194,604     $19.11
                                                    Outer Detroit, Dearborn, and Downriver, Airport, The Pointes
  A       26       5,669,774     333,750    5.9%      15,060     0.3%     348,810     6.2%    116,768     139,960                                              $21.21
  B       179     10,020,178    2,373,361   23.7%     57,401     0.6%     2,430,762   24.3%   187,727     (39,426)                                  40,000     $18.67
  C       165      5,910,157     924,731    15.6%        0       0.0%     924,731     15.6%   57,271      247,747      0         0                    0        $12.04
  All     370     21,600,109    3,631,842   16.8%     72,461     0.3%     3,704,303   17.1%   361,766     348,281      0         0         0        40,000     $17.52
DOWNTOWN TOTALS
  A       50      17,232,944    2,346,039   13.6%     17,764     0.1%     2,363,803   13.7%   117,583    (143,015)     0         0         0       194,604     $22.41
  B       275     25,939,978    4,948,269   19.1%     103,232    0.4%     5,051,501   19.5%   195,089    (288,874)     0         0         0        40,000     $17.58
  C       215      8,873,519    1,470,204   16.6%        0       0.0%     1,470,204   16.6%   99,992      331,662      0         0         0          0        $13.30
  All     540     52,046,441    8,764,512   16.8%     120,996    0.2%     8,885,509   17.1%   412,664    (100,227)     0         0         0       234,604     $18.45
SUBURBAN MARKETS
                                               I-696 Corridor: Madison Heights, Royal Oak, Ferndale, Southfield
  A       26       6,173,667    1,339,889   21.7%     159,978    2.6%     1,499,867   24.3%     178       (39,725)                                 949,000     $20.97
  B       229     15,225,304    3,299,200   21.7%     95,120     0.6%     3,394,320   22.3%   211,879     112,057                                   85,550     $17.47
  C       172      5,012,512     691,164    13.8%     25,980     0.5%     717,144     14.3%   52,632       86,994      0         0         0          0        $13.92
  All     427     26,411,483    5,330,253   20.2%     281,078    1.1%     5,611,332   21.2%   264,689     159,326      0         0         0       1,034,550   $17.61
                                                      Oakland County Central: Birmingham, Bloomfields, Troy
  A       46       7,461,835    1,681,745   22.5%     40,732     0.5%     1,722,477   23.1%   (33,769)   (191,536)             27,220              627,003     $21.20
  B       263     14,099,756    4,506,191   32.0%     185,082    1.3%     4,691,273   33.3%   (68,023)    (91,459)   44,500    60,500               93,550     $19.21
  C       90       2,208,549     315,901    14.3%     47,577     2.2%     363,478     16.5%   26,476      (12,792)     0         0                             $15.83
  All     399     23,770,140    6,503,837   27.4%     273,391    1.2%     6,777,229   28.5%   (75,316)   (295,787)   44,500    87,720      0       720,553     $19.52
                                       Northern Oakland County: Rochester, Auburn Hills, Clarkston, Lake Orion, Pontiac
  A       16       6,334,686     207,769    3.3%      22,497     0.4%     230,266     3.6%     8,563       31,130                                  419,852     $23.99
  B       140      6,963,072    2,561,828   36.8%     60,301     0.9%     2,622,129   37.7%   28,099       25,120                                  293,464     $17.80
  C       81       2,557,867     487,059    19.0%        0       0.0%     487,059     19.0%   14,709        327        0         0         0                   $15.76
  All     237     15,855,625    3,256,656   20.5%     82,798     0.5%     3,339,455   21.1%   51,371       56,577      0         0         0       713,316     $19.94
                     Macomb County Area: Warren, Sterling Heights, Shelby Twp., Roseville, Clinton Twp., Saint Clair Shores, Macomb Twp.
  A       11       611,896       185,039    30.2%        0       0.0%     185,039     30.2%    1,456       53,567                                   70,327     $23.59
  B       255      6,379,069    1,104,675   17.3%      8,669     0.1%     1,113,344   17.5%   (7,959)      8,545                                   212,002     $17.81
  C       141      2,741,134     232,343    8.5%       3,600     0.1%     235,943     8.6%    11,357       14,535      0         0         0                   $13.34
  All     407      9,732,099    1,522,057   15.6%     12,269     0.1%     1,534,327   15.8%    4,854       57,352      0         0         0       282,329     $16.91
                                                    I-96 Corridor: Novi, Howell, Brighton, South Lyon, Farmington
  A        30      3,470,040     604,692    17.4%     143,503    4.1%     748,195     21.6%   (12,281)    (45,875)                                 1,720,746   $23.10
  B       263     10,066,754    1,280,684   12.7%     17,074     0.2%     1,297,758   12.9%   165,730     293,736                         6,885    355,108     $19.22
  C        90      1,780,694     270,569    15.2%        0       0.0%     270,569     15.2%   (21,225)    (50,037)     0         0         0        14,000     $17.15
  All     383     15,317,488    2,155,945   14.1%     160,577    1.0%     2,316,522   15.1%   132,224     197,824      0         0        6,885    2,089,854   $19.86
                                                   I-275 Corridor: Livonia, Westland, Canton, Plymouth, Northville
  A       11       1,579,420     287,199    18.2%      4,655     0.3%     291,854     18.5%   (20,697)    (16,916)                                 100,000     $21.03
  B       151      4,771,134     887,933    18.6%     15,489     0.3%     903,422     18.9%   21,181       44,202                                  251,204     $17.78
  C       75       2,284,063     308,803    13.5%        0       0.0%     308,803     13.5%   (3,231)     (32,673)     0         0         0                   $14.03
  All     237      8,634,617    1,483,935   17.2%     20,144     0.2%     1,504,080   17.4%   (2,747)     (5,387)      0         0         0       351,204     $17.38
SUBURBAN TOTALS
  A       140     25,631,544    4,306,333   16.8%     371,365    1.4%     4,677,698   18.2%   (56,550)   (209,355)     0       27,220      0       3,886,928   $22.14
  B      1,301    57,505,089    13,640,511 23.7%      381,735    0.7%    14,022,246 24.4%     350,907     372,906    44,500    60,500     6,885    1,290,878   $18.31
  C       649     16,584,819    2,305,839   13.9%     77,157     0.5%     2,382,996   14.4%   80,718       6,354       0         0         0        14,000     $14.72
  All    2,090    99,721,452    20,252,683 20.3%      830,257    0.8%    21,082,941 21.1%     375,075     169,905    44,500    87,720     6,885    5,191,806   $18.70
WASHTENAW COUNTY
  A       24       3,345,044     271,016    8.1%       1,156     0.0%     272,172     8.1%    (17,155)    (16,793)     0                           806,381     $25.58
  B       214      7,801,244     665,653    8.5%      41,425     0.5%     707,078     9.1%    152,228     178,069      0         0        2,000    267,127     $19.15
  C       72       1,378,703     191,160    13.9%        0       0.0%     191,160     13.9%    2,184      (7,705)      0                   0                   $17.22
  All     310     12,524,991    1,127,829   9.0%      42,581     0.3%     1,170,410   9.3%    137,257     153,571      0         0        2,000    1,073,508   $20.65
MARKET TOTALS – DOWNTOWN, SUBURBAN, AND WASHTENAW COUNTY
  A       214     46,209,532    6,923,388   15.0%     390,285    0.8%     7,313,673   15.8%   43,878     (369,163)     0       27,220      0       4,887,913   $22.49
  B      1,790    91,246,311    19,254,433 21.1%      526,392    0.6%    19,780,825 21.7%     698,224     262,101    44,500    60,500     8,885    1,598,005   $18.17
  C       936     26,837,041    3,967,203   14.8%     77,157     0.3%     4,044,360   15.1%   182,894     330,311      0         0         0        14,000     $14.38
  All    2,940    164,292,884   30,145,024 18.3%      993,834    0.6%    31,138,860 19.0%     924,996     223,249    44,500    87,720     8,885    6,499,918   $18.77


QUARTERLY COMPARISON AND TOTALS
 Q410    2,940    164,292,884   30,145,024 18.3%      993,834    0.6%    31,138,860 19.0%     924,996     223,249    44,500    87,720     8,885    6,499,918   $18.77
 Q310    2,911    163,189,957   30,709,526 18.8%      986,171    0.6%    31,695,699 19.4%        0       (701,747)   27,220    16,000    740,309   6,925,908   $18.75
 Q210    2,891    162,710,814   30,323,377 18.6% 1,005,839       0.6%    31,329,218 19.3%        0       (612,530)   16,000    16,000    202,528   7,311,514   $18.98
 Q110    2,931    168,406,862   29,844,859 17.7% 1,245,183       0.7%    31,090,044 18.5%                (510,483)     0         0       149,709   7,764,636   $18.92
 Q409    2,895    166,790,401   29,081,419 17.4% 1,346,110       0.8%    30,427,531 18.2%                (2,830,949) 88,719    165,557   285,409   8,114,232   $19.10
 Q309    2,843    163,465,688   27,428,354 16.8% 1,033,600       0.6%    28,461,956 17.4%        0       (1,191,121) 20,872    76,838    223,575   6,378,890   $19.20
 Q209    2,819    161,069,549   27,376,284 17.0% 1,011,099       0.6%    28,387,385 17.6%        0       (654,896)     0       55,966    197,463   8,361,715   $19.38
 Q109    2,824    161,898,822   27,658,991 17.1% 1,191,626       0.7%    28,850,619 17.8%                (683,664)   55,966    55,966    228,624   8,787,019   $19.58
 Q408    2,798    162,686,534   26,483,723 16.3% 1,270,905       0.8%    27,754,630 17.1%                 189,881      0       48,260    319,158   8,558,723   $19.62


                                                                                                                                                          COLLIERS INTERNATIONAL |   P. 3
RESEARCH REPORT | Q4 2010 | OFFICE | DETROIT


                                                                                                    480 offices in
VACANCY                                                                                             61 countries on
The overall office vacancy rate in the Metro
Detroit market decreased to 19.0% in the
                                                                                                    6 continents
                                               Net absorption for Detroit’s Central Business
fourth quarter 2010 compared to third                                                               United States: 135
                                               District increased this quarter to a positive
quarter; higher than it was 12 months ago at                                                        Canada: 39
                                               50,898 square feet. The suburban markets             Latin America: 17
18.2%.
                                               saw a decline and posted a positive 375,075          Asia Pacific: 194
                                               square feet for the fourth quarter 2010.             EMEA: 95
The average vacancy rate for Class A
projects was 15.8%, Class B projects 21.7%                                                      •   $1.9 billion in annual revenue
and Class C projects 15.1%. Detroit’s          SALES ACTIVITY                                   •   2.4 billion square feet under
Downtown vacancy rate decreased to 17.1%                                                            management
                                               At the end of the third quarter of 2010, total
and the Suburban vacancy slightly                                                               •   Over 15,000 professionals
                                               office building sales activity was up
decreased to 21.1% in the fourth quarter of
                                               compared to 2009. In the first nine months
2010.
                                               of 2010, the market saw 34 office sales              UNITED STATES:
                                               transactions with a total volume of over             Colliers International - Detroit
                                               $195 million. The price per square foot              2 Corporate Drive
ABSORPTION/LEASING ACTIVITY                    averaged $76. In the same first nine months          Suite 300
Net absorption for the overall office market   of 2009, 17 transactions posted with a total         Southfield, Michigan 48076
in the fourth quarter 2010 amounted to a       volume of over $53 million. The price per            TEL +1 248 540 1000
positive 924,996 square feet, an increase      square foot averaged $44. Locally, sales             FAX +1 248 540 1038
from last quarter.                             are averaging approximately $35 - $75 per
                                               square foot and capitalization rates between
The Outer Detroit Dearborn submarket           8.5 and 9.5%.
reported the highest absorption while the                                                           RESEARCH DEPARTMENT:
Oakland County submarket came in with the                                                           Michelle McGuckin
lowest. 2010 has amounted to a positive                                                             TEL +1 248 226 1848
223,249 square feet.                                                                                FAX +1 248 226 1849
                                                                                                    EMAIL michelle.mcguckin@colliers.com


                                                                                                    Copyright © 2010 Colliers International.

                                                                                                    The information contained herein has been obtained
                                                                                                    from sources deemed reliable. While every reasonable
                                                                                                    effort has been made to ensure its accuracy, we cannot
                                                                                                    guarantee it. No responsibility is assumed for any
                                                                                                    inaccuracies. Readers are encouraged to consult their
                                                                                                    professional advisors prior to acting on any of the
                                                                                                    material contained in this report.


                                                                                                              Accelerating success.


www.colliers.com/marketname

Más contenido relacionado

La actualidad más candente

Savills - Ha Noi Market Brief Q3 2009 ENG
Savills - Ha Noi Market Brief Q3 2009 ENGSavills - Ha Noi Market Brief Q3 2009 ENG
Savills - Ha Noi Market Brief Q3 2009 ENGsavillsvietnam
 
Cincinnati OH Office Trends Q3 2011
Cincinnati OH Office Trends Q3 2011Cincinnati OH Office Trends Q3 2011
Cincinnati OH Office Trends Q3 2011colliersohio
 
Industrial re a4 2010
Industrial re a4 2010Industrial re a4 2010
Industrial re a4 2010Translinked
 
2Q2011 Miami Marketview Report
2Q2011 Miami Marketview Report2Q2011 Miami Marketview Report
2Q2011 Miami Marketview Reportelsantos
 
National Office Highlight - Q1 2012
National Office Highlight - Q1 2012National Office Highlight - Q1 2012
National Office Highlight - Q1 2012Jeff Tolrud
 
North American Office Highlights Q1 2012
North American Office Highlights Q1 2012North American Office Highlights Q1 2012
North American Office Highlights Q1 2012Coy Davidson
 
Savills - Office Market Report - Barcelona - Q3 2011
Savills - Office Market Report - Barcelona - Q3 2011Savills - Office Market Report - Barcelona - Q3 2011
Savills - Office Market Report - Barcelona - Q3 2011Eusebi Carles Pastor
 
Corporate occupier conditions - Europe
Corporate occupier conditions - EuropeCorporate occupier conditions - Europe
Corporate occupier conditions - EuropeColin Harrop
 
scana Presentation-Q4-2008_tcm10-227202
scana  Presentation-Q4-2008_tcm10-227202scana  Presentation-Q4-2008_tcm10-227202
scana Presentation-Q4-2008_tcm10-227202finance50
 
Cbre dubai market view q1 2010
Cbre  dubai market view q1 2010Cbre  dubai market view q1 2010
Cbre dubai market view q1 2010asaidali
 
E M E A F P R M O S C O W O F F I C E S M V H1 09
E M E A  F P R  M O S C O W  O F F I C E S  M V  H1 09E M E A  F P R  M O S C O W  O F F I C E S  M V  H1 09
E M E A F P R M O S C O W O F F I C E S M V H1 09Igor Bevzenko
 
North American Office Highlights 4Q 2010
North American Office Highlights 4Q 2010North American Office Highlights 4Q 2010
North American Office Highlights 4Q 2010Coy Davidson
 
Q2 2011 Houston Office Market Report
Q2 2011 Houston Office Market ReportQ2 2011 Houston Office Market Report
Q2 2011 Houston Office Market ReportCoy Davidson
 
Office Market Snapshot (3Q12)
Office Market Snapshot (3Q12)Office Market Snapshot (3Q12)
Office Market Snapshot (3Q12)jasonwtolliver
 
C&W - MONTREAL OFFICE MARKETBEAT - Q4 2012
C&W - MONTREAL  OFFICE MARKETBEAT - Q4 2012 C&W - MONTREAL  OFFICE MARKETBEAT - Q4 2012
C&W - MONTREAL OFFICE MARKETBEAT - Q4 2012 Guy Masse
 
Q2 2012 Columbus Office Market Trends
Q2 2012 Columbus Office Market TrendsQ2 2012 Columbus Office Market Trends
Q2 2012 Columbus Office Market Trendscolliersohio
 
Miami Minute 1Q2011
Miami Minute 1Q2011Miami Minute 1Q2011
Miami Minute 1Q2011elsantos
 

La actualidad más candente (20)

Savills - Ha Noi Market Brief Q3 2009 ENG
Savills - Ha Noi Market Brief Q3 2009 ENGSavills - Ha Noi Market Brief Q3 2009 ENG
Savills - Ha Noi Market Brief Q3 2009 ENG
 
Cincinnati OH Office Trends Q3 2011
Cincinnati OH Office Trends Q3 2011Cincinnati OH Office Trends Q3 2011
Cincinnati OH Office Trends Q3 2011
 
Industrial re a4 2010
Industrial re a4 2010Industrial re a4 2010
Industrial re a4 2010
 
2Q2011 Miami Marketview Report
2Q2011 Miami Marketview Report2Q2011 Miami Marketview Report
2Q2011 Miami Marketview Report
 
National Office Highlight - Q1 2012
National Office Highlight - Q1 2012National Office Highlight - Q1 2012
National Office Highlight - Q1 2012
 
North American Office Highlights Q1 2012
North American Office Highlights Q1 2012North American Office Highlights Q1 2012
North American Office Highlights Q1 2012
 
March Member Meeting -- Voices Matter: Economic Development & Land Use
March Member Meeting -- Voices Matter: Economic Development & Land UseMarch Member Meeting -- Voices Matter: Economic Development & Land Use
March Member Meeting -- Voices Matter: Economic Development & Land Use
 
Savills - Office Market Report - Barcelona - Q3 2011
Savills - Office Market Report - Barcelona - Q3 2011Savills - Office Market Report - Barcelona - Q3 2011
Savills - Office Market Report - Barcelona - Q3 2011
 
Corporate occupier conditions - Europe
Corporate occupier conditions - EuropeCorporate occupier conditions - Europe
Corporate occupier conditions - Europe
 
Chicago Suburbs 1 Q10
Chicago Suburbs 1 Q10Chicago Suburbs 1 Q10
Chicago Suburbs 1 Q10
 
scana Presentation-Q4-2008_tcm10-227202
scana  Presentation-Q4-2008_tcm10-227202scana  Presentation-Q4-2008_tcm10-227202
scana Presentation-Q4-2008_tcm10-227202
 
In The Market Apr12
In The Market Apr12In The Market Apr12
In The Market Apr12
 
Cbre dubai market view q1 2010
Cbre  dubai market view q1 2010Cbre  dubai market view q1 2010
Cbre dubai market view q1 2010
 
E M E A F P R M O S C O W O F F I C E S M V H1 09
E M E A  F P R  M O S C O W  O F F I C E S  M V  H1 09E M E A  F P R  M O S C O W  O F F I C E S  M V  H1 09
E M E A F P R M O S C O W O F F I C E S M V H1 09
 
North American Office Highlights 4Q 2010
North American Office Highlights 4Q 2010North American Office Highlights 4Q 2010
North American Office Highlights 4Q 2010
 
Q2 2011 Houston Office Market Report
Q2 2011 Houston Office Market ReportQ2 2011 Houston Office Market Report
Q2 2011 Houston Office Market Report
 
Office Market Snapshot (3Q12)
Office Market Snapshot (3Q12)Office Market Snapshot (3Q12)
Office Market Snapshot (3Q12)
 
C&W - MONTREAL OFFICE MARKETBEAT - Q4 2012
C&W - MONTREAL  OFFICE MARKETBEAT - Q4 2012 C&W - MONTREAL  OFFICE MARKETBEAT - Q4 2012
C&W - MONTREAL OFFICE MARKETBEAT - Q4 2012
 
Q2 2012 Columbus Office Market Trends
Q2 2012 Columbus Office Market TrendsQ2 2012 Columbus Office Market Trends
Q2 2012 Columbus Office Market Trends
 
Miami Minute 1Q2011
Miami Minute 1Q2011Miami Minute 1Q2011
Miami Minute 1Q2011
 

Destacado

TDL & Exports Regional Intermediary Design II
TDL & Exports Regional Intermediary Design IITDL & Exports Regional Intermediary Design II
TDL & Exports Regional Intermediary Design IITranslinked
 
INVITACIÓN SIMA 2009
INVITACIÓN SIMA 2009INVITACIÓN SIMA 2009
INVITACIÓN SIMA 2009guestf4a7e5e
 
TRILLIUM REPORT 2009 [Article]
TRILLIUM REPORT 2009 [Article]TRILLIUM REPORT 2009 [Article]
TRILLIUM REPORT 2009 [Article]ROSEMARY DECAIRES
 
Taming the Waves: Understanding digital practice at scale, ALT-C 2014
Taming the Waves: Understanding digital practice at scale, ALT-C 2014Taming the Waves: Understanding digital practice at scale, ALT-C 2014
Taming the Waves: Understanding digital practice at scale, ALT-C 2014Sarah Horrigan-Fullard
 

Destacado (6)

TDL & Exports Regional Intermediary Design II
TDL & Exports Regional Intermediary Design IITDL & Exports Regional Intermediary Design II
TDL & Exports Regional Intermediary Design II
 
Mike L
Mike LMike L
Mike L
 
INVITACIÓN SIMA 2009
INVITACIÓN SIMA 2009INVITACIÓN SIMA 2009
INVITACIÓN SIMA 2009
 
TRILLIUM REPORT 2009 [Article]
TRILLIUM REPORT 2009 [Article]TRILLIUM REPORT 2009 [Article]
TRILLIUM REPORT 2009 [Article]
 
1
11
1
 
Taming the Waves: Understanding digital practice at scale, ALT-C 2014
Taming the Waves: Understanding digital practice at scale, ALT-C 2014Taming the Waves: Understanding digital practice at scale, ALT-C 2014
Taming the Waves: Understanding digital practice at scale, ALT-C 2014
 

Similar a Office real estate a4 2010

Columbus OH Industrial Trends Q3 2011
Columbus OH Industrial Trends Q3 2011Columbus OH Industrial Trends Q3 2011
Columbus OH Industrial Trends Q3 2011colliersohio
 
North American Office Highlights Q4-12
North American Office Highlights Q4-12North American Office Highlights Q4-12
North American Office Highlights Q4-12Coy Davidson
 
North American Industrial Highlights 4Q 2010
North American Industrial Highlights 4Q 2010North American Industrial Highlights 4Q 2010
North American Industrial Highlights 4Q 2010Coy Davidson
 
Q1 2012 - Columbus Industrial
Q1 2012 - Columbus IndustrialQ1 2012 - Columbus Industrial
Q1 2012 - Columbus Industrialcolliersohio
 
North American Office highlights 2Q 2012
North American Office highlights 2Q 2012North American Office highlights 2Q 2012
North American Office highlights 2Q 2012Coy Davidson
 
Q12011 Columbus Office Market Report
Q12011 Columbus Office Market ReportQ12011 Columbus Office Market Report
Q12011 Columbus Office Market Reportcolliersohio
 
Gta condo market bubble that didn't burst
Gta condo market   bubble that didn't burstGta condo market   bubble that didn't burst
Gta condo market bubble that didn't burstHarish Maraj
 
Cincinnati OH Industrial Trends Q3 2011
Cincinnati OH Industrial Trends Q3 2011Cincinnati OH Industrial Trends Q3 2011
Cincinnati OH Industrial Trends Q3 2011colliersohio
 
Q32011 Cincinnati Industrial Market Report
Q32011 Cincinnati Industrial Market ReportQ32011 Cincinnati Industrial Market Report
Q32011 Cincinnati Industrial Market ReportChristieGraver
 
Q2 2010 presentation
Q2 2010 presentationQ2 2010 presentation
Q2 2010 presentationTele2
 
Colliers International: Retail Highlights Fall 2010
Colliers International: Retail Highlights Fall 2010Colliers International: Retail Highlights Fall 2010
Colliers International: Retail Highlights Fall 2010Coy Davidson
 
Suburban Maryland 3Q12 Office Snapshot
Suburban Maryland 3Q12 Office SnapshotSuburban Maryland 3Q12 Office Snapshot
Suburban Maryland 3Q12 Office Snapshotkottmeier
 
2012 q2 tampa bay office market report
2012 q2 tampa bay office market report2012 q2 tampa bay office market report
2012 q2 tampa bay office market reportJeff Tolrud
 
Metrolinx - Intro to Regional Planning in the GTA
Metrolinx - Intro to Regional Planning in the GTAMetrolinx - Intro to Regional Planning in the GTA
Metrolinx - Intro to Regional Planning in the GTAjeff_ranson
 
DC 3Q12 Office Snapshot
DC 3Q12 Office SnapshotDC 3Q12 Office Snapshot
DC 3Q12 Office Snapshotkottmeier
 
North American Office Highlights 4Q 2011
North American Office Highlights 4Q 2011North American Office Highlights 4Q 2011
North American Office Highlights 4Q 2011Coy Davidson
 
Q4 2011 - Cincinnati Office
Q4 2011 - Cincinnati OfficeQ4 2011 - Cincinnati Office
Q4 2011 - Cincinnati Officecolliersohio
 
US Industrial Highlights Q3 2011
US Industrial Highlights Q3 2011US Industrial Highlights Q3 2011
US Industrial Highlights Q3 2011colliersohio
 

Similar a Office real estate a4 2010 (20)

Columbus OH Industrial Trends Q3 2011
Columbus OH Industrial Trends Q3 2011Columbus OH Industrial Trends Q3 2011
Columbus OH Industrial Trends Q3 2011
 
Rent De-Control
Rent De-Control Rent De-Control
Rent De-Control
 
North American Office Highlights Q4-12
North American Office Highlights Q4-12North American Office Highlights Q4-12
North American Office Highlights Q4-12
 
North American Industrial Highlights 4Q 2010
North American Industrial Highlights 4Q 2010North American Industrial Highlights 4Q 2010
North American Industrial Highlights 4Q 2010
 
Q1 2012 - Columbus Industrial
Q1 2012 - Columbus IndustrialQ1 2012 - Columbus Industrial
Q1 2012 - Columbus Industrial
 
North American Office highlights 2Q 2012
North American Office highlights 2Q 2012North American Office highlights 2Q 2012
North American Office highlights 2Q 2012
 
Q12011 Columbus Office Market Report
Q12011 Columbus Office Market ReportQ12011 Columbus Office Market Report
Q12011 Columbus Office Market Report
 
Gta condo market bubble that didn't burst
Gta condo market   bubble that didn't burstGta condo market   bubble that didn't burst
Gta condo market bubble that didn't burst
 
Cincinnati OH Industrial Trends Q3 2011
Cincinnati OH Industrial Trends Q3 2011Cincinnati OH Industrial Trends Q3 2011
Cincinnati OH Industrial Trends Q3 2011
 
Q32011 Cincinnati Industrial Market Report
Q32011 Cincinnati Industrial Market ReportQ32011 Cincinnati Industrial Market Report
Q32011 Cincinnati Industrial Market Report
 
Q2 2010 presentation
Q2 2010 presentationQ2 2010 presentation
Q2 2010 presentation
 
Colliers International: Retail Highlights Fall 2010
Colliers International: Retail Highlights Fall 2010Colliers International: Retail Highlights Fall 2010
Colliers International: Retail Highlights Fall 2010
 
Suburban Maryland 3Q12 Office Snapshot
Suburban Maryland 3Q12 Office SnapshotSuburban Maryland 3Q12 Office Snapshot
Suburban Maryland 3Q12 Office Snapshot
 
2012 q2 tampa bay office market report
2012 q2 tampa bay office market report2012 q2 tampa bay office market report
2012 q2 tampa bay office market report
 
Metrolinx - Intro to Regional Planning in the GTA
Metrolinx - Intro to Regional Planning in the GTAMetrolinx - Intro to Regional Planning in the GTA
Metrolinx - Intro to Regional Planning in the GTA
 
DC 3Q12 Office Snapshot
DC 3Q12 Office SnapshotDC 3Q12 Office Snapshot
DC 3Q12 Office Snapshot
 
North American Office Highlights 4Q 2011
North American Office Highlights 4Q 2011North American Office Highlights 4Q 2011
North American Office Highlights 4Q 2011
 
Q4 2011 - Cincinnati Office
Q4 2011 - Cincinnati OfficeQ4 2011 - Cincinnati Office
Q4 2011 - Cincinnati Office
 
N. Barry Lyons Consulting; 2012 Update for New Construction Condos in Toronto.
N. Barry Lyons Consulting; 2012 Update for New Construction Condos in Toronto.N. Barry Lyons Consulting; 2012 Update for New Construction Condos in Toronto.
N. Barry Lyons Consulting; 2012 Update for New Construction Condos in Toronto.
 
US Industrial Highlights Q3 2011
US Industrial Highlights Q3 2011US Industrial Highlights Q3 2011
US Industrial Highlights Q3 2011
 

Más de Translinked

Status of telecom_competition_report_2012_387881_7
Status of telecom_competition_report_2012_387881_7Status of telecom_competition_report_2012_387881_7
Status of telecom_competition_report_2012_387881_7Translinked
 
The Positive Story of Michigan's Workforce
The Positive Story of Michigan's WorkforceThe Positive Story of Michigan's Workforce
The Positive Story of Michigan's WorkforceTranslinked
 
Michigan: Champion of the Global Economy
Michigan: Champion of the Global EconomyMichigan: Champion of the Global Economy
Michigan: Champion of the Global EconomyTranslinked
 
Detroit Region Transportation, Distribution and Logistics Report on Progress
Detroit Region Transportation, Distribution and Logistics Report on ProgressDetroit Region Transportation, Distribution and Logistics Report on Progress
Detroit Region Transportation, Distribution and Logistics Report on ProgressTranslinked
 
Detroit Region Transportation, Distribution and Logistics Talent Initiative
Detroit Region Transportation, Distribution and Logistics Talent InitiativeDetroit Region Transportation, Distribution and Logistics Talent Initiative
Detroit Region Transportation, Distribution and Logistics Talent InitiativeTranslinked
 
Translinked - Detroit's Regional Supply Chain Value Proposition Presentation
Translinked - Detroit's Regional Supply Chain Value Proposition PresentationTranslinked - Detroit's Regional Supply Chain Value Proposition Presentation
Translinked - Detroit's Regional Supply Chain Value Proposition PresentationTranslinked
 
Translinked Regional Freight Study
Translinked Regional Freight StudyTranslinked Regional Freight Study
Translinked Regional Freight StudyTranslinked
 
Translinked Regional Freight Study Executive Summary
Translinked Regional Freight Study Executive SummaryTranslinked Regional Freight Study Executive Summary
Translinked Regional Freight Study Executive SummaryTranslinked
 
Translinked 75 Day Plan Results
Translinked 75 Day Plan ResultsTranslinked 75 Day Plan Results
Translinked 75 Day Plan ResultsTranslinked
 
The Detroit Region's Opportunity: Creating Jobs by Developing the Transportat...
The Detroit Region's Opportunity: Creating Jobs by Developing the Transportat...The Detroit Region's Opportunity: Creating Jobs by Developing the Transportat...
The Detroit Region's Opportunity: Creating Jobs by Developing the Transportat...Translinked
 
Translinked Project Map
Translinked Project MapTranslinked Project Map
Translinked Project MapTranslinked
 
TDL & Exports Regional Intermediary Design III
TDL & Exports Regional Intermediary Design IIITDL & Exports Regional Intermediary Design III
TDL & Exports Regional Intermediary Design IIITranslinked
 
TDL & Exports Regional Intermediary Design
TDL & Exports Regional Intermediary DesignTDL & Exports Regional Intermediary Design
TDL & Exports Regional Intermediary DesignTranslinked
 

Más de Translinked (13)

Status of telecom_competition_report_2012_387881_7
Status of telecom_competition_report_2012_387881_7Status of telecom_competition_report_2012_387881_7
Status of telecom_competition_report_2012_387881_7
 
The Positive Story of Michigan's Workforce
The Positive Story of Michigan's WorkforceThe Positive Story of Michigan's Workforce
The Positive Story of Michigan's Workforce
 
Michigan: Champion of the Global Economy
Michigan: Champion of the Global EconomyMichigan: Champion of the Global Economy
Michigan: Champion of the Global Economy
 
Detroit Region Transportation, Distribution and Logistics Report on Progress
Detroit Region Transportation, Distribution and Logistics Report on ProgressDetroit Region Transportation, Distribution and Logistics Report on Progress
Detroit Region Transportation, Distribution and Logistics Report on Progress
 
Detroit Region Transportation, Distribution and Logistics Talent Initiative
Detroit Region Transportation, Distribution and Logistics Talent InitiativeDetroit Region Transportation, Distribution and Logistics Talent Initiative
Detroit Region Transportation, Distribution and Logistics Talent Initiative
 
Translinked - Detroit's Regional Supply Chain Value Proposition Presentation
Translinked - Detroit's Regional Supply Chain Value Proposition PresentationTranslinked - Detroit's Regional Supply Chain Value Proposition Presentation
Translinked - Detroit's Regional Supply Chain Value Proposition Presentation
 
Translinked Regional Freight Study
Translinked Regional Freight StudyTranslinked Regional Freight Study
Translinked Regional Freight Study
 
Translinked Regional Freight Study Executive Summary
Translinked Regional Freight Study Executive SummaryTranslinked Regional Freight Study Executive Summary
Translinked Regional Freight Study Executive Summary
 
Translinked 75 Day Plan Results
Translinked 75 Day Plan ResultsTranslinked 75 Day Plan Results
Translinked 75 Day Plan Results
 
The Detroit Region's Opportunity: Creating Jobs by Developing the Transportat...
The Detroit Region's Opportunity: Creating Jobs by Developing the Transportat...The Detroit Region's Opportunity: Creating Jobs by Developing the Transportat...
The Detroit Region's Opportunity: Creating Jobs by Developing the Transportat...
 
Translinked Project Map
Translinked Project MapTranslinked Project Map
Translinked Project Map
 
TDL & Exports Regional Intermediary Design III
TDL & Exports Regional Intermediary Design IIITDL & Exports Regional Intermediary Design III
TDL & Exports Regional Intermediary Design III
 
TDL & Exports Regional Intermediary Design
TDL & Exports Regional Intermediary DesignTDL & Exports Regional Intermediary Design
TDL & Exports Regional Intermediary Design
 

Último

Call Girls In DLf Gurgaon ➥99902@11544 ( Best price)100% Genuine Escort In 24...
Call Girls In DLf Gurgaon ➥99902@11544 ( Best price)100% Genuine Escort In 24...Call Girls In DLf Gurgaon ➥99902@11544 ( Best price)100% Genuine Escort In 24...
Call Girls In DLf Gurgaon ➥99902@11544 ( Best price)100% Genuine Escort In 24...lizamodels9
 
Pharma Works Profile of Karan Communications
Pharma Works Profile of Karan CommunicationsPharma Works Profile of Karan Communications
Pharma Works Profile of Karan Communicationskarancommunications
 
The Path to Product Excellence: Avoiding Common Pitfalls and Enhancing Commun...
The Path to Product Excellence: Avoiding Common Pitfalls and Enhancing Commun...The Path to Product Excellence: Avoiding Common Pitfalls and Enhancing Commun...
The Path to Product Excellence: Avoiding Common Pitfalls and Enhancing Commun...Aggregage
 
Cracking the Cultural Competence Code.pptx
Cracking the Cultural Competence Code.pptxCracking the Cultural Competence Code.pptx
Cracking the Cultural Competence Code.pptxWorkforce Group
 
Call Girls Ludhiana Just Call 98765-12871 Top Class Call Girl Service Available
Call Girls Ludhiana Just Call 98765-12871 Top Class Call Girl Service AvailableCall Girls Ludhiana Just Call 98765-12871 Top Class Call Girl Service Available
Call Girls Ludhiana Just Call 98765-12871 Top Class Call Girl Service AvailableSeo
 
Mondelez State of Snacking and Future Trends 2023
Mondelez State of Snacking and Future Trends 2023Mondelez State of Snacking and Future Trends 2023
Mondelez State of Snacking and Future Trends 2023Neil Kimberley
 
Call Girls Kengeri Satellite Town Just Call 👗 7737669865 👗 Top Class Call Gir...
Call Girls Kengeri Satellite Town Just Call 👗 7737669865 👗 Top Class Call Gir...Call Girls Kengeri Satellite Town Just Call 👗 7737669865 👗 Top Class Call Gir...
Call Girls Kengeri Satellite Town Just Call 👗 7737669865 👗 Top Class Call Gir...amitlee9823
 
Phases of Negotiation .pptx
 Phases of Negotiation .pptx Phases of Negotiation .pptx
Phases of Negotiation .pptxnandhinijagan9867
 
FULL ENJOY Call Girls In Majnu Ka Tilla, Delhi Contact Us 8377877756
FULL ENJOY Call Girls In Majnu Ka Tilla, Delhi Contact Us 8377877756FULL ENJOY Call Girls In Majnu Ka Tilla, Delhi Contact Us 8377877756
FULL ENJOY Call Girls In Majnu Ka Tilla, Delhi Contact Us 8377877756dollysharma2066
 
Insurers' journeys to build a mastery in the IoT usage
Insurers' journeys to build a mastery in the IoT usageInsurers' journeys to build a mastery in the IoT usage
Insurers' journeys to build a mastery in the IoT usageMatteo Carbone
 
Call Girls Electronic City Just Call 👗 7737669865 👗 Top Class Call Girl Servi...
Call Girls Electronic City Just Call 👗 7737669865 👗 Top Class Call Girl Servi...Call Girls Electronic City Just Call 👗 7737669865 👗 Top Class Call Girl Servi...
Call Girls Electronic City Just Call 👗 7737669865 👗 Top Class Call Girl Servi...amitlee9823
 
Call Girls Pune Just Call 9907093804 Top Class Call Girl Service Available
Call Girls Pune Just Call 9907093804 Top Class Call Girl Service AvailableCall Girls Pune Just Call 9907093804 Top Class Call Girl Service Available
Call Girls Pune Just Call 9907093804 Top Class Call Girl Service AvailableDipal Arora
 
B.COM Unit – 4 ( CORPORATE SOCIAL RESPONSIBILITY ( CSR ).pptx
B.COM Unit – 4 ( CORPORATE SOCIAL RESPONSIBILITY ( CSR ).pptxB.COM Unit – 4 ( CORPORATE SOCIAL RESPONSIBILITY ( CSR ).pptx
B.COM Unit – 4 ( CORPORATE SOCIAL RESPONSIBILITY ( CSR ).pptxpriyanshujha201
 
Call Girls in Delhi, Escort Service Available 24x7 in Delhi 959961-/-3876
Call Girls in Delhi, Escort Service Available 24x7 in Delhi 959961-/-3876Call Girls in Delhi, Escort Service Available 24x7 in Delhi 959961-/-3876
Call Girls in Delhi, Escort Service Available 24x7 in Delhi 959961-/-3876dlhescort
 
Quick Doctor In Kuwait +2773`7758`557 Kuwait Doha Qatar Dubai Abu Dhabi Sharj...
Quick Doctor In Kuwait +2773`7758`557 Kuwait Doha Qatar Dubai Abu Dhabi Sharj...Quick Doctor In Kuwait +2773`7758`557 Kuwait Doha Qatar Dubai Abu Dhabi Sharj...
Quick Doctor In Kuwait +2773`7758`557 Kuwait Doha Qatar Dubai Abu Dhabi Sharj...daisycvs
 
Organizational Transformation Lead with Culture
Organizational Transformation Lead with CultureOrganizational Transformation Lead with Culture
Organizational Transformation Lead with CultureSeta Wicaksana
 
Call Girls Service In Old Town Dubai ((0551707352)) Old Town Dubai Call Girl ...
Call Girls Service In Old Town Dubai ((0551707352)) Old Town Dubai Call Girl ...Call Girls Service In Old Town Dubai ((0551707352)) Old Town Dubai Call Girl ...
Call Girls Service In Old Town Dubai ((0551707352)) Old Town Dubai Call Girl ...allensay1
 
Russian Call Girls In Gurgaon ❤️8448577510 ⊹Best Escorts Service In 24/7 Delh...
Russian Call Girls In Gurgaon ❤️8448577510 ⊹Best Escorts Service In 24/7 Delh...Russian Call Girls In Gurgaon ❤️8448577510 ⊹Best Escorts Service In 24/7 Delh...
Russian Call Girls In Gurgaon ❤️8448577510 ⊹Best Escorts Service In 24/7 Delh...lizamodels9
 

Último (20)

Call Girls In DLf Gurgaon ➥99902@11544 ( Best price)100% Genuine Escort In 24...
Call Girls In DLf Gurgaon ➥99902@11544 ( Best price)100% Genuine Escort In 24...Call Girls In DLf Gurgaon ➥99902@11544 ( Best price)100% Genuine Escort In 24...
Call Girls In DLf Gurgaon ➥99902@11544 ( Best price)100% Genuine Escort In 24...
 
Pharma Works Profile of Karan Communications
Pharma Works Profile of Karan CommunicationsPharma Works Profile of Karan Communications
Pharma Works Profile of Karan Communications
 
Forklift Operations: Safety through Cartoons
Forklift Operations: Safety through CartoonsForklift Operations: Safety through Cartoons
Forklift Operations: Safety through Cartoons
 
The Path to Product Excellence: Avoiding Common Pitfalls and Enhancing Commun...
The Path to Product Excellence: Avoiding Common Pitfalls and Enhancing Commun...The Path to Product Excellence: Avoiding Common Pitfalls and Enhancing Commun...
The Path to Product Excellence: Avoiding Common Pitfalls and Enhancing Commun...
 
Cracking the Cultural Competence Code.pptx
Cracking the Cultural Competence Code.pptxCracking the Cultural Competence Code.pptx
Cracking the Cultural Competence Code.pptx
 
Call Girls Ludhiana Just Call 98765-12871 Top Class Call Girl Service Available
Call Girls Ludhiana Just Call 98765-12871 Top Class Call Girl Service AvailableCall Girls Ludhiana Just Call 98765-12871 Top Class Call Girl Service Available
Call Girls Ludhiana Just Call 98765-12871 Top Class Call Girl Service Available
 
Mondelez State of Snacking and Future Trends 2023
Mondelez State of Snacking and Future Trends 2023Mondelez State of Snacking and Future Trends 2023
Mondelez State of Snacking and Future Trends 2023
 
Call Girls Kengeri Satellite Town Just Call 👗 7737669865 👗 Top Class Call Gir...
Call Girls Kengeri Satellite Town Just Call 👗 7737669865 👗 Top Class Call Gir...Call Girls Kengeri Satellite Town Just Call 👗 7737669865 👗 Top Class Call Gir...
Call Girls Kengeri Satellite Town Just Call 👗 7737669865 👗 Top Class Call Gir...
 
Phases of Negotiation .pptx
 Phases of Negotiation .pptx Phases of Negotiation .pptx
Phases of Negotiation .pptx
 
FULL ENJOY Call Girls In Majnu Ka Tilla, Delhi Contact Us 8377877756
FULL ENJOY Call Girls In Majnu Ka Tilla, Delhi Contact Us 8377877756FULL ENJOY Call Girls In Majnu Ka Tilla, Delhi Contact Us 8377877756
FULL ENJOY Call Girls In Majnu Ka Tilla, Delhi Contact Us 8377877756
 
Insurers' journeys to build a mastery in the IoT usage
Insurers' journeys to build a mastery in the IoT usageInsurers' journeys to build a mastery in the IoT usage
Insurers' journeys to build a mastery in the IoT usage
 
VVVIP Call Girls In Greater Kailash ➡️ Delhi ➡️ 9999965857 🚀 No Advance 24HRS...
VVVIP Call Girls In Greater Kailash ➡️ Delhi ➡️ 9999965857 🚀 No Advance 24HRS...VVVIP Call Girls In Greater Kailash ➡️ Delhi ➡️ 9999965857 🚀 No Advance 24HRS...
VVVIP Call Girls In Greater Kailash ➡️ Delhi ➡️ 9999965857 🚀 No Advance 24HRS...
 
Call Girls Electronic City Just Call 👗 7737669865 👗 Top Class Call Girl Servi...
Call Girls Electronic City Just Call 👗 7737669865 👗 Top Class Call Girl Servi...Call Girls Electronic City Just Call 👗 7737669865 👗 Top Class Call Girl Servi...
Call Girls Electronic City Just Call 👗 7737669865 👗 Top Class Call Girl Servi...
 
Call Girls Pune Just Call 9907093804 Top Class Call Girl Service Available
Call Girls Pune Just Call 9907093804 Top Class Call Girl Service AvailableCall Girls Pune Just Call 9907093804 Top Class Call Girl Service Available
Call Girls Pune Just Call 9907093804 Top Class Call Girl Service Available
 
B.COM Unit – 4 ( CORPORATE SOCIAL RESPONSIBILITY ( CSR ).pptx
B.COM Unit – 4 ( CORPORATE SOCIAL RESPONSIBILITY ( CSR ).pptxB.COM Unit – 4 ( CORPORATE SOCIAL RESPONSIBILITY ( CSR ).pptx
B.COM Unit – 4 ( CORPORATE SOCIAL RESPONSIBILITY ( CSR ).pptx
 
Call Girls in Delhi, Escort Service Available 24x7 in Delhi 959961-/-3876
Call Girls in Delhi, Escort Service Available 24x7 in Delhi 959961-/-3876Call Girls in Delhi, Escort Service Available 24x7 in Delhi 959961-/-3876
Call Girls in Delhi, Escort Service Available 24x7 in Delhi 959961-/-3876
 
Quick Doctor In Kuwait +2773`7758`557 Kuwait Doha Qatar Dubai Abu Dhabi Sharj...
Quick Doctor In Kuwait +2773`7758`557 Kuwait Doha Qatar Dubai Abu Dhabi Sharj...Quick Doctor In Kuwait +2773`7758`557 Kuwait Doha Qatar Dubai Abu Dhabi Sharj...
Quick Doctor In Kuwait +2773`7758`557 Kuwait Doha Qatar Dubai Abu Dhabi Sharj...
 
Organizational Transformation Lead with Culture
Organizational Transformation Lead with CultureOrganizational Transformation Lead with Culture
Organizational Transformation Lead with Culture
 
Call Girls Service In Old Town Dubai ((0551707352)) Old Town Dubai Call Girl ...
Call Girls Service In Old Town Dubai ((0551707352)) Old Town Dubai Call Girl ...Call Girls Service In Old Town Dubai ((0551707352)) Old Town Dubai Call Girl ...
Call Girls Service In Old Town Dubai ((0551707352)) Old Town Dubai Call Girl ...
 
Russian Call Girls In Gurgaon ❤️8448577510 ⊹Best Escorts Service In 24/7 Delh...
Russian Call Girls In Gurgaon ❤️8448577510 ⊹Best Escorts Service In 24/7 Delh...Russian Call Girls In Gurgaon ❤️8448577510 ⊹Best Escorts Service In 24/7 Delh...
Russian Call Girls In Gurgaon ❤️8448577510 ⊹Best Escorts Service In 24/7 Delh...
 

Office real estate a4 2010

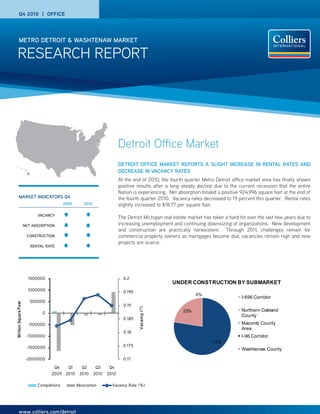
  • 1. Q4 2010 | OFFICE METRO DETROIT & WASHTENAW MARKET RESEARCH REPORT Detroit Office Market DETROIT OFFICE MARKET REPORTS A SLIGHT INCREASE IN RENTAL RATES AND DECREASE IN VACANCY RATES At the end of 2010, the fourth quarter Metro Detroit office market area has finally shown positive results after a long steady decline due to the current recession that the entire Nation is experiencing. Net absorption totaled a positive 924,996 square feet at the end of MARKET INDICATORS Q4 the fourth quarter 2010. Vacancy rates decreased to 19 percent this quarter. Rental rates 2009 2010 slightly increased to $18.77 per square foot. VACANCY The Detroit Michigan real estate market has taken a hard hit over the last few years due to NET ABSORPTION increasing unemployment and continuing downsizing of organizations. New development and construction are practically nonexistent. Through 2011, challenges remain for CONSTRUCTION commercial property owners as mortgages become due, vacancies remain high and new projects are scarce. RENTAL RATE 1500000 0.2 UNDER CONSTRUCTION BY SUBMARKET 1000000 0.195 0% I-696 Corridor 500000 M illion Square Feet 0.19 V acancy (^) 23% Northern Oakland 0 County 0.185 -500000 Macomb County Area 0.18 -1000000 I-96 Corridor 77% -1500000 0.175 Washtenaw County -2000000 0.17 Q4 Q1 Q2 Q3 Q4 2009 2010 2010 2010 2010 Completions Absorption Vacancy Rate (%) www.colliers.com/detroit
  • 2. RESEARCH REPORT | Q4 2010 | OFFICE | DETROIT RENTAL RATES Local landlords must continue to offer Total office inventory in the Detroit market A building’s vacancy is the major factor in aggressive incentives on both new leases area amounted to 164,292,884 Square feet in its rental rate rather than the overall and renewals. 2,940 properties. performance of a market sector. Rates range from $12.04 to $25.58. CONSTRUCTION Total year to date net absorption at the end of 2010 totaled a positive 223,249 square feet. Fourth quarter delivered any additional The Metro Detroit’s average rental rate 44,500 square feet of office product to the increased since third quarter 2010 and market. All Class B type and located in the stands at $18.77 per square foot. This Oakland County Central Submarket. represented a $0.33 decrease from 12 months ago. Construction activity decreased this quarter compared to third quarter. With 8,885 Currently, the average rental rate in fourth square feet of office space reported under quarter for Class A was $22.49, Class B construction, mainly concentrated in the was $18.17 and Class C was at $14.38. Suburban market and majority Class B type Detroit’s Downtown average asking rental property. rate decreased $0.06 to $18.45 while a $0.04 increase to $18.70 reported in the continued on page 4 suburban markets. SALES ACTIVITY PROPERTY ADDRESS CITY SALE DATE SALE PRICE SIZE PRICE PER SF 333 E Jefferson Ave (3 Properties) Detroit 12/2/2010 37,800,000 550,094 401-411 S Old Woodward Ave Birmingham 11/12/2010 15,300,000 250,000 61.2 38525 Woodward Ave Bloomfield Hills 12/17/2010 7,000,000 63,186 110.78 43630 Hayes Rd (5 Properties) 12/29/2010 6,525,000 98,830 66.02 17199 N Laurel Park Dr Livonia 12/23/2010 6,000,000 124,000 48.39 1349 S Rochester Rd Rochester Hills 12/22/2010 2,825,000 64,000 44.14 500 Avis Dr Ann Arbor 10/29/2010 2,000,000 27,160 73.64 6001 N Adams Rd Bloomfield Hills 12/28/2010 2,000,000 67,484 29.64 29621 Northwestern Hwy Southfield 11/5/2010 1,875,000 26,500 70.75 800-900 W University Blvd Rochester 12/3/2010 1,500,000 40,400 37.13 6050 Greenfield Rd Dearborn 11/5/2010 1,434,532 15,100 95 17000 Executive Plaza Dr Dearborn 11/30/2010 1,250,000 60,000 20.83 LEASE ACTIVITY BUILDING NAME SUBMARKET TENANT SIZE SF 28333 Telegraph Rd. Southfield Int. AutomotiveComponentsGroup 113,894 401 - 407 E. Liberty St. Washtenaw Google 81,292 100 Galleria Southfield NA 41,865 2800 Livernois Rd. Troy Carlson Marketing 36,720 P. 2 | COLLIERS INTERNATIONAL
  • 3. RESEARCH REPORT | Q4 2010 | OFFICE | DETROIT SUBLEASE NET ABSORPTION U/C & PROPOSED AVG EXISTING PROPERTIES DIRECT VACANCY VACANCY TOTAL VACANCY - SF NEW SUPPLY - SF - SF RENT Total Inventory 4Q Current Under Class Bldgs. Sq. Ft. Sq. Ft. Rate Sq. Ft. Rate Sq. Ft. Rate Period YTD Period YTD Constr. Proposed Rate DOWNTOWN MARKETS Detroit CBD and New Center Area A 24 11,563,170 2,012,289 17.4% 2,704 0.0% 2,014,993 17.4% 815 (282,975) 0 0 0 194,604 $23.00 B 96 15,919,800 2,574,908 16.2% 45,831 0.3% 2,620,739 16.5% 7,362 (249,448) 0 0 0 0 $16.89 C 50 2,963,362 545,473 18.4% 0 0.0% 545,473 18.4% 42,721 83,915 0 0 0 0 $15.81 All 170 30,446,332 5,132,670 16.9% 48,535 0.2% 5,181,206 17.0% 50,898 (448,508) 0 0 0 194,604 $19.11 Outer Detroit, Dearborn, and Downriver, Airport, The Pointes A 26 5,669,774 333,750 5.9% 15,060 0.3% 348,810 6.2% 116,768 139,960 $21.21 B 179 10,020,178 2,373,361 23.7% 57,401 0.6% 2,430,762 24.3% 187,727 (39,426) 40,000 $18.67 C 165 5,910,157 924,731 15.6% 0 0.0% 924,731 15.6% 57,271 247,747 0 0 0 $12.04 All 370 21,600,109 3,631,842 16.8% 72,461 0.3% 3,704,303 17.1% 361,766 348,281 0 0 0 40,000 $17.52 DOWNTOWN TOTALS A 50 17,232,944 2,346,039 13.6% 17,764 0.1% 2,363,803 13.7% 117,583 (143,015) 0 0 0 194,604 $22.41 B 275 25,939,978 4,948,269 19.1% 103,232 0.4% 5,051,501 19.5% 195,089 (288,874) 0 0 0 40,000 $17.58 C 215 8,873,519 1,470,204 16.6% 0 0.0% 1,470,204 16.6% 99,992 331,662 0 0 0 0 $13.30 All 540 52,046,441 8,764,512 16.8% 120,996 0.2% 8,885,509 17.1% 412,664 (100,227) 0 0 0 234,604 $18.45 SUBURBAN MARKETS I-696 Corridor: Madison Heights, Royal Oak, Ferndale, Southfield A 26 6,173,667 1,339,889 21.7% 159,978 2.6% 1,499,867 24.3% 178 (39,725) 949,000 $20.97 B 229 15,225,304 3,299,200 21.7% 95,120 0.6% 3,394,320 22.3% 211,879 112,057 85,550 $17.47 C 172 5,012,512 691,164 13.8% 25,980 0.5% 717,144 14.3% 52,632 86,994 0 0 0 0 $13.92 All 427 26,411,483 5,330,253 20.2% 281,078 1.1% 5,611,332 21.2% 264,689 159,326 0 0 0 1,034,550 $17.61 Oakland County Central: Birmingham, Bloomfields, Troy A 46 7,461,835 1,681,745 22.5% 40,732 0.5% 1,722,477 23.1% (33,769) (191,536) 27,220 627,003 $21.20 B 263 14,099,756 4,506,191 32.0% 185,082 1.3% 4,691,273 33.3% (68,023) (91,459) 44,500 60,500 93,550 $19.21 C 90 2,208,549 315,901 14.3% 47,577 2.2% 363,478 16.5% 26,476 (12,792) 0 0 $15.83 All 399 23,770,140 6,503,837 27.4% 273,391 1.2% 6,777,229 28.5% (75,316) (295,787) 44,500 87,720 0 720,553 $19.52 Northern Oakland County: Rochester, Auburn Hills, Clarkston, Lake Orion, Pontiac A 16 6,334,686 207,769 3.3% 22,497 0.4% 230,266 3.6% 8,563 31,130 419,852 $23.99 B 140 6,963,072 2,561,828 36.8% 60,301 0.9% 2,622,129 37.7% 28,099 25,120 293,464 $17.80 C 81 2,557,867 487,059 19.0% 0 0.0% 487,059 19.0% 14,709 327 0 0 0 $15.76 All 237 15,855,625 3,256,656 20.5% 82,798 0.5% 3,339,455 21.1% 51,371 56,577 0 0 0 713,316 $19.94 Macomb County Area: Warren, Sterling Heights, Shelby Twp., Roseville, Clinton Twp., Saint Clair Shores, Macomb Twp. A 11 611,896 185,039 30.2% 0 0.0% 185,039 30.2% 1,456 53,567 70,327 $23.59 B 255 6,379,069 1,104,675 17.3% 8,669 0.1% 1,113,344 17.5% (7,959) 8,545 212,002 $17.81 C 141 2,741,134 232,343 8.5% 3,600 0.1% 235,943 8.6% 11,357 14,535 0 0 0 $13.34 All 407 9,732,099 1,522,057 15.6% 12,269 0.1% 1,534,327 15.8% 4,854 57,352 0 0 0 282,329 $16.91 I-96 Corridor: Novi, Howell, Brighton, South Lyon, Farmington A 30 3,470,040 604,692 17.4% 143,503 4.1% 748,195 21.6% (12,281) (45,875) 1,720,746 $23.10 B 263 10,066,754 1,280,684 12.7% 17,074 0.2% 1,297,758 12.9% 165,730 293,736 6,885 355,108 $19.22 C 90 1,780,694 270,569 15.2% 0 0.0% 270,569 15.2% (21,225) (50,037) 0 0 0 14,000 $17.15 All 383 15,317,488 2,155,945 14.1% 160,577 1.0% 2,316,522 15.1% 132,224 197,824 0 0 6,885 2,089,854 $19.86 I-275 Corridor: Livonia, Westland, Canton, Plymouth, Northville A 11 1,579,420 287,199 18.2% 4,655 0.3% 291,854 18.5% (20,697) (16,916) 100,000 $21.03 B 151 4,771,134 887,933 18.6% 15,489 0.3% 903,422 18.9% 21,181 44,202 251,204 $17.78 C 75 2,284,063 308,803 13.5% 0 0.0% 308,803 13.5% (3,231) (32,673) 0 0 0 $14.03 All 237 8,634,617 1,483,935 17.2% 20,144 0.2% 1,504,080 17.4% (2,747) (5,387) 0 0 0 351,204 $17.38 SUBURBAN TOTALS A 140 25,631,544 4,306,333 16.8% 371,365 1.4% 4,677,698 18.2% (56,550) (209,355) 0 27,220 0 3,886,928 $22.14 B 1,301 57,505,089 13,640,511 23.7% 381,735 0.7% 14,022,246 24.4% 350,907 372,906 44,500 60,500 6,885 1,290,878 $18.31 C 649 16,584,819 2,305,839 13.9% 77,157 0.5% 2,382,996 14.4% 80,718 6,354 0 0 0 14,000 $14.72 All 2,090 99,721,452 20,252,683 20.3% 830,257 0.8% 21,082,941 21.1% 375,075 169,905 44,500 87,720 6,885 5,191,806 $18.70 WASHTENAW COUNTY A 24 3,345,044 271,016 8.1% 1,156 0.0% 272,172 8.1% (17,155) (16,793) 0 806,381 $25.58 B 214 7,801,244 665,653 8.5% 41,425 0.5% 707,078 9.1% 152,228 178,069 0 0 2,000 267,127 $19.15 C 72 1,378,703 191,160 13.9% 0 0.0% 191,160 13.9% 2,184 (7,705) 0 0 $17.22 All 310 12,524,991 1,127,829 9.0% 42,581 0.3% 1,170,410 9.3% 137,257 153,571 0 0 2,000 1,073,508 $20.65 MARKET TOTALS – DOWNTOWN, SUBURBAN, AND WASHTENAW COUNTY A 214 46,209,532 6,923,388 15.0% 390,285 0.8% 7,313,673 15.8% 43,878 (369,163) 0 27,220 0 4,887,913 $22.49 B 1,790 91,246,311 19,254,433 21.1% 526,392 0.6% 19,780,825 21.7% 698,224 262,101 44,500 60,500 8,885 1,598,005 $18.17 C 936 26,837,041 3,967,203 14.8% 77,157 0.3% 4,044,360 15.1% 182,894 330,311 0 0 0 14,000 $14.38 All 2,940 164,292,884 30,145,024 18.3% 993,834 0.6% 31,138,860 19.0% 924,996 223,249 44,500 87,720 8,885 6,499,918 $18.77 QUARTERLY COMPARISON AND TOTALS Q410 2,940 164,292,884 30,145,024 18.3% 993,834 0.6% 31,138,860 19.0% 924,996 223,249 44,500 87,720 8,885 6,499,918 $18.77 Q310 2,911 163,189,957 30,709,526 18.8% 986,171 0.6% 31,695,699 19.4% 0 (701,747) 27,220 16,000 740,309 6,925,908 $18.75 Q210 2,891 162,710,814 30,323,377 18.6% 1,005,839 0.6% 31,329,218 19.3% 0 (612,530) 16,000 16,000 202,528 7,311,514 $18.98 Q110 2,931 168,406,862 29,844,859 17.7% 1,245,183 0.7% 31,090,044 18.5% (510,483) 0 0 149,709 7,764,636 $18.92 Q409 2,895 166,790,401 29,081,419 17.4% 1,346,110 0.8% 30,427,531 18.2% (2,830,949) 88,719 165,557 285,409 8,114,232 $19.10 Q309 2,843 163,465,688 27,428,354 16.8% 1,033,600 0.6% 28,461,956 17.4% 0 (1,191,121) 20,872 76,838 223,575 6,378,890 $19.20 Q209 2,819 161,069,549 27,376,284 17.0% 1,011,099 0.6% 28,387,385 17.6% 0 (654,896) 0 55,966 197,463 8,361,715 $19.38 Q109 2,824 161,898,822 27,658,991 17.1% 1,191,626 0.7% 28,850,619 17.8% (683,664) 55,966 55,966 228,624 8,787,019 $19.58 Q408 2,798 162,686,534 26,483,723 16.3% 1,270,905 0.8% 27,754,630 17.1% 189,881 0 48,260 319,158 8,558,723 $19.62 COLLIERS INTERNATIONAL | P. 3
  • 4. RESEARCH REPORT | Q4 2010 | OFFICE | DETROIT 480 offices in VACANCY 61 countries on The overall office vacancy rate in the Metro Detroit market decreased to 19.0% in the 6 continents Net absorption for Detroit’s Central Business fourth quarter 2010 compared to third United States: 135 District increased this quarter to a positive quarter; higher than it was 12 months ago at Canada: 39 50,898 square feet. The suburban markets Latin America: 17 18.2%. saw a decline and posted a positive 375,075 Asia Pacific: 194 square feet for the fourth quarter 2010. EMEA: 95 The average vacancy rate for Class A projects was 15.8%, Class B projects 21.7% • $1.9 billion in annual revenue and Class C projects 15.1%. Detroit’s SALES ACTIVITY • 2.4 billion square feet under Downtown vacancy rate decreased to 17.1% management At the end of the third quarter of 2010, total and the Suburban vacancy slightly • Over 15,000 professionals office building sales activity was up decreased to 21.1% in the fourth quarter of compared to 2009. In the first nine months 2010. of 2010, the market saw 34 office sales UNITED STATES: transactions with a total volume of over Colliers International - Detroit $195 million. The price per square foot 2 Corporate Drive ABSORPTION/LEASING ACTIVITY averaged $76. In the same first nine months Suite 300 Net absorption for the overall office market of 2009, 17 transactions posted with a total Southfield, Michigan 48076 in the fourth quarter 2010 amounted to a volume of over $53 million. The price per TEL +1 248 540 1000 positive 924,996 square feet, an increase square foot averaged $44. Locally, sales FAX +1 248 540 1038 from last quarter. are averaging approximately $35 - $75 per square foot and capitalization rates between The Outer Detroit Dearborn submarket 8.5 and 9.5%. reported the highest absorption while the RESEARCH DEPARTMENT: Oakland County submarket came in with the Michelle McGuckin lowest. 2010 has amounted to a positive TEL +1 248 226 1848 223,249 square feet. FAX +1 248 226 1849 EMAIL michelle.mcguckin@colliers.com Copyright © 2010 Colliers International. The information contained herein has been obtained from sources deemed reliable. While every reasonable effort has been made to ensure its accuracy, we cannot guarantee it. No responsibility is assumed for any inaccuracies. Readers are encouraged to consult their professional advisors prior to acting on any of the material contained in this report. Accelerating success. www.colliers.com/marketname