SlideShare una empresa de Scribd logo
1 de 11
Descargar para leer sin conexión
Atmospheric Environment 39 (2005) 1199–1209
Health impacts from power plant emissions in Mexico
M.T. Lo´ pezÃ, M. Zuk, V. Garibay, G. Tzintzun, R. Iniestra, A. Ferna´ ndez
Instituto Nacional de Ecologı´a, Perife´rico Sur No. 5000, Col. Insurgentes Cuicuilco, Delegacio´n Coyoaca´n, 04530 D.F. Mexico
Received 19 April 2004; accepted 6 October 2004
Abstract
Emissions from power plant pose a potentially large risk to human health and the environment. This pollution source
is of particular concern in Mexico, where a large share of electricity is generated by the burning of high-sulfur fuel oil. In
this paper, we estimate the health impacts due to air pollution from one of the Mexico’s largest power plants, Tuxpan,
located on the eastern coast. We calculate the annual average concentrations of primary and secondary (sulfates and
nitrates) particulate matter, by modeling representative periods during the year 2001 using the CALPUFF–CALMET
modeling system.
We find that emissions from the power plant resulted in annual average concentrations of 0.12 mg mÀ3
(min–max:
0.00–1.43) for primary PM2.5, 0.64 mg mÀ3
(0.01–2.84) for secondary PM2.5 and 3.09 mg mÀ3
(0.01–41.54) for SO2 in the
120 km  120 km modeling domain. Such concentrations, while mostly affecting a relatively rural area, could result in
significant public health and economic impacts for the local population. It is important to consider such damages when
evaluating different electricity generation and control technologies.
r 2004 Elsevier Ltd. All rights reserved.
Keywords: Health effects; Particulate matter; Power plants; Cluster analysis; Meteorological modeling
1. Introduction
Mexican electricity generation has proven to be a
large source of air pollution nationwide. The country’s
total effective installed capacity in 2003 was 43,727 MW,
producing 221 TWh of electricity. The majority of
electricity in Mexico is generated from fossil fuel
combustion, predominantly fuel oil combustion (41%),
but increasingly from burning of natural gas (31.5%).
Coal fired power plants only generate 9% of the
electricity, while hydropower accounts for 11%, fol-
lowed by nuclear (4.5%) and geothermal (3%) (CFE,
Comisio´ n Federal de Electricidad, 2004; EIA, Energy
Information Administration, 2004). Heavy fuel oil,
known as ‘combusto´ leo’, is mostly supplied by Mexico’s
state owned petroleum company (PEMEX) and is high
in sulfur and trace metals. The typical sulfur content of
Mexican ‘combusto´ leo’ is approximately 3–4% (Vijay et
al., 2004). Furthermore, most power plants in Mexico
do not have any emissions controls installed, resulting in
high emissions from the electricity sector. In the year
2001, electricity generation in Mexico accounted for
68% of SO2 emissions, 24% of PM10 emissions and 20%
of NOx emissions nationwide (Conzelmann et al., 2003).
The Federal Electricity Commission (CFE) owns most
of Mexico’s power plants, however approximately 16%
of the national capacity, consisting mostly of natural gas
plants, is privately owned and sold to the CFE
(CFE,Comisio´ n Federal de Electricidad, 2004). Current
regulations for power plants are established under the
standard NOM-085-ECOL-1994, which sets emissions
ARTICLE IN PRESS
www.elsevier.com/locate/atmosenv
1352-2310/$ - see front matter r 2004 Elsevier Ltd. All rights reserved.
doi:10.1016/j.atmosenv.2004.10.035
ÃCorresponding author. Tel.: +52 5424 6423.
E-mail address: mtlopez@ine.gob.mx (M.T. Lo´ pez).
limits for all point sources. Lower emissions limits are
set for plants in ‘critical zones’ which are primarily
located near urban areas. These critical urban zones
have mostly converted to natural gas plants, whereas
plants located along the coast or near PEMEX refineries
have continued to use ‘combusto´ leo’. Emissions from
plants in more rural areas, however, may also signifi-
cantly impact urban areas that are not necessarily
nearby.
This study aims to quantify the health impacts from
emissions of a specific power plant in Mexico. Many
studies from the US and Europe have demonstrated that
emissions from power plants in compliance with
national standards still result in significant impacts to
nearby populations (Levy et al., 2002; European
Commission, 1995). No such study, however, has been
conducted in Mexico, where population patterns, fuel
mixes and meteorology are significantly different. This
study is of particular relevance in Mexico, as the
government is currently considering reforms on the
legal and budgetary framework of this sector and
associated changes in emissions standards for electricity
production.
To determine the impacts of emissions from Mexican
power plants on regional air pollution and health, we
have conducted a case study on one of the largest and
most polluting power plants in Mexico using the
CALPUFF lagrangian puff model (Scire et al., 2000a).
We consider the annual emissions of SO2, NOx and
primary PM2.5 from the power plant stacks. Evidence
from Mexico and the US are used to estimate the annual
mortality impact and monetary damages from power
plant emissions. Finally, we present the uncertainty in
the modeling and a sensitivity analysis of certain
parameters.
1.1. Adolfo Lo´pez Mateos power plant
In this initial case study, we evaluate the impacts of
the Adolfo Lo´ pez Mateos power plant, located in the
town of Tuxpan in the eastern state of Veracruz. The
Tuxpan power plant is the largest power plant in the
country in terms of generation, emissions and fuel
consumption. It is located on the northern coast of the
Gulf of Mexico, which influences the weather of the
region. The study region comprises of 7 medium sized
towns with a total urban population of 153,000. When
rural populations are included, the study population
grows to approximately 791,000. The main land use in
the study region is cultivation and fields for livestock.
The power plant in Tuxpan has 6 steam generators
with a total installed capacity of 2100 MW, producing
approximately 15,000 GWh of electricity per year. The
plant burns roughly 3.4 million m3
of heavy fuel oil each
year with an average 3.8% sulfur content (CFE,
Comisio´ n Federal de Electricidad, 2002 and Secretarı´a
de Energı´a (SENER), 2001, 2002). In addition 1700 m3
of diesel are used per year for start up and for the
running of ancillary equipment (CFE, Comisio´ n Federal
de Electricidad, 2002 and Vijay, 2004). Continuous
emissions measurements are not available for the power
plant, therefore we estimate emissions based on standard
emissions factors (United States Environmental Protec-
tion Agency (USEPA), 1998) and the fuel consumption
of the plant. The combustion equipment used at this
plant, like other plants in Mexico, are similar in
technology to plants from the US and other countries,
however differences in operation and maintenance of the
equipment could be considerable and introduce a
significant uncertainty in the use of emissions factors
derived from the U.S (Vijay, 2004). We calculate that
total annual emissions from the Tuxpan power plant in
2001 amount to approximately 242,000 tons of SO2,
15,000 tons of NOx and 8000 tons of PM2.5.
Table 1 summarizes the average emissions intensities
for Tuxpan, Mexico and the US. Tuxpan is the largest
power plant emitter of SO2 in North America (Miller
and Van Atten, 2004), with emissions intensities
(KgMWhÀ1
) approximately 50% greater than the
Mexican average and 4.5 times the US average, due to
the high-sulfur content of the ‘combusto´ leo’ it uses. NOx
emissions from Tuxpan are of the same magnitude as
Mexican and the US averages, whereas PM2.5 emissions
for the plant are 10 times higher than the US average
and 38% times greater than Mexican average, due to
lack of emissions controls and it use of high-sulfur fuels.
2. Methodology
2.1. Atmospheric modeling
We use the CALPUFF-CALMET-MM5 modeling
system to simulate the dispersion of pollutants in the
ARTICLE IN PRESS
Table 1
Emissions intensities for the Tuxpan power plant, Mexican
average and US average
Emissions intensity (kgMWhÀ1
)
Tuxpan Mexican averagea
US averagea
SO2 17.13 11.35 3.79
NOx 1.47 1.83 1.66
PM2.5 0.54 0.39b
0.05c
a
Emissions and electricity production for 2002 from Miller
and Van Atten (2004).
b
PM2.5 emissions for 2002 from Vijay (2004).
c
PM2.5 Emissions for 2002 from United States Environ-
mental Protection Agency (USEPA), 2004.
M.T. Lo´pez et al. / Atmospheric Environment 39 (2005) 1199–12091200
modeling domain. We consider a 120 km  120 km
modeling domain (Fig. 1), with a resolution of
2 km  2 km and height of 2500 m. The fine resolution
was chosen to optimize the reproduction of the sea
breeze effect (Ames et al., 2002) and we use a smaller
domain than other power plant studies due to limited
computing capacity and meteorological data. While
similar studies have been able to run air quality models
to simulate conditions for an entire year (Levy et al.,
2002), the intense computational and data requirements
necessary to run the CALPUFF–CALMET-MM5
models for 365 days prevent us from evaluating impacts
for an entire year. We therefore rely on statistical
methods to select representative periods from the year
2001, which characterize the most frequent meteorolo-
gical conditions over the course of the year.
The model year 2001 was selected because of its
high data quality and availability (Te´ ran, 2003).
Information from these periods along with their
representativeness can then be combined to estimate
annual average conditions (Physick and Goudey, 2001).
We do this by conducting a cluster analysis on
available meteorological variables and identifying char-
acteristic periods to model. Once these periods are
defined we use this information to determine an annual
average concentration with the following equation (De
Nevers, 1995):
Cannual ¼
X
ci  f i;
where ci is the average concentration of period i and fi is
the frequency of that period. Using this technique we
assume that there are certain meteorological patterns
that repeat throughout the year, which can be char-
acterized in terms of observable meteorological para-
meters (wind speed, temperature, etc.), and that air
pollution conditions are similar during these periods
(Samson et al., 1990).
To select the representative periods, we use surface
meteorological information from the Tuxpan, Veracruz,
station operated by the National Meteorological Service
(SMN). This meteorological station is located in the
southwestern corner of the city, approximately 13 km
from the power plant. The SMN database contains
information averaged over every 10 min for wind
direction (1N) and speed (msÀ1
), barometric pressure
(mb), temperature (1C), relative humidity (%) and
precipitation (mm).
We use cluster analysis, a multivariate statistical
technique, to identify representative periods with their
respective frequencies from the available meteorological
parameters for the region (Samson et al., 1990; Physick
and Goudey, 2001). Cluster analysis is an explicit way of
identifying groups in raw data sets. We use the
Euclidean distance between pairs of observations for
the similarity criteria and divisive hierarchy with the
tree-clustering algorithm. Wind roses are also used to
verify that the wind direction patterns were consistent
within the periods.
ARTICLE IN PRESS
Fig. 1. Modeling domain with population centers.
M.T. Lo´pez et al. / Atmospheric Environment 39 (2005) 1199–1209 1201
After determining the representative groups, we select
specific weeks to model from each of the group by
comparing the weekly averaged values of the meteor-
ological parameters with the average values for the
entire period of the group.
We apply the CALPUFF–CALMET-MM5 system to
estimate pollutant concentrations for the selected
representative weeks. CALPUFF, a non-steady-state
Lagrangian Gaussian puff model (Scire et al., 2000a), is
run for the selected weeks to determine concentrations
of primary PM2.5, SO2, and NOx distributed across the
domain for every hour. The model also includes a simple
chemical transformation model to calculate the forma-
tion of secondary particulate matter species ((NH4)2SO4,
HNO3 and NH4NO3) using the MESOPUFFII mechan-
ism (Scire et al., 2000a). We use CALPUFF default
assumptions for wet and dry deposition parameters as
well as for background concentrations of ammonia and
ozone.
The CALMET model is used to calculate surface wind
structures and micrometeorological variables (Scire et
al., 2000b). We generate topographical data by analyz-
ing satellite images (LAN), whereas we obtain land use
data from the National Forest Inventory (Secretarı´a de
Agricultura y Recursos Hidra´ ulicos (SARH), 1994).
Data from radiosondes from the city of Veracruz, the
closest available data to the study region (365 km from
Tuxpan), are used to provide vertical profiles of
meteorological and thermodynamic parameters.
We apply the MM5 model to improve the description
of the vertical wind structure (Robe and Scire, 1996).
This model is capable of predicting mesoscale flows by
incorporating global National Center for Environmental
Prediction (NCEP) data. To simulate prevailing meteor-
ological conditions during the modeled weeks, we use a
6 km  6 km resolution grid larger than our domain,
which is then incorporated into the CALMET model to
interpolate from a lower to higher resolution grid.
The MM5 model output is used as an ‘‘initial guess
field’’ and then adjusted for kinematical effects of
terrain, slope flows, and terrain blocking by CALMET,
to produce the initial wind fields. These fields are further
adjusted by interpolation methods with surface observa-
tions and the vertical profile data. In addition to
reproducing the wind fields of the region, CALMET
uses a micrometeorological module to describe char-
acteristics of the mixing layer, three-dimensional fields
of temperature and other parameters that CALPUFF
uses in its calculation of dispersion.
2.2. Health impacts
To determine the public health impacts from exposure
to particulate matter (primary and secondary), we
analyze the mortality effect due to long-term exposure
to such pollutants. Although exposure to particulate
matter has been shown to have significant impacts on
morbidity outcomes, we chose to limit the scope of our
analysis to mortality for two reasons: firstly, informa-
tion on morbidity incidence or hospitalization rates were
unavailable at the local or state level. Secondly, other
analyses (Levy et al, 1999; United States Environmental
Protection Agency (USEPA), 1999, 2004) have shown
that once monetary values are applied to the health
outcomes, the mortality effect due to chronic exposure
to particulate matter overwhelms the impacts of short-
term mortality and morbidity effects. We explore the
sensitivity of our results to the inclusion of morbidity
effects in the results section.
In order to determine the appropriate concentration–
response functions to use, we must turn to US evidence
since no studies on the mortality effects from long- term
exposure to particulate matter have been conducted in
Mexico. There have been several cohort mortality
studies conducted in the US. The Six Cities study
(Dockery et al., 1993) followed 8111 adults for over 15
years in six US cities. In the recent reanalysis of this
study, a 13% increase in mortality per 10 mg mÀ3
in
PM2.5 was found (Health Effects Institute (HEI), 2000).
The American Cancer Society (ACS) study (Pope et al.,
1995) followed approximately 1.2 million adults for over
7 years and found a 6% increase in mortality per
10 mg mÀ3
in PM2.5 (Pope et al., 2002). There have been
several other studies, such as the cohorts of Seventh Day
Adventists (Abbey et al., 1999) and US Veterans (Lipfert
et al., 2000), however it may not be appropriate to
generalize their findings to other populations.
Although no cohort studies have been conducted in
Mexico, several studies have analyzed the mortality
effects due to short-term exposure to particulate matter
in Mexico City. Such studies have found increases
between 1.25% and 1.4% in mortality rates per
10 mg mÀ3
increase in PM2.5 (Castillejos et al., 2000
and Borja-Aburto et al., 1998, respectively). These
coefficients appear to be within the range of and perhaps
greater than the international evidence on mortality
from short-term exposure to particulate matter (Evans
et al., 2002). Whether or not a cohort study conducted in
Mexico would be comparable to those mentioned above,
however, is unknown. Furthermore, conditions in
Mexico City are not necessarily representative of the
entire country, as it has higher education levels, access to
health services and income than most other regions in
addition to higher ambient air pollution concentrations.
The extent to which these coefficients may represent
settings in other Mexican cities or rural settings such as
Tuxpan, therefore, is unclear.
Given that there have been no cohort studies
conducted in Mexico, and since there is no conclusive
evidence about which values would best represent
Mexican environments, we choose to use results from
the ACS study, as it represents the most comprehensive
ARTICLE IN PRESS
M.T. Lo´pez et al. / Atmospheric Environment 39 (2005) 1199–12091202
and perhaps general findings. There exists considerable
uncertainty, however, in the use of results generated in
other settings to Mexico, due to differences in popula-
tion characteristics such as socioeconomic status (SES)
and environmental factors. For instance, the ACS study
found the largest effects among the least educated and
greater effects for sulfate particulates (Pope et al., 2002).
The population response from exposure to air pollution
may therefore differ between the US and Mexico due to
such differences as ambient pollution levels, disease
patterns, particle composition, health care, income,
lifestyles, education and age structures between the
populations.
To determine the population at risk of premature
mortality due to long-term exposure to particulate
matter, we use the fraction of the population analyzed
in the ACS study: adults over the age of 30. We make no
differentiation in terms of relative risk between age
groups, which could introduce a potential bias in our
results. To account for the spatial variability of
population and concentrations, we use the population-
weighted concentrations to calculate health impacts.
Finally, since it was not possible to obtain mortality
data at the local level, we must rely on state level data
(Secretaria de Salud (SSA), 2002). Population data were
obtained from the National Institute of Statistics,
Geography and Information (Instituto Nacional de
Estadı´stica and Geografı´a e Informatica (INEGI),
2001) for the 2000 census.
2.3. Valuation
We determine the monetary damages due to the
increased mortality risk from exposure to particulate
matter using results from a Mexican study on the
willingness to pay (WTP) for the reduction in mortality
risk. Results from the only contingent valuation study
conducted in Mexico City (Hammitt and Ibarrara´ n,
2002) show that the value of a statistical life (VSL) for
an adult with an average income of $3500 US dollars per
year, is approximately $530,000 US dollars. When
compared against the central value for the US used by
the USEPA, of $6.5 million dollars (United States
Environmental Protection Agency (USEPA), 1999) and
the US GDP, the Mexican value indicates an income
elasticity of approximately 1.4. All WTP values are
adjusted for inflation to the year 2001.
The coastal region of the state of Veracruz is primarily
lower/middle class, with an average per capita income of
approximately $2200 US dollars per year. In contrast,
the population of the contingent valuation study of
people who lived in Mexico City had an average income
approximately 1.5 times greater than that of Veracruz.
Therefore, we adjust the VSL of from the Mexico City
study to account for the income differential between the
two populations, using the income elasticity of 1.4. This
calculation yields a VSL for the population of Veracruz
of approximately $280,000 US dollars.
3. Results
Based on the results from the cluster analysis of
meteorological data for the year 2001, we identify 3
main groups. Group 1 consists of 16 weeks (November
to February) with winter season characteristics of low
temperature, high relative humidity, high surface pres-
sure (associated with high cloud cover) and medium
precipitation, with a representativeness of 31% of the
year. The second group includes 23 weeks (March to
June), with average conditions of high temperature, low
relative humidity, low surface pressure and zero
precipitation, which represents conditions for 44% of
the year. Finally, group three, which comprises 12 weeks
(August to October), is dominated by high precipitation,
coinciding with the Atlantic hurricane season in 2001
(Gray et al., 2001), representing 23% of the year’s
conditions. We calculate the divisive coefficient, which
measures the amount of clustering structure found, to be
0.83.
In group one, the most representative week in terms of
its meteorological conditions was the period from the
5th to the 11th of November (Week 1), the 1st to the 7th
of June (Week 2) for group two, and the 10th to the 16th
of September (Week 3) for group three. It should be
noted that the week of the 24th of September did not fall
into any group, as its conditions were dominated by
hurricane Humberto from the 21st to the 27th of
September in 2001, which influenced the rise in
precipitation in the Gulf of Mexico (Gray et al., 2001).
Table 2 shows the average meteorological variables
for each selected week and the standard deviation
with respect to their corresponding representative group.
Fig. 2 demonstrates the wind direction patterns for the 3
weeks(Fig. 3).
Model simulations show that emissions from the
power plant result in annual average concentrations
for primary PM2.5 of 0.12 mg mÀ3
(min–max: 0.00–
1.43 mg mÀ3
), 0.57 mg mÀ3
(0.01–2.34 mg mÀ3
) for ammo-
nium sulfate, 0.04 mg mÀ3
(0.00–0.29 mg mÀ3
) for nitric
acid, 0.03 mg mÀ3
(0.00–0.2 mg mÀ3
) for ammonium
nitrate and 3.09 mg mÀ3
(0.01–41.54 mg mÀ3
) for SO2 in
the 120 km  120 km modeling domain. The plumes of
secondary PM2.5 concentrations reach beyond the
modeling domain, indicating a possible underestimate
in the calculation of total impacts (Figs. 4).
Emissions from the power plant could result in
approximately 30 deaths annually. After applying the
appropriate value of statistical life for the region, we find
the total social cost of the power plant emissions to be
approximately 8 million US dollars in 2001. Secondary
particulate matter formation contributes over 80% to
ARTICLE IN PRESS
M.T. Lo´pez et al. / Atmospheric Environment 39 (2005) 1199–1209 1203
ARTICLE IN PRESS
Fig. 2. Wind roses for the three selected weeks.
Table 2
Meteorological characteristics of representative groups and weeks
Group 1 Group 2 Group 3
Week 1 S.d. Week 2 S.d. Week 3 S.d.
Wind speed (m sÀ1
) 4.5 0.7 3.8 1.2 3.8 0.5
Temperature (1C) 22.2 2.9 29 3.8 27 1.5
Relative humidity (%) 91.5 2.3 87.6 1.9 91.4 1.4
Barometric pressure (mb) 1021.1 4.4 1007.2 6 1012.7 2.6
Precipitation (mm) 19 16.8 0 12.8 127 62.6
Cloudiness High N/A Zero N/A Very high N/A
M.T. Lo´pez et al. / Atmospheric Environment 39 (2005) 1199–12091204
ARTICLE IN PRESS
Fig. 3. Annual average primary PM2.5 concentrations.
Fig. 4. Annual average secondary PM2.5 concentrations.
M.T. Lo´pez et al. / Atmospheric Environment 39 (2005) 1199–1209 1205
the mortality impacts, most of which comes from sulfate
formation (73% of total impacts), resulting from high
SO2 emissions.
3.1. Sensitivity analysis
Although we use point values for the calculation of
health damages, there exists a wide range of uncertain-
ties in this analysis as described in Table 3, which may
have potentially large effects on our results. Much of
this uncertainty is difficult to quantify. We are, however,
able to analyze the sensitivity of the results based on a
few assumptions in the health effects, valuation and
atmospheric modeling parts of the analysis.
The model shows to be especially sensitive to the
inclusion of mortality impacts due to long-term SO2
exposure. Due to the high emissions and population
exposures to SO2, this could result in significant
damages to human health. Using the results from the
HEI reanalysis of the ACS study (0.5%) (Krewski et al.,
2000), emissions from the power plant could increase
our mortality estimates by a factor of 5. It should be
noted, however, that no studies in Mexico have
identified SO2 as a risk factor for mortality, and the
international evidence of a mortality effect from SO2
exposure is also weak.
As discussed in the methodology section, we simplify
the analysis by evaluating only mortality effects. To test
the importance of quantifying morbidity effects, we
evaluate a set of 14 morbidity outcomes, including
cardiovascular and respiratory hospital admissions and
emergency room visits, chronic bronchitis and restricted
activity days using combined evidence from Mexico and
the US (Evans et al., 2000; Cesar et al., 2002). Incidence
and valuation data for morbidity outcomes are derived
from Mexico City (McKinley et al., 2003), therefore
potentially biasing our results. Information on hospita-
lizations and direct costs come from the Mexican
Institute of Social Security (IMSS), while WTP values
for chronic bronchitis and restricted activity days are
derived from the same study as that used for the VSL
estimate (Hammitt and Ibarrara´ n, 2002). A full discus-
sion on the methodology and data used to evaluate
morbidity impacts can be found in McKinley et al.
(2003). Once morbidity outcomes are included, our
damages results increase by approximately a factor of 2.
Other studies have shown that results are fairly
insensitive to parametric uncertainty in the CALPUFF
model (Levy and Spengler, 2002). Here we test three
parametric assumptions in the CALPUFF model—the
chemical mechanism and the background ammonia and
ozone concentrations. When we apply RIVAD/ARM3
chemical mechanism instead of MESOPUFF II we find
that (NH4)2SO4 benefits are slightly reduced (22%)
while NH4NO3 benefits increase on approximately the
same scale (34%). These results show that the mechan-
ism choice has little effect on the benefits estimates.
To test the default assumptions used by CALPUFF
for background ozone concentrations, which are used as
a surrogate for OHÀ
in the MESOPUFF II mechanism,
we adjusted these concentrations based on recent
findings from a measurement campaign in Tuxpan
ARTICLE IN PRESS
Table 3
Uncertainty in modeling assumptions
Parametera
Potential uncertainties
Emissions inventory  Emissions factors derived from the US apply to Mexican conditions
 Emissions remain constant throughout the year
Atmospheric modeling  120 km  120 km modeling domain
 Default CALPUFF concentrations of ozone and ammonia
 Use of meteorological data from distant stations
Period selection  Representativeness of selected weeks
 Representativeness of the year 2001
Health effects  Linear concentration response functions with no thresholds
 Only mortality evaluated
 Equal toxicity for all particle compositions
 Constant relative risk for all adults above 30
 Relative risk values from US studies apply to Mexico
Valuation  The single Mexican study represents the correct WTP values for Mexico
 VSL values scale with income
a
Adapted from Levy and Spengler (2002).
M.T. Lo´pez et al. / Atmospheric Environment 39 (2005) 1199–12091206
during the first weeks of November 2003 (Zaragoza,
2004). It was found that local ozone levels were
approximately 4 times lower than the default values in
CALPUFF. As the month of November falls during the
rainy season, we only modify the ozone values in Group
1, since no information for other seasons was available.
Due to the rain, however, Group 1 turns out to be the
least polluted season, and thus there are no significant
changes in the results when we modify the ozone
concentrations for this season.
Similar studies (Levy et al., 2002; Levy and Spengler,
2002) have tested the default background ammonia
concentration of 10 ppb in CALPUFF, and found that
when reducing the ammonia concentration to 1 ppb, the
results for secondary nitrate are reduced by 30%. No
information is available on the true ammonia concen-
trations in the study region. Only one published study
has measured ammonia concentrations in Mexico
(Moya et al., 2001). This study found concentrations
between 4 and 30 ppb during March of 1997 in Mexico
City. Unfortunately, this information is not very
relevant to the Tuxpan region, which is predominantly
agricultural. Another study (Carmichael et al., 2003)
measured ammonia concentrations in 50 stations around
the world, including 6 rural sites in South America. Each
of these sites found average concentrations of o1 ppb.
We therefore test the assumption that ammonia back-
ground levels were 1 ppb throughout the year and find a
reduction of approximately 1% in total damages.
There exists considerable uncertainty in the methods
used to derive the value of a statistical life. Within the
US body of literature there is substantial variability in
study findings, with a factor of 10 difference between
results of WTP for mortality risk reduction studies
(Viscusi, 1993). We use preliminary results from the
single study conducted in Mexico. However, results
within this study using hedonic wage estimates found a
range for VSL between $230,000 and $320,000 (Ham-
mitt and Ibarrara´ n, 2004). Using these values, our
results could be reduced by up to 504%. Given the
variability shown between other studies, the uncertainty
in this parameter could be considerably high.
Finally, one important limitation of this study is the
relatively small domain evaluated in the atmospheric
modeling. Other studies have shown that impacts from
power plant emissions can reach populations over
300 km away from the source (Levy et al., 2002).
Furthermore, it is apparent from Fig. 4 that concentra-
tions extend beyond the modeling domain. If the
domain were to be extended to 600 km  600 km, the
population under analysis would expand to over 39
million people, since many large population centers are
located nearby. To test the impact of the domain size on
our results, we extrapolate the plume, using linear planar
regression and kriging interpolation. With the assump-
tion that concentrations are zero at the extended domain
boundary, we find that mortality could increase by a
factor of 4 and damages could rise to 40 million dollars.
4. Discussion and conclusions
This study shows that it is possible to estimate the
potential impacts of power plant emissions even with
scarce meteorological and health data and significant
computational limitations. We also show that although
such plants may be complying with national standards,
their emissions still have significant impacts on the
health of the surrounding population. In the case of
Tuxpan, these emissions could result in 30 premature
deaths per year in the nearby region. This corresponds
to approximately $530 US dollars per GWh in health
damages. These results are on the lower end of findings
of damages per GWh from other studies (Levy et al.,
1999), mostly due to the small domain size, therefore
only capturing the impacts on a small population, and
the lower VSL for Mexico.
In total, emissions from the power plant contribute
1.66 mg mÀ3
to the population weighted annual average
PM2.5 concentrations (0.76 mg mÀ3
for the non-popula-
tion-weighted annual average). In comparison with
other studies (Levy et al., 2002; Levy and Spengler,
2002) our results appear to be rather high. This may be
due to the small domain, as concentrations tend to be
higher closer to the source, and therefore we capture
only high concentration regions in the average. Further-
more, in the population weighted concentrations,
regions of high concentrations are much more heavily
weighted than regions of low concentrations, as the
larger population centers are located closer to the source
(see Fig. 1) and the plume does not tend to extend
eastward towards the sea.
Although the resultant concentrations from emissions
of this power plant are relatively small, it is important to
recognize that we have modeled only one source from all
possible sources in the region. Therefore, while it is
expected that air quality standards would not be
exceeded from this one plant, stricter regulation may
still be justified. Further analysis is necessary to
determine appropriate control options to mitigate the
power plant emissions.
In the sensitivity analysis we show how uncertainties
in various parameters can affect our estimates. The
results appear to be most sensitive to the inclusion of
impacts from SO2 concentrations and the expansion of
the modeling domain. The model, however, appears to
be relatively insensitive to parameter assumptions in the
atmospheric modeling. The uncertainties in several of
the parameters that were not quantified, such as the use
of US concentration response values and emissions
factors, are probably significant.
ARTICLE IN PRESS
M.T. Lo´pez et al. / Atmospheric Environment 39 (2005) 1199–1209 1207
In order to apply this type of analysis to the policy-
making process, several key uncertainties should be
resolved. Future analyses should include the expansion
of the modeling domain, simulation over an entire year,
incorporation of other pollutants and non-health
impacts, and validation of the air quality model. We
show that emissions from power plants can have a
potentially large impact on public health and that the
use of the damage function approach is both feasible
and informative to the policy-making processes in
Mexico.
Acknowledgements
We thank Leonora Rojas Bracho, Samudra Vijay,
Galen Mckinley, and Andrew Wilson for their helpful
comments on the project and article and Gabriela
Cuevas Garcı´a of INE for her assistance in preparing
the land use data. We appreciate the help of Angel Tera´ n
Cuevas and Francisco Mejia of the SMN in acquiring
meteorological data.
References
Abbey, D.E., Nishino, N., McDonell, W.F., Burchette, R.J.,
Knutsen, S.F., Beeson, W.L., Yang, J.X., 1999. Long-term
inhalable particles and other pollutants related to mortality
of non-smokers. American Journal for Respiratory and
Critical Care Medicine 159, 373–382.
Ames, M.R., Zemba, S.G., Yamartino, R.J., Valberg, P.A.,
Green, L.C., 2002. Comments on: using CALPUFF to
evaluate the impacts of power plant emissions in Illinois:
model sensitivity and implications. Atmospheric Environ-
ment 36, 2263–2265.
Borja-Aburto, V.H., Castillejos, M., Gold, D.R., Bierzwinski,
S., Loomis, D., 1998. Mortality and ambient fine particles in
southwest Mexico City, 1993–1995. Environmental Health
Perspectives 106, 849–856.
Carmichael, G., et al., 2003. Measurements of sulfur dioxide,
ozone and ammonia concentrations in Asia, Africa, and
South America using passive samplers. Atmospheric En-
vironment 37, 1293–1308.
Castillejos, M., Borja-Aburto, V., Dockery, D., Loomis, D.,
2000. Coarse particles and mortality in Mexico City.
Inhalation Toxicology 12 (Supp 1), 61–72.
Cesar, H., et al., 2002. Economic Valuation of Improvement of
Air Quality in the Metropolitan Area of Mexico City.
Comisio´ n Ambiental Metropolitana (CAM) and World
Bank, Mexico City, Mexico.
Comisio´ n Federal de Electricidad (CFE) 2002. Informe de
Operacio´ n 2001, Me´ xico, DF.
Comisio´ n Federal de Electricidad (CFE) 2004. Generacio´ n.
Me´ xico DF. http://www.cfe.gob.mx/www2/QueEsCFE/
informacion/Generacion/.
Conzelmann, G., Quintanilla, J., Aguilar, V., Conde, L.,
Ferna´ ndez, J., Mar, E., Martı´n del Campo, C., Serrato,
G., Ortega, R., 2003. Mexico’s long-term energy outlook,
results of a detailed energy supply and demand simulation.
Argonne National Laboratory, Argonne, IL.
De Nevers, N., 1995. Air Pollution Control Engineering.
McGraw-Hill, New York (Chapter 6).
Dockery, D.W., Pope 3rd, C.A., Xu, X., Spengler, J.D., Ware,
J.H., Fay, M.E., Ferris Jr., B.G., Speizer, F.E., 1993. An
association between air pollution and mortality in six US
cities. New England Journal of Medicine 329 (24),
1753–1759.
EIA, Energy Information Administration, 2004. Mexico
Country Analysis Brief. http://www.eia.doe.gov/emeu/
cabs/mexico.html.
European Commission, 1995. ExternE: External Costs of
Energy: Oil and Gas, vol. 4. Directorate-General XII,
Science, Research and Development, Brussels.
Evans, J., Spengler, J., Levy, J., Hammitt, J., Suh, H., Serrano,
P., Rojas-Bracho, L., Santos-Burgoa, C., Rojas-Rodriguez,
H., Caballero-Ramirez, M., Castillejos, M., 2000. Contam-
inacio´ n atmosfe´ rica y salud humana en la Ciudad de
Me´ xico. MIT-IPURGAP Report No. 10.
Evans, J., Levy, J., Hammitt, J., Santos-Burgoa, C., Castillejos,
M., 2002. Health benefits of air pollution control. In: Air
Quality in the Mexico Megacity: An Integrated Assessment.
Kluwer Academic Publishers, Boston.
Gray, W.M., Landsea, C.W., Blake, E., Mielke, P.W., Berry,
K.J., 2001. Summary of 2001 Atlantic tropical cyclone
activity and verification of authors’ seasonal activity
forecast. Department of Atmospheric Science, Colorado
State University.
Hammitt, J., Ibarrara´ n, M., 2002. Estimating the economic
value of reducing health risks by improving air quality in
Mexico City. Preliminary Results.
Hammitt, J., Ibarrara´ n, M., 2004. Estimating the economic
value of reducing health risks in Mexico city: compensating
wage differentials. Harvard University, Cambridge, MA.
Health Effects Institute (HEI), 2000. Reanalysis of the Harvard
Six Cities Study and the American Cancer Society Study of
Particulate Air Pollution and Mortality. Cambridge, MA.
Instituto Nacional de Estadı´stica, Geografı´a e Informatica
(INEGI), 2001. Marco Geoestadı´stico municipal, 2000,
Mexico.
Krewski, D., Burnett, R.T., Goldberg, M.S., Hoover, K.,
Siemiatycki, J., Jarrett, M., Abrahamowicz, M., White,
W.H., 2000. Particle Epidemiology Reanalysis Project. Part
II: Sensitivity Analyses. Health Effects Institute, Cam-
bridge, MA.
Levy, J., Spengler, J., 2002. Modeling the benefits of power
plant emission controls in Massachusetts. Journal of Air
and Waste management Association 52, 5–18.
Levy, J., Hammitt, J.K., Yanagisawa, Y., Spengler, J.D., 1999.
Development of a new damage function model for power
plants: methodology and applications. Environmental
Science and Technology 33, 4364–4372.
Levy, J., Spengler, J., Hlinka, D., Sullivan, D., Moon, D., 2002.
Using CALPUFF to evaluate the impacts of power plant
emissions in Ilinois: model sensitivity and implications.
Atmospheric Environment 36, 1063–1075.
Lipfert, F.W., Perry Jr., H.M., Miller, J.P., Baty, J.D., Wyzga,
R.E., Carmody, S.E., 2000. The Washington university-
EPRI veterans’ cohort mortality study: preliminary results.
Inhalation Toxicology 12 (Supp. 4), 41–73.
ARTICLE IN PRESS
M.T. Lo´pez et al. / Atmospheric Environment 39 (2005) 1199–12091208
McKinley, G., Zuk, M., Hojer, M., Avalos, M., Gonzalez, I.,
Herna´ ndez, M., Iniestra, R., Laguna, I., Martı´nez, M.A.,
Osnaya, P., Reynales, L.M., Valde´ s, R., Martı´nez, J., 2003.
The local benefits of global air pollution control in Mexico
City. Final Report to the US Environmental Protection
Agency and the US—Mexico Foundation for Science,
Mexico City.
Miller, P.J., Van Atten, C., 2004. North American Power Plant
Air Emissions 2002. Commission for Environmental Co-
operation, Montreal, Canada.
Moya, M., Ansari, A., Pandis, S., 2001. Partitioning of nitrate
and ammonium between the gas and particulate phases
during the 1997 IMADA-AVER study in Mexico City.
Atmospheric Environment 35, 1791–1894.
Physick, W.L., Goudey, R., 2001. Estimating an annual-
average RSP concentration for Hong Kong using days
characteristic of the dominant weather patterns. Atmo-
spheric Environment 35, 2697–2705.
Pope, C., Thun, M., Namboodiri, M., Dockery, D., Evans, J.,
Speizer, F., Heath, C., 1995. Particulate air pollution as a
predictor of mortality in a prospective study of US adults.
American Journal of Respiratory Critical Care Medicine
151, 669–674.
Pope III, C.A., Burnett, R.T., Thun, M.J., Calle, E.E., Krewski,
D., Ito, K., Thurston, G.D., 2002. Lung cancer, cardio-
pulmonary mortality, and long-term exposure to fine
particulate air pollution. JAMA 287, 1132–1141.
Robe, F.R., Scire, J.S., 1996. Combining mesoscale prognostic
and diagnostic wind models: a practical approach for air
quality applications on complex terrain. Paper 5B.4,
Preprints 10th Joint Conference on the Applications of
Air Pollution Meteorology. Phoenix, Arizona.
Samson, P.J., Brooks, J.R., Sikknab, S., 1990. Estimation of
seasonal and annual acidic deposition through aggregation
of 3-day episodic periods. EPA-600/3-90/059, Atmospheric
Research and Exposure Assessment Laboratory, US
Environmental Protection Agency, Research Triangle
Park, NC.
Scire, J.S., Strimaitis, D.G., Yamartino, R.J., 2000a. A User’s
Guide for the CALPUFF Dispersion Model (Version 5.0).
Earth Tech, Inc., Concord, MA.
Scire, J.S., Robe, F.R., Fernau, M.E., Yamartino, R.J., 2000b.
A User’s Guide for the CALMET Meteorological Model
(Version 5.0). Earth Tech. Inc., Concord, MA.
Secretarı´a de Agricultura y Recursos Hidra´ ulicos (SARH),
1994. Inventario Nacional Perio´ dico. Subsecretarı´a Forestal
y de la Fauna Silvestre, Me´ xico.
Secretarı´a de Energı´a (SENER), 2001. Prospectiva del sector
ele´ ctrico 2001–2010. 1a
, Edicio´ n, Me´ xico, DF.
Secretarı´a de Energı´a (SENER), 2002. Programa de Energı´a y
Medio Ambiente: Hacia el Desarrollo Sustentable.
Me´ xico, DF.
Secretaria de Salud (SSA), 2002. Mortalidad 2001. Me´ xico, DF.
http://www.salud.gob.mx/apps/htdocs/estadisticas/mortalidad/
mortalidad.htm.
Te´ ran, A., 2003. Personal communication. National Meteor-
ological Service, Mexico City, Mexico.
United States Environmental Protection Agency (USEPA),
1998. Compilation of Air Pollutant Emission Factors, fifth
ed. vol. I, External Combustion Sources, AP-42 (Chapter 1).
United States Environmental Protection Agency (USEPA),
1999. The Benefits and Costs of the Clean Air Act,
1990–2010. EPA Report to Congress (EPA-410-R-99-001).
United States Environmental Protection Agency (USEPA),
2004. Air Emissions Trends; http://www.epa.gov/airtrends/
econ-emissions.html.
Vijay, S., 2004. Personal communication. Massachusetts
Institute of Technology, Boston, MA.
Vijay, S., Molina, L.T., Molina, M., 2004. Estimating Air
Pollution Emissions from Fossil Fuel use in the Electricity
Sector in Mexico. Massachusetts Institute of Technology,
Boston, MA.
Viscusi, W., 1993. The value of risks to life and health. Journal
of Economic Literature 31, 1912–1946.
Zaragoza, J., 2004. Personal communication. CENICA,
Me´ xico City, Me´ xico.
ARTICLE IN PRESS
M.T. Lo´pez et al. / Atmospheric Environment 39 (2005) 1199–1209 1209

Más contenido relacionado

Destacado

Civilisiation the native and educating the nation
Civilisiation the native and educating the nationCivilisiation the native and educating the nation
Civilisiation the native and educating the nationvenkatesan archaeoven
 
Group b site analysis (1)
Group b   site analysis  (1)Group b   site analysis  (1)
Group b site analysis (1)Benjamin Tan
 
Rodrigues accb2016
Rodrigues accb2016Rodrigues accb2016
Rodrigues accb2016joernfischer
 
Concrete pavement joints
Concrete pavement jointsConcrete pavement joints
Concrete pavement jointsahmed alsalihy
 
ธรรมชาติของภาษา
ธรรมชาติของภาษาธรรมชาติของภาษา
ธรรมชาติของภาษาพัน พัน
 
Sinking of well foundation
Sinking of well foundationSinking of well foundation
Sinking of well foundationSourabh Jain
 
Civil Engineering Project Presentation
Civil Engineering Project PresentationCivil Engineering Project Presentation
Civil Engineering Project PresentationIbrahim Ali
 
ปฎิทินรายเดือน 2017 D2
ปฎิทินรายเดือน 2017 D2ปฎิทินรายเดือน 2017 D2
ปฎิทินรายเดือน 2017 D2Sootthida Junjam
 
Real estate & Construction Industry Market Research in India
Real estate & Construction Industry Market Research in IndiaReal estate & Construction Industry Market Research in India
Real estate & Construction Industry Market Research in IndiaRumanshu Katiyar
 
OCTO 2012 : Les pratiques des geants du web
OCTO 2012 : Les pratiques des geants du web OCTO 2012 : Les pratiques des geants du web
OCTO 2012 : Les pratiques des geants du web OCTO Technology
 

Destacado (10)

Civilisiation the native and educating the nation
Civilisiation the native and educating the nationCivilisiation the native and educating the nation
Civilisiation the native and educating the nation
 
Group b site analysis (1)
Group b   site analysis  (1)Group b   site analysis  (1)
Group b site analysis (1)
 
Rodrigues accb2016
Rodrigues accb2016Rodrigues accb2016
Rodrigues accb2016
 
Concrete pavement joints
Concrete pavement jointsConcrete pavement joints
Concrete pavement joints
 
ธรรมชาติของภาษา
ธรรมชาติของภาษาธรรมชาติของภาษา
ธรรมชาติของภาษา
 
Sinking of well foundation
Sinking of well foundationSinking of well foundation
Sinking of well foundation
 
Civil Engineering Project Presentation
Civil Engineering Project PresentationCivil Engineering Project Presentation
Civil Engineering Project Presentation
 
ปฎิทินรายเดือน 2017 D2
ปฎิทินรายเดือน 2017 D2ปฎิทินรายเดือน 2017 D2
ปฎิทินรายเดือน 2017 D2
 
Real estate & Construction Industry Market Research in India
Real estate & Construction Industry Market Research in IndiaReal estate & Construction Industry Market Research in India
Real estate & Construction Industry Market Research in India
 
OCTO 2012 : Les pratiques des geants du web
OCTO 2012 : Les pratiques des geants du web OCTO 2012 : Les pratiques des geants du web
OCTO 2012 : Les pratiques des geants du web
 

Similar a Health and Economic Impacts from Power Plant Emissions in Mexico

tph-ontarios-electricity-sector
tph-ontarios-electricity-sectortph-ontarios-electricity-sector
tph-ontarios-electricity-sectorKim Perrotta
 
HOW THE GOVERNMENT OF BRAZIL CAN MAKE THE ENERGY SECTOR SUSTAINABLE.pdf
HOW THE GOVERNMENT OF BRAZIL CAN MAKE THE ENERGY SECTOR SUSTAINABLE.pdfHOW THE GOVERNMENT OF BRAZIL CAN MAKE THE ENERGY SECTOR SUSTAINABLE.pdf
HOW THE GOVERNMENT OF BRAZIL CAN MAKE THE ENERGY SECTOR SUSTAINABLE.pdfFaga1939
 
Alternative Electric Power Plant that Environmental Friendliness at Indonesia
Alternative Electric Power Plant that Environmental Friendliness at IndonesiaAlternative Electric Power Plant that Environmental Friendliness at Indonesia
Alternative Electric Power Plant that Environmental Friendliness at Indonesiainventy
 
Viterbo Offshore Wind Energy In Brazil
Viterbo   Offshore Wind Energy In BrazilViterbo   Offshore Wind Energy In Brazil
Viterbo Offshore Wind Energy In BrazilJean Viterbo
 
Hurricanes and Global Warming- Dr. Kerry Emanuel
Hurricanes and Global Warming- Dr. Kerry EmanuelHurricanes and Global Warming- Dr. Kerry Emanuel
Hurricanes and Global Warming- Dr. Kerry EmanuelJohn Atkeison
 
Global warming by engr ihsan
Global warming by engr ihsanGlobal warming by engr ihsan
Global warming by engr ihsanIhsan Ur Rahman
 
Factors Affecting the Rise of Renewable Energy in the U.S. .docx
Factors Affecting the Rise of Renewable Energy in the U.S. .docxFactors Affecting the Rise of Renewable Energy in the U.S. .docx
Factors Affecting the Rise of Renewable Energy in the U.S. .docxmydrynan
 
DIRTY KILOWATTS America’s Most Polluting Power Plants
DIRTY KILOWATTS  America’s Most Polluting Power PlantsDIRTY KILOWATTS  America’s Most Polluting Power Plants
DIRTY KILOWATTS America’s Most Polluting Power Plantsjundumaug1
 
Incoming solar rediation imbalance
Incoming solar rediation imbalanceIncoming solar rediation imbalance
Incoming solar rediation imbalanceShubham Pachpor
 
Monday, November 30, 2015 at 449 PM Page 1User Zhijing.docx
Monday, November 30, 2015 at 449 PM   Page 1User Zhijing.docxMonday, November 30, 2015 at 449 PM   Page 1User Zhijing.docx
Monday, November 30, 2015 at 449 PM Page 1User Zhijing.docxmoirarandell
 
A2 CAMBRIDGE GEOGRAPHY: ENVIRONMENTAL MANAGEMENT - SUSTAINABLE ENERGY SUPPLIES
A2 CAMBRIDGE GEOGRAPHY: ENVIRONMENTAL MANAGEMENT - SUSTAINABLE ENERGY SUPPLIESA2 CAMBRIDGE GEOGRAPHY: ENVIRONMENTAL MANAGEMENT - SUSTAINABLE ENERGY SUPPLIES
A2 CAMBRIDGE GEOGRAPHY: ENVIRONMENTAL MANAGEMENT - SUSTAINABLE ENERGY SUPPLIESGeorge Dumitrache
 
10.1.1.120.7375
10.1.1.120.737510.1.1.120.7375
10.1.1.120.7375sayed30
 
Renewable sources and technology to harness them are low carbon emissions and...
Renewable sources and technology to harness them are low carbon emissions and...Renewable sources and technology to harness them are low carbon emissions and...
Renewable sources and technology to harness them are low carbon emissions and...virat040500
 

Similar a Health and Economic Impacts from Power Plant Emissions in Mexico (20)

Avoid ws2 d1_31_fire
Avoid ws2 d1_31_fireAvoid ws2 d1_31_fire
Avoid ws2 d1_31_fire
 
Avoid ws2 d1_31_fire
Avoid ws2 d1_31_fireAvoid ws2 d1_31_fire
Avoid ws2 d1_31_fire
 
tph-ontarios-electricity-sector
tph-ontarios-electricity-sectortph-ontarios-electricity-sector
tph-ontarios-electricity-sector
 
HOW THE GOVERNMENT OF BRAZIL CAN MAKE THE ENERGY SECTOR SUSTAINABLE.pdf
HOW THE GOVERNMENT OF BRAZIL CAN MAKE THE ENERGY SECTOR SUSTAINABLE.pdfHOW THE GOVERNMENT OF BRAZIL CAN MAKE THE ENERGY SECTOR SUSTAINABLE.pdf
HOW THE GOVERNMENT OF BRAZIL CAN MAKE THE ENERGY SECTOR SUSTAINABLE.pdf
 
Alternative Electric Power Plant that Environmental Friendliness at Indonesia
Alternative Electric Power Plant that Environmental Friendliness at IndonesiaAlternative Electric Power Plant that Environmental Friendliness at Indonesia
Alternative Electric Power Plant that Environmental Friendliness at Indonesia
 
Viterbo energex norway 2006
Viterbo energex norway 2006Viterbo energex norway 2006
Viterbo energex norway 2006
 
Viterbo Offshore Wind Energy In Brazil
Viterbo   Offshore Wind Energy In BrazilViterbo   Offshore Wind Energy In Brazil
Viterbo Offshore Wind Energy In Brazil
 
TmangatPoster_MAZ
TmangatPoster_MAZTmangatPoster_MAZ
TmangatPoster_MAZ
 
Hurricanes and Global Warming- Dr. Kerry Emanuel
Hurricanes and Global Warming- Dr. Kerry EmanuelHurricanes and Global Warming- Dr. Kerry Emanuel
Hurricanes and Global Warming- Dr. Kerry Emanuel
 
Global warming by engr ihsan
Global warming by engr ihsanGlobal warming by engr ihsan
Global warming by engr ihsan
 
Factors Affecting the Rise of Renewable Energy in the U.S. .docx
Factors Affecting the Rise of Renewable Energy in the U.S. .docxFactors Affecting the Rise of Renewable Energy in the U.S. .docx
Factors Affecting the Rise of Renewable Energy in the U.S. .docx
 
DIRTY KILOWATTS America’s Most Polluting Power Plants
DIRTY KILOWATTS  America’s Most Polluting Power PlantsDIRTY KILOWATTS  America’s Most Polluting Power Plants
DIRTY KILOWATTS America’s Most Polluting Power Plants
 
Incoming solar rediation imbalance
Incoming solar rediation imbalanceIncoming solar rediation imbalance
Incoming solar rediation imbalance
 
Comparison of some reference evapotranspiration equations
Comparison of some reference evapotranspiration equationsComparison of some reference evapotranspiration equations
Comparison of some reference evapotranspiration equations
 
Monday, November 30, 2015 at 449 PM Page 1User Zhijing.docx
Monday, November 30, 2015 at 449 PM   Page 1User Zhijing.docxMonday, November 30, 2015 at 449 PM   Page 1User Zhijing.docx
Monday, November 30, 2015 at 449 PM Page 1User Zhijing.docx
 
A2 CAMBRIDGE GEOGRAPHY: ENVIRONMENTAL MANAGEMENT - SUSTAINABLE ENERGY SUPPLIES
A2 CAMBRIDGE GEOGRAPHY: ENVIRONMENTAL MANAGEMENT - SUSTAINABLE ENERGY SUPPLIESA2 CAMBRIDGE GEOGRAPHY: ENVIRONMENTAL MANAGEMENT - SUSTAINABLE ENERGY SUPPLIES
A2 CAMBRIDGE GEOGRAPHY: ENVIRONMENTAL MANAGEMENT - SUSTAINABLE ENERGY SUPPLIES
 
10.1.1.120.7375
10.1.1.120.737510.1.1.120.7375
10.1.1.120.7375
 
MTechNotes.pptx
MTechNotes.pptxMTechNotes.pptx
MTechNotes.pptx
 
Why I Choose Nuke Power
Why I Choose Nuke PowerWhy I Choose Nuke Power
Why I Choose Nuke Power
 
Renewable sources and technology to harness them are low carbon emissions and...
Renewable sources and technology to harness them are low carbon emissions and...Renewable sources and technology to harness them are low carbon emissions and...
Renewable sources and technology to harness them are low carbon emissions and...
 

Health and Economic Impacts from Power Plant Emissions in Mexico

  • 1. Atmospheric Environment 39 (2005) 1199–1209 Health impacts from power plant emissions in Mexico M.T. Lo´ pezÃ, M. Zuk, V. Garibay, G. Tzintzun, R. Iniestra, A. Ferna´ ndez Instituto Nacional de Ecologı´a, Perife´rico Sur No. 5000, Col. Insurgentes Cuicuilco, Delegacio´n Coyoaca´n, 04530 D.F. Mexico Received 19 April 2004; accepted 6 October 2004 Abstract Emissions from power plant pose a potentially large risk to human health and the environment. This pollution source is of particular concern in Mexico, where a large share of electricity is generated by the burning of high-sulfur fuel oil. In this paper, we estimate the health impacts due to air pollution from one of the Mexico’s largest power plants, Tuxpan, located on the eastern coast. We calculate the annual average concentrations of primary and secondary (sulfates and nitrates) particulate matter, by modeling representative periods during the year 2001 using the CALPUFF–CALMET modeling system. We find that emissions from the power plant resulted in annual average concentrations of 0.12 mg mÀ3 (min–max: 0.00–1.43) for primary PM2.5, 0.64 mg mÀ3 (0.01–2.84) for secondary PM2.5 and 3.09 mg mÀ3 (0.01–41.54) for SO2 in the 120 km  120 km modeling domain. Such concentrations, while mostly affecting a relatively rural area, could result in significant public health and economic impacts for the local population. It is important to consider such damages when evaluating different electricity generation and control technologies. r 2004 Elsevier Ltd. All rights reserved. Keywords: Health effects; Particulate matter; Power plants; Cluster analysis; Meteorological modeling 1. Introduction Mexican electricity generation has proven to be a large source of air pollution nationwide. The country’s total effective installed capacity in 2003 was 43,727 MW, producing 221 TWh of electricity. The majority of electricity in Mexico is generated from fossil fuel combustion, predominantly fuel oil combustion (41%), but increasingly from burning of natural gas (31.5%). Coal fired power plants only generate 9% of the electricity, while hydropower accounts for 11%, fol- lowed by nuclear (4.5%) and geothermal (3%) (CFE, Comisio´ n Federal de Electricidad, 2004; EIA, Energy Information Administration, 2004). Heavy fuel oil, known as ‘combusto´ leo’, is mostly supplied by Mexico’s state owned petroleum company (PEMEX) and is high in sulfur and trace metals. The typical sulfur content of Mexican ‘combusto´ leo’ is approximately 3–4% (Vijay et al., 2004). Furthermore, most power plants in Mexico do not have any emissions controls installed, resulting in high emissions from the electricity sector. In the year 2001, electricity generation in Mexico accounted for 68% of SO2 emissions, 24% of PM10 emissions and 20% of NOx emissions nationwide (Conzelmann et al., 2003). The Federal Electricity Commission (CFE) owns most of Mexico’s power plants, however approximately 16% of the national capacity, consisting mostly of natural gas plants, is privately owned and sold to the CFE (CFE,Comisio´ n Federal de Electricidad, 2004). Current regulations for power plants are established under the standard NOM-085-ECOL-1994, which sets emissions ARTICLE IN PRESS www.elsevier.com/locate/atmosenv 1352-2310/$ - see front matter r 2004 Elsevier Ltd. All rights reserved. doi:10.1016/j.atmosenv.2004.10.035 ÃCorresponding author. Tel.: +52 5424 6423. E-mail address: mtlopez@ine.gob.mx (M.T. Lo´ pez).
  • 2. limits for all point sources. Lower emissions limits are set for plants in ‘critical zones’ which are primarily located near urban areas. These critical urban zones have mostly converted to natural gas plants, whereas plants located along the coast or near PEMEX refineries have continued to use ‘combusto´ leo’. Emissions from plants in more rural areas, however, may also signifi- cantly impact urban areas that are not necessarily nearby. This study aims to quantify the health impacts from emissions of a specific power plant in Mexico. Many studies from the US and Europe have demonstrated that emissions from power plants in compliance with national standards still result in significant impacts to nearby populations (Levy et al., 2002; European Commission, 1995). No such study, however, has been conducted in Mexico, where population patterns, fuel mixes and meteorology are significantly different. This study is of particular relevance in Mexico, as the government is currently considering reforms on the legal and budgetary framework of this sector and associated changes in emissions standards for electricity production. To determine the impacts of emissions from Mexican power plants on regional air pollution and health, we have conducted a case study on one of the largest and most polluting power plants in Mexico using the CALPUFF lagrangian puff model (Scire et al., 2000a). We consider the annual emissions of SO2, NOx and primary PM2.5 from the power plant stacks. Evidence from Mexico and the US are used to estimate the annual mortality impact and monetary damages from power plant emissions. Finally, we present the uncertainty in the modeling and a sensitivity analysis of certain parameters. 1.1. Adolfo Lo´pez Mateos power plant In this initial case study, we evaluate the impacts of the Adolfo Lo´ pez Mateos power plant, located in the town of Tuxpan in the eastern state of Veracruz. The Tuxpan power plant is the largest power plant in the country in terms of generation, emissions and fuel consumption. It is located on the northern coast of the Gulf of Mexico, which influences the weather of the region. The study region comprises of 7 medium sized towns with a total urban population of 153,000. When rural populations are included, the study population grows to approximately 791,000. The main land use in the study region is cultivation and fields for livestock. The power plant in Tuxpan has 6 steam generators with a total installed capacity of 2100 MW, producing approximately 15,000 GWh of electricity per year. The plant burns roughly 3.4 million m3 of heavy fuel oil each year with an average 3.8% sulfur content (CFE, Comisio´ n Federal de Electricidad, 2002 and Secretarı´a de Energı´a (SENER), 2001, 2002). In addition 1700 m3 of diesel are used per year for start up and for the running of ancillary equipment (CFE, Comisio´ n Federal de Electricidad, 2002 and Vijay, 2004). Continuous emissions measurements are not available for the power plant, therefore we estimate emissions based on standard emissions factors (United States Environmental Protec- tion Agency (USEPA), 1998) and the fuel consumption of the plant. The combustion equipment used at this plant, like other plants in Mexico, are similar in technology to plants from the US and other countries, however differences in operation and maintenance of the equipment could be considerable and introduce a significant uncertainty in the use of emissions factors derived from the U.S (Vijay, 2004). We calculate that total annual emissions from the Tuxpan power plant in 2001 amount to approximately 242,000 tons of SO2, 15,000 tons of NOx and 8000 tons of PM2.5. Table 1 summarizes the average emissions intensities for Tuxpan, Mexico and the US. Tuxpan is the largest power plant emitter of SO2 in North America (Miller and Van Atten, 2004), with emissions intensities (KgMWhÀ1 ) approximately 50% greater than the Mexican average and 4.5 times the US average, due to the high-sulfur content of the ‘combusto´ leo’ it uses. NOx emissions from Tuxpan are of the same magnitude as Mexican and the US averages, whereas PM2.5 emissions for the plant are 10 times higher than the US average and 38% times greater than Mexican average, due to lack of emissions controls and it use of high-sulfur fuels. 2. Methodology 2.1. Atmospheric modeling We use the CALPUFF-CALMET-MM5 modeling system to simulate the dispersion of pollutants in the ARTICLE IN PRESS Table 1 Emissions intensities for the Tuxpan power plant, Mexican average and US average Emissions intensity (kgMWhÀ1 ) Tuxpan Mexican averagea US averagea SO2 17.13 11.35 3.79 NOx 1.47 1.83 1.66 PM2.5 0.54 0.39b 0.05c a Emissions and electricity production for 2002 from Miller and Van Atten (2004). b PM2.5 emissions for 2002 from Vijay (2004). c PM2.5 Emissions for 2002 from United States Environ- mental Protection Agency (USEPA), 2004. M.T. Lo´pez et al. / Atmospheric Environment 39 (2005) 1199–12091200
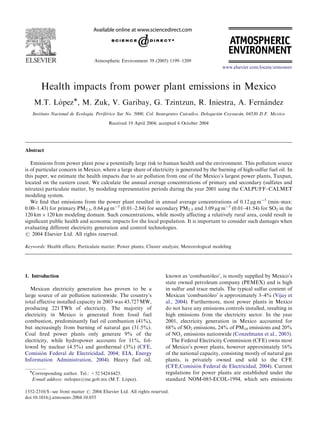
  • 3. modeling domain. We consider a 120 km  120 km modeling domain (Fig. 1), with a resolution of 2 km  2 km and height of 2500 m. The fine resolution was chosen to optimize the reproduction of the sea breeze effect (Ames et al., 2002) and we use a smaller domain than other power plant studies due to limited computing capacity and meteorological data. While similar studies have been able to run air quality models to simulate conditions for an entire year (Levy et al., 2002), the intense computational and data requirements necessary to run the CALPUFF–CALMET-MM5 models for 365 days prevent us from evaluating impacts for an entire year. We therefore rely on statistical methods to select representative periods from the year 2001, which characterize the most frequent meteorolo- gical conditions over the course of the year. The model year 2001 was selected because of its high data quality and availability (Te´ ran, 2003). Information from these periods along with their representativeness can then be combined to estimate annual average conditions (Physick and Goudey, 2001). We do this by conducting a cluster analysis on available meteorological variables and identifying char- acteristic periods to model. Once these periods are defined we use this information to determine an annual average concentration with the following equation (De Nevers, 1995): Cannual ¼ X ci  f i; where ci is the average concentration of period i and fi is the frequency of that period. Using this technique we assume that there are certain meteorological patterns that repeat throughout the year, which can be char- acterized in terms of observable meteorological para- meters (wind speed, temperature, etc.), and that air pollution conditions are similar during these periods (Samson et al., 1990). To select the representative periods, we use surface meteorological information from the Tuxpan, Veracruz, station operated by the National Meteorological Service (SMN). This meteorological station is located in the southwestern corner of the city, approximately 13 km from the power plant. The SMN database contains information averaged over every 10 min for wind direction (1N) and speed (msÀ1 ), barometric pressure (mb), temperature (1C), relative humidity (%) and precipitation (mm). We use cluster analysis, a multivariate statistical technique, to identify representative periods with their respective frequencies from the available meteorological parameters for the region (Samson et al., 1990; Physick and Goudey, 2001). Cluster analysis is an explicit way of identifying groups in raw data sets. We use the Euclidean distance between pairs of observations for the similarity criteria and divisive hierarchy with the tree-clustering algorithm. Wind roses are also used to verify that the wind direction patterns were consistent within the periods. ARTICLE IN PRESS Fig. 1. Modeling domain with population centers. M.T. Lo´pez et al. / Atmospheric Environment 39 (2005) 1199–1209 1201
  • 4. After determining the representative groups, we select specific weeks to model from each of the group by comparing the weekly averaged values of the meteor- ological parameters with the average values for the entire period of the group. We apply the CALPUFF–CALMET-MM5 system to estimate pollutant concentrations for the selected representative weeks. CALPUFF, a non-steady-state Lagrangian Gaussian puff model (Scire et al., 2000a), is run for the selected weeks to determine concentrations of primary PM2.5, SO2, and NOx distributed across the domain for every hour. The model also includes a simple chemical transformation model to calculate the forma- tion of secondary particulate matter species ((NH4)2SO4, HNO3 and NH4NO3) using the MESOPUFFII mechan- ism (Scire et al., 2000a). We use CALPUFF default assumptions for wet and dry deposition parameters as well as for background concentrations of ammonia and ozone. The CALMET model is used to calculate surface wind structures and micrometeorological variables (Scire et al., 2000b). We generate topographical data by analyz- ing satellite images (LAN), whereas we obtain land use data from the National Forest Inventory (Secretarı´a de Agricultura y Recursos Hidra´ ulicos (SARH), 1994). Data from radiosondes from the city of Veracruz, the closest available data to the study region (365 km from Tuxpan), are used to provide vertical profiles of meteorological and thermodynamic parameters. We apply the MM5 model to improve the description of the vertical wind structure (Robe and Scire, 1996). This model is capable of predicting mesoscale flows by incorporating global National Center for Environmental Prediction (NCEP) data. To simulate prevailing meteor- ological conditions during the modeled weeks, we use a 6 km  6 km resolution grid larger than our domain, which is then incorporated into the CALMET model to interpolate from a lower to higher resolution grid. The MM5 model output is used as an ‘‘initial guess field’’ and then adjusted for kinematical effects of terrain, slope flows, and terrain blocking by CALMET, to produce the initial wind fields. These fields are further adjusted by interpolation methods with surface observa- tions and the vertical profile data. In addition to reproducing the wind fields of the region, CALMET uses a micrometeorological module to describe char- acteristics of the mixing layer, three-dimensional fields of temperature and other parameters that CALPUFF uses in its calculation of dispersion. 2.2. Health impacts To determine the public health impacts from exposure to particulate matter (primary and secondary), we analyze the mortality effect due to long-term exposure to such pollutants. Although exposure to particulate matter has been shown to have significant impacts on morbidity outcomes, we chose to limit the scope of our analysis to mortality for two reasons: firstly, informa- tion on morbidity incidence or hospitalization rates were unavailable at the local or state level. Secondly, other analyses (Levy et al, 1999; United States Environmental Protection Agency (USEPA), 1999, 2004) have shown that once monetary values are applied to the health outcomes, the mortality effect due to chronic exposure to particulate matter overwhelms the impacts of short- term mortality and morbidity effects. We explore the sensitivity of our results to the inclusion of morbidity effects in the results section. In order to determine the appropriate concentration– response functions to use, we must turn to US evidence since no studies on the mortality effects from long- term exposure to particulate matter have been conducted in Mexico. There have been several cohort mortality studies conducted in the US. The Six Cities study (Dockery et al., 1993) followed 8111 adults for over 15 years in six US cities. In the recent reanalysis of this study, a 13% increase in mortality per 10 mg mÀ3 in PM2.5 was found (Health Effects Institute (HEI), 2000). The American Cancer Society (ACS) study (Pope et al., 1995) followed approximately 1.2 million adults for over 7 years and found a 6% increase in mortality per 10 mg mÀ3 in PM2.5 (Pope et al., 2002). There have been several other studies, such as the cohorts of Seventh Day Adventists (Abbey et al., 1999) and US Veterans (Lipfert et al., 2000), however it may not be appropriate to generalize their findings to other populations. Although no cohort studies have been conducted in Mexico, several studies have analyzed the mortality effects due to short-term exposure to particulate matter in Mexico City. Such studies have found increases between 1.25% and 1.4% in mortality rates per 10 mg mÀ3 increase in PM2.5 (Castillejos et al., 2000 and Borja-Aburto et al., 1998, respectively). These coefficients appear to be within the range of and perhaps greater than the international evidence on mortality from short-term exposure to particulate matter (Evans et al., 2002). Whether or not a cohort study conducted in Mexico would be comparable to those mentioned above, however, is unknown. Furthermore, conditions in Mexico City are not necessarily representative of the entire country, as it has higher education levels, access to health services and income than most other regions in addition to higher ambient air pollution concentrations. The extent to which these coefficients may represent settings in other Mexican cities or rural settings such as Tuxpan, therefore, is unclear. Given that there have been no cohort studies conducted in Mexico, and since there is no conclusive evidence about which values would best represent Mexican environments, we choose to use results from the ACS study, as it represents the most comprehensive ARTICLE IN PRESS M.T. Lo´pez et al. / Atmospheric Environment 39 (2005) 1199–12091202
  • 5. and perhaps general findings. There exists considerable uncertainty, however, in the use of results generated in other settings to Mexico, due to differences in popula- tion characteristics such as socioeconomic status (SES) and environmental factors. For instance, the ACS study found the largest effects among the least educated and greater effects for sulfate particulates (Pope et al., 2002). The population response from exposure to air pollution may therefore differ between the US and Mexico due to such differences as ambient pollution levels, disease patterns, particle composition, health care, income, lifestyles, education and age structures between the populations. To determine the population at risk of premature mortality due to long-term exposure to particulate matter, we use the fraction of the population analyzed in the ACS study: adults over the age of 30. We make no differentiation in terms of relative risk between age groups, which could introduce a potential bias in our results. To account for the spatial variability of population and concentrations, we use the population- weighted concentrations to calculate health impacts. Finally, since it was not possible to obtain mortality data at the local level, we must rely on state level data (Secretaria de Salud (SSA), 2002). Population data were obtained from the National Institute of Statistics, Geography and Information (Instituto Nacional de Estadı´stica and Geografı´a e Informatica (INEGI), 2001) for the 2000 census. 2.3. Valuation We determine the monetary damages due to the increased mortality risk from exposure to particulate matter using results from a Mexican study on the willingness to pay (WTP) for the reduction in mortality risk. Results from the only contingent valuation study conducted in Mexico City (Hammitt and Ibarrara´ n, 2002) show that the value of a statistical life (VSL) for an adult with an average income of $3500 US dollars per year, is approximately $530,000 US dollars. When compared against the central value for the US used by the USEPA, of $6.5 million dollars (United States Environmental Protection Agency (USEPA), 1999) and the US GDP, the Mexican value indicates an income elasticity of approximately 1.4. All WTP values are adjusted for inflation to the year 2001. The coastal region of the state of Veracruz is primarily lower/middle class, with an average per capita income of approximately $2200 US dollars per year. In contrast, the population of the contingent valuation study of people who lived in Mexico City had an average income approximately 1.5 times greater than that of Veracruz. Therefore, we adjust the VSL of from the Mexico City study to account for the income differential between the two populations, using the income elasticity of 1.4. This calculation yields a VSL for the population of Veracruz of approximately $280,000 US dollars. 3. Results Based on the results from the cluster analysis of meteorological data for the year 2001, we identify 3 main groups. Group 1 consists of 16 weeks (November to February) with winter season characteristics of low temperature, high relative humidity, high surface pres- sure (associated with high cloud cover) and medium precipitation, with a representativeness of 31% of the year. The second group includes 23 weeks (March to June), with average conditions of high temperature, low relative humidity, low surface pressure and zero precipitation, which represents conditions for 44% of the year. Finally, group three, which comprises 12 weeks (August to October), is dominated by high precipitation, coinciding with the Atlantic hurricane season in 2001 (Gray et al., 2001), representing 23% of the year’s conditions. We calculate the divisive coefficient, which measures the amount of clustering structure found, to be 0.83. In group one, the most representative week in terms of its meteorological conditions was the period from the 5th to the 11th of November (Week 1), the 1st to the 7th of June (Week 2) for group two, and the 10th to the 16th of September (Week 3) for group three. It should be noted that the week of the 24th of September did not fall into any group, as its conditions were dominated by hurricane Humberto from the 21st to the 27th of September in 2001, which influenced the rise in precipitation in the Gulf of Mexico (Gray et al., 2001). Table 2 shows the average meteorological variables for each selected week and the standard deviation with respect to their corresponding representative group. Fig. 2 demonstrates the wind direction patterns for the 3 weeks(Fig. 3). Model simulations show that emissions from the power plant result in annual average concentrations for primary PM2.5 of 0.12 mg mÀ3 (min–max: 0.00– 1.43 mg mÀ3 ), 0.57 mg mÀ3 (0.01–2.34 mg mÀ3 ) for ammo- nium sulfate, 0.04 mg mÀ3 (0.00–0.29 mg mÀ3 ) for nitric acid, 0.03 mg mÀ3 (0.00–0.2 mg mÀ3 ) for ammonium nitrate and 3.09 mg mÀ3 (0.01–41.54 mg mÀ3 ) for SO2 in the 120 km  120 km modeling domain. The plumes of secondary PM2.5 concentrations reach beyond the modeling domain, indicating a possible underestimate in the calculation of total impacts (Figs. 4). Emissions from the power plant could result in approximately 30 deaths annually. After applying the appropriate value of statistical life for the region, we find the total social cost of the power plant emissions to be approximately 8 million US dollars in 2001. Secondary particulate matter formation contributes over 80% to ARTICLE IN PRESS M.T. Lo´pez et al. / Atmospheric Environment 39 (2005) 1199–1209 1203
  • 6. ARTICLE IN PRESS Fig. 2. Wind roses for the three selected weeks. Table 2 Meteorological characteristics of representative groups and weeks Group 1 Group 2 Group 3 Week 1 S.d. Week 2 S.d. Week 3 S.d. Wind speed (m sÀ1 ) 4.5 0.7 3.8 1.2 3.8 0.5 Temperature (1C) 22.2 2.9 29 3.8 27 1.5 Relative humidity (%) 91.5 2.3 87.6 1.9 91.4 1.4 Barometric pressure (mb) 1021.1 4.4 1007.2 6 1012.7 2.6 Precipitation (mm) 19 16.8 0 12.8 127 62.6 Cloudiness High N/A Zero N/A Very high N/A M.T. Lo´pez et al. / Atmospheric Environment 39 (2005) 1199–12091204
  • 7. ARTICLE IN PRESS Fig. 3. Annual average primary PM2.5 concentrations. Fig. 4. Annual average secondary PM2.5 concentrations. M.T. Lo´pez et al. / Atmospheric Environment 39 (2005) 1199–1209 1205
  • 8. the mortality impacts, most of which comes from sulfate formation (73% of total impacts), resulting from high SO2 emissions. 3.1. Sensitivity analysis Although we use point values for the calculation of health damages, there exists a wide range of uncertain- ties in this analysis as described in Table 3, which may have potentially large effects on our results. Much of this uncertainty is difficult to quantify. We are, however, able to analyze the sensitivity of the results based on a few assumptions in the health effects, valuation and atmospheric modeling parts of the analysis. The model shows to be especially sensitive to the inclusion of mortality impacts due to long-term SO2 exposure. Due to the high emissions and population exposures to SO2, this could result in significant damages to human health. Using the results from the HEI reanalysis of the ACS study (0.5%) (Krewski et al., 2000), emissions from the power plant could increase our mortality estimates by a factor of 5. It should be noted, however, that no studies in Mexico have identified SO2 as a risk factor for mortality, and the international evidence of a mortality effect from SO2 exposure is also weak. As discussed in the methodology section, we simplify the analysis by evaluating only mortality effects. To test the importance of quantifying morbidity effects, we evaluate a set of 14 morbidity outcomes, including cardiovascular and respiratory hospital admissions and emergency room visits, chronic bronchitis and restricted activity days using combined evidence from Mexico and the US (Evans et al., 2000; Cesar et al., 2002). Incidence and valuation data for morbidity outcomes are derived from Mexico City (McKinley et al., 2003), therefore potentially biasing our results. Information on hospita- lizations and direct costs come from the Mexican Institute of Social Security (IMSS), while WTP values for chronic bronchitis and restricted activity days are derived from the same study as that used for the VSL estimate (Hammitt and Ibarrara´ n, 2002). A full discus- sion on the methodology and data used to evaluate morbidity impacts can be found in McKinley et al. (2003). Once morbidity outcomes are included, our damages results increase by approximately a factor of 2. Other studies have shown that results are fairly insensitive to parametric uncertainty in the CALPUFF model (Levy and Spengler, 2002). Here we test three parametric assumptions in the CALPUFF model—the chemical mechanism and the background ammonia and ozone concentrations. When we apply RIVAD/ARM3 chemical mechanism instead of MESOPUFF II we find that (NH4)2SO4 benefits are slightly reduced (22%) while NH4NO3 benefits increase on approximately the same scale (34%). These results show that the mechan- ism choice has little effect on the benefits estimates. To test the default assumptions used by CALPUFF for background ozone concentrations, which are used as a surrogate for OHÀ in the MESOPUFF II mechanism, we adjusted these concentrations based on recent findings from a measurement campaign in Tuxpan ARTICLE IN PRESS Table 3 Uncertainty in modeling assumptions Parametera Potential uncertainties Emissions inventory Emissions factors derived from the US apply to Mexican conditions Emissions remain constant throughout the year Atmospheric modeling 120 km  120 km modeling domain Default CALPUFF concentrations of ozone and ammonia Use of meteorological data from distant stations Period selection Representativeness of selected weeks Representativeness of the year 2001 Health effects Linear concentration response functions with no thresholds Only mortality evaluated Equal toxicity for all particle compositions Constant relative risk for all adults above 30 Relative risk values from US studies apply to Mexico Valuation The single Mexican study represents the correct WTP values for Mexico VSL values scale with income a Adapted from Levy and Spengler (2002). M.T. Lo´pez et al. / Atmospheric Environment 39 (2005) 1199–12091206
  • 9. during the first weeks of November 2003 (Zaragoza, 2004). It was found that local ozone levels were approximately 4 times lower than the default values in CALPUFF. As the month of November falls during the rainy season, we only modify the ozone values in Group 1, since no information for other seasons was available. Due to the rain, however, Group 1 turns out to be the least polluted season, and thus there are no significant changes in the results when we modify the ozone concentrations for this season. Similar studies (Levy et al., 2002; Levy and Spengler, 2002) have tested the default background ammonia concentration of 10 ppb in CALPUFF, and found that when reducing the ammonia concentration to 1 ppb, the results for secondary nitrate are reduced by 30%. No information is available on the true ammonia concen- trations in the study region. Only one published study has measured ammonia concentrations in Mexico (Moya et al., 2001). This study found concentrations between 4 and 30 ppb during March of 1997 in Mexico City. Unfortunately, this information is not very relevant to the Tuxpan region, which is predominantly agricultural. Another study (Carmichael et al., 2003) measured ammonia concentrations in 50 stations around the world, including 6 rural sites in South America. Each of these sites found average concentrations of o1 ppb. We therefore test the assumption that ammonia back- ground levels were 1 ppb throughout the year and find a reduction of approximately 1% in total damages. There exists considerable uncertainty in the methods used to derive the value of a statistical life. Within the US body of literature there is substantial variability in study findings, with a factor of 10 difference between results of WTP for mortality risk reduction studies (Viscusi, 1993). We use preliminary results from the single study conducted in Mexico. However, results within this study using hedonic wage estimates found a range for VSL between $230,000 and $320,000 (Ham- mitt and Ibarrara´ n, 2004). Using these values, our results could be reduced by up to 504%. Given the variability shown between other studies, the uncertainty in this parameter could be considerably high. Finally, one important limitation of this study is the relatively small domain evaluated in the atmospheric modeling. Other studies have shown that impacts from power plant emissions can reach populations over 300 km away from the source (Levy et al., 2002). Furthermore, it is apparent from Fig. 4 that concentra- tions extend beyond the modeling domain. If the domain were to be extended to 600 km  600 km, the population under analysis would expand to over 39 million people, since many large population centers are located nearby. To test the impact of the domain size on our results, we extrapolate the plume, using linear planar regression and kriging interpolation. With the assump- tion that concentrations are zero at the extended domain boundary, we find that mortality could increase by a factor of 4 and damages could rise to 40 million dollars. 4. Discussion and conclusions This study shows that it is possible to estimate the potential impacts of power plant emissions even with scarce meteorological and health data and significant computational limitations. We also show that although such plants may be complying with national standards, their emissions still have significant impacts on the health of the surrounding population. In the case of Tuxpan, these emissions could result in 30 premature deaths per year in the nearby region. This corresponds to approximately $530 US dollars per GWh in health damages. These results are on the lower end of findings of damages per GWh from other studies (Levy et al., 1999), mostly due to the small domain size, therefore only capturing the impacts on a small population, and the lower VSL for Mexico. In total, emissions from the power plant contribute 1.66 mg mÀ3 to the population weighted annual average PM2.5 concentrations (0.76 mg mÀ3 for the non-popula- tion-weighted annual average). In comparison with other studies (Levy et al., 2002; Levy and Spengler, 2002) our results appear to be rather high. This may be due to the small domain, as concentrations tend to be higher closer to the source, and therefore we capture only high concentration regions in the average. Further- more, in the population weighted concentrations, regions of high concentrations are much more heavily weighted than regions of low concentrations, as the larger population centers are located closer to the source (see Fig. 1) and the plume does not tend to extend eastward towards the sea. Although the resultant concentrations from emissions of this power plant are relatively small, it is important to recognize that we have modeled only one source from all possible sources in the region. Therefore, while it is expected that air quality standards would not be exceeded from this one plant, stricter regulation may still be justified. Further analysis is necessary to determine appropriate control options to mitigate the power plant emissions. In the sensitivity analysis we show how uncertainties in various parameters can affect our estimates. The results appear to be most sensitive to the inclusion of impacts from SO2 concentrations and the expansion of the modeling domain. The model, however, appears to be relatively insensitive to parameter assumptions in the atmospheric modeling. The uncertainties in several of the parameters that were not quantified, such as the use of US concentration response values and emissions factors, are probably significant. ARTICLE IN PRESS M.T. Lo´pez et al. / Atmospheric Environment 39 (2005) 1199–1209 1207
  • 10. In order to apply this type of analysis to the policy- making process, several key uncertainties should be resolved. Future analyses should include the expansion of the modeling domain, simulation over an entire year, incorporation of other pollutants and non-health impacts, and validation of the air quality model. We show that emissions from power plants can have a potentially large impact on public health and that the use of the damage function approach is both feasible and informative to the policy-making processes in Mexico. Acknowledgements We thank Leonora Rojas Bracho, Samudra Vijay, Galen Mckinley, and Andrew Wilson for their helpful comments on the project and article and Gabriela Cuevas Garcı´a of INE for her assistance in preparing the land use data. We appreciate the help of Angel Tera´ n Cuevas and Francisco Mejia of the SMN in acquiring meteorological data. References Abbey, D.E., Nishino, N., McDonell, W.F., Burchette, R.J., Knutsen, S.F., Beeson, W.L., Yang, J.X., 1999. Long-term inhalable particles and other pollutants related to mortality of non-smokers. American Journal for Respiratory and Critical Care Medicine 159, 373–382. Ames, M.R., Zemba, S.G., Yamartino, R.J., Valberg, P.A., Green, L.C., 2002. Comments on: using CALPUFF to evaluate the impacts of power plant emissions in Illinois: model sensitivity and implications. Atmospheric Environ- ment 36, 2263–2265. Borja-Aburto, V.H., Castillejos, M., Gold, D.R., Bierzwinski, S., Loomis, D., 1998. Mortality and ambient fine particles in southwest Mexico City, 1993–1995. Environmental Health Perspectives 106, 849–856. Carmichael, G., et al., 2003. Measurements of sulfur dioxide, ozone and ammonia concentrations in Asia, Africa, and South America using passive samplers. Atmospheric En- vironment 37, 1293–1308. Castillejos, M., Borja-Aburto, V., Dockery, D., Loomis, D., 2000. Coarse particles and mortality in Mexico City. Inhalation Toxicology 12 (Supp 1), 61–72. Cesar, H., et al., 2002. Economic Valuation of Improvement of Air Quality in the Metropolitan Area of Mexico City. Comisio´ n Ambiental Metropolitana (CAM) and World Bank, Mexico City, Mexico. Comisio´ n Federal de Electricidad (CFE) 2002. Informe de Operacio´ n 2001, Me´ xico, DF. Comisio´ n Federal de Electricidad (CFE) 2004. Generacio´ n. Me´ xico DF. http://www.cfe.gob.mx/www2/QueEsCFE/ informacion/Generacion/. Conzelmann, G., Quintanilla, J., Aguilar, V., Conde, L., Ferna´ ndez, J., Mar, E., Martı´n del Campo, C., Serrato, G., Ortega, R., 2003. Mexico’s long-term energy outlook, results of a detailed energy supply and demand simulation. Argonne National Laboratory, Argonne, IL. De Nevers, N., 1995. Air Pollution Control Engineering. McGraw-Hill, New York (Chapter 6). Dockery, D.W., Pope 3rd, C.A., Xu, X., Spengler, J.D., Ware, J.H., Fay, M.E., Ferris Jr., B.G., Speizer, F.E., 1993. An association between air pollution and mortality in six US cities. New England Journal of Medicine 329 (24), 1753–1759. EIA, Energy Information Administration, 2004. Mexico Country Analysis Brief. http://www.eia.doe.gov/emeu/ cabs/mexico.html. European Commission, 1995. ExternE: External Costs of Energy: Oil and Gas, vol. 4. Directorate-General XII, Science, Research and Development, Brussels. Evans, J., Spengler, J., Levy, J., Hammitt, J., Suh, H., Serrano, P., Rojas-Bracho, L., Santos-Burgoa, C., Rojas-Rodriguez, H., Caballero-Ramirez, M., Castillejos, M., 2000. Contam- inacio´ n atmosfe´ rica y salud humana en la Ciudad de Me´ xico. MIT-IPURGAP Report No. 10. Evans, J., Levy, J., Hammitt, J., Santos-Burgoa, C., Castillejos, M., 2002. Health benefits of air pollution control. In: Air Quality in the Mexico Megacity: An Integrated Assessment. Kluwer Academic Publishers, Boston. Gray, W.M., Landsea, C.W., Blake, E., Mielke, P.W., Berry, K.J., 2001. Summary of 2001 Atlantic tropical cyclone activity and verification of authors’ seasonal activity forecast. Department of Atmospheric Science, Colorado State University. Hammitt, J., Ibarrara´ n, M., 2002. Estimating the economic value of reducing health risks by improving air quality in Mexico City. Preliminary Results. Hammitt, J., Ibarrara´ n, M., 2004. Estimating the economic value of reducing health risks in Mexico city: compensating wage differentials. Harvard University, Cambridge, MA. Health Effects Institute (HEI), 2000. Reanalysis of the Harvard Six Cities Study and the American Cancer Society Study of Particulate Air Pollution and Mortality. Cambridge, MA. Instituto Nacional de Estadı´stica, Geografı´a e Informatica (INEGI), 2001. Marco Geoestadı´stico municipal, 2000, Mexico. Krewski, D., Burnett, R.T., Goldberg, M.S., Hoover, K., Siemiatycki, J., Jarrett, M., Abrahamowicz, M., White, W.H., 2000. Particle Epidemiology Reanalysis Project. Part II: Sensitivity Analyses. Health Effects Institute, Cam- bridge, MA. Levy, J., Spengler, J., 2002. Modeling the benefits of power plant emission controls in Massachusetts. Journal of Air and Waste management Association 52, 5–18. Levy, J., Hammitt, J.K., Yanagisawa, Y., Spengler, J.D., 1999. Development of a new damage function model for power plants: methodology and applications. Environmental Science and Technology 33, 4364–4372. Levy, J., Spengler, J., Hlinka, D., Sullivan, D., Moon, D., 2002. Using CALPUFF to evaluate the impacts of power plant emissions in Ilinois: model sensitivity and implications. Atmospheric Environment 36, 1063–1075. Lipfert, F.W., Perry Jr., H.M., Miller, J.P., Baty, J.D., Wyzga, R.E., Carmody, S.E., 2000. The Washington university- EPRI veterans’ cohort mortality study: preliminary results. Inhalation Toxicology 12 (Supp. 4), 41–73. ARTICLE IN PRESS M.T. Lo´pez et al. / Atmospheric Environment 39 (2005) 1199–12091208
  • 11. McKinley, G., Zuk, M., Hojer, M., Avalos, M., Gonzalez, I., Herna´ ndez, M., Iniestra, R., Laguna, I., Martı´nez, M.A., Osnaya, P., Reynales, L.M., Valde´ s, R., Martı´nez, J., 2003. The local benefits of global air pollution control in Mexico City. Final Report to the US Environmental Protection Agency and the US—Mexico Foundation for Science, Mexico City. Miller, P.J., Van Atten, C., 2004. North American Power Plant Air Emissions 2002. Commission for Environmental Co- operation, Montreal, Canada. Moya, M., Ansari, A., Pandis, S., 2001. Partitioning of nitrate and ammonium between the gas and particulate phases during the 1997 IMADA-AVER study in Mexico City. Atmospheric Environment 35, 1791–1894. Physick, W.L., Goudey, R., 2001. Estimating an annual- average RSP concentration for Hong Kong using days characteristic of the dominant weather patterns. Atmo- spheric Environment 35, 2697–2705. Pope, C., Thun, M., Namboodiri, M., Dockery, D., Evans, J., Speizer, F., Heath, C., 1995. Particulate air pollution as a predictor of mortality in a prospective study of US adults. American Journal of Respiratory Critical Care Medicine 151, 669–674. Pope III, C.A., Burnett, R.T., Thun, M.J., Calle, E.E., Krewski, D., Ito, K., Thurston, G.D., 2002. Lung cancer, cardio- pulmonary mortality, and long-term exposure to fine particulate air pollution. JAMA 287, 1132–1141. Robe, F.R., Scire, J.S., 1996. Combining mesoscale prognostic and diagnostic wind models: a practical approach for air quality applications on complex terrain. Paper 5B.4, Preprints 10th Joint Conference on the Applications of Air Pollution Meteorology. Phoenix, Arizona. Samson, P.J., Brooks, J.R., Sikknab, S., 1990. Estimation of seasonal and annual acidic deposition through aggregation of 3-day episodic periods. EPA-600/3-90/059, Atmospheric Research and Exposure Assessment Laboratory, US Environmental Protection Agency, Research Triangle Park, NC. Scire, J.S., Strimaitis, D.G., Yamartino, R.J., 2000a. A User’s Guide for the CALPUFF Dispersion Model (Version 5.0). Earth Tech, Inc., Concord, MA. Scire, J.S., Robe, F.R., Fernau, M.E., Yamartino, R.J., 2000b. A User’s Guide for the CALMET Meteorological Model (Version 5.0). Earth Tech. Inc., Concord, MA. Secretarı´a de Agricultura y Recursos Hidra´ ulicos (SARH), 1994. Inventario Nacional Perio´ dico. Subsecretarı´a Forestal y de la Fauna Silvestre, Me´ xico. Secretarı´a de Energı´a (SENER), 2001. Prospectiva del sector ele´ ctrico 2001–2010. 1a , Edicio´ n, Me´ xico, DF. Secretarı´a de Energı´a (SENER), 2002. Programa de Energı´a y Medio Ambiente: Hacia el Desarrollo Sustentable. Me´ xico, DF. Secretaria de Salud (SSA), 2002. Mortalidad 2001. Me´ xico, DF. http://www.salud.gob.mx/apps/htdocs/estadisticas/mortalidad/ mortalidad.htm. Te´ ran, A., 2003. Personal communication. National Meteor- ological Service, Mexico City, Mexico. United States Environmental Protection Agency (USEPA), 1998. Compilation of Air Pollutant Emission Factors, fifth ed. vol. I, External Combustion Sources, AP-42 (Chapter 1). United States Environmental Protection Agency (USEPA), 1999. The Benefits and Costs of the Clean Air Act, 1990–2010. EPA Report to Congress (EPA-410-R-99-001). United States Environmental Protection Agency (USEPA), 2004. Air Emissions Trends; http://www.epa.gov/airtrends/ econ-emissions.html. Vijay, S., 2004. Personal communication. Massachusetts Institute of Technology, Boston, MA. Vijay, S., Molina, L.T., Molina, M., 2004. Estimating Air Pollution Emissions from Fossil Fuel use in the Electricity Sector in Mexico. Massachusetts Institute of Technology, Boston, MA. Viscusi, W., 1993. The value of risks to life and health. Journal of Economic Literature 31, 1912–1946. Zaragoza, J., 2004. Personal communication. CENICA, Me´ xico City, Me´ xico. ARTICLE IN PRESS M.T. Lo´pez et al. / Atmospheric Environment 39 (2005) 1199–1209 1209