VRA 2012, Embedded Metadata, Embedding Metadata in Image Files at Cal Poly, San Luis Obispo

Presented by Sheryl Frisch at the Annual Conference of the Visual Resources Association, April 18th - April 21st, 2012, in Albuquerque, New Mexico. Session: Embedded metadata in cultural image collections and beyond Over the past few years visual resources professionals have increasingly been using embedded metadata as an effective way to collect initial cataloging data, to ensure the delivery of key information with images, to archive image information, and to link VRA Core 4 with other schemas in the larger digital imaging environment. The activities and case study examples presented by panel members will include improving workflow efficiency within visual resources operations and developing ongoing relations with the International Press Telecommunications Council, a pioneer in embedding metadata into images. While this work addresses the immediate needs of visual resources for art, architecture, and related fields, it simultaneously looks outward to the increasing interoperability of all digital materials available in library collections and on the world wide web. ORGANIZER & MODERATOR: Steve Tatum, Virginia Tech PRESENTERS: 1: Sheryl Frisch, California Polytechnic State University, San Luis Obispo 2: Joshua Lynn and Heidi Raatz, Minneapolis Institute of Arts 3: Gregory Reser, University of California, San Diego 4: Steve Tatum, Virginia Tech

Recomendados
Recomendados
Más contenido relacionado
Destacado
Más de Visual Resources Association
Más de Visual Resources Association (20)
Último
Último (20)
VRA 2012, Embedded Metadata, Embedding Metadata in Image Files at Cal Poly, San Luis Obispo
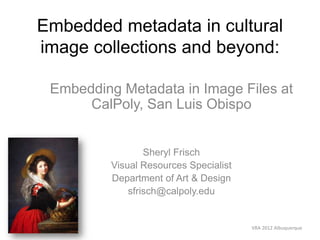
- 1. Embedded metadata in cultural image collections and beyond: Embedding Metadata in Image Files at CalPoly, San Luis Obispo Sheryl Frisch Visual Resources Specialist Department of Art & Design sfrisch@calpoly.edu VRA 2012 Albuquerque
- 2. Why? kans3637.jpg vs. Vigee-Lebrun. Portrait of Marie Gabrielle de Gramont, Duchesse de Caderousse.jpg VRA 2012 Albuquerque
- 3. S Size up the situation U Use what’s available R Remember where you are v Vanquish fear, solve the problem (expectations vs. reality) i Improvise v Value living a Act l Learn basic skills (“Learn by doing”) -- Adapted from, “The U.S. Army Survival Manual: Department of the Army Field Manual 21-76” VRA 2012 Albuquerque
- 4. Size up the situation Art & Design program (BFA) • Graphic Design • Photography • Studio Art Staffing • 1 VR professional curator, 10 months • 2-5 student assistants, non-art majors Budget:Primarily for student assistants VRA 2012 Albuquerque
- 5. Use what’s available At the time: • Beige Mac • Students • Slide scanner • Photoshop • FileMaker (text based) used for slides and digital images VRA 2012 Albuquerque
- 6. Evolution of Embedding Metadata Initially the file name is placed in the “Document Title” field Next, data is made to “fit” into Adobe’s XMP fields VRA 2012 Albuquerque
- 7. Custom File Info Panels 3 Panels were created: • Creator • Work • Image VRA 2012 Albuquerque
- 8. Bridge Palettes Creator Image Work VRA 2012 Albuquerque
- 9. Pre-Cataloging in Bridge CS3 • Students enter data for each image • Data is embedded into the image • Includes batch processing VRA 2012 Albuquerque
- 10. Pre-Cataloging in Bridge CS3 – Exporting Data Script exports selected metadata VRA 2012 Albuquerque
- 11. Data is reviewed and corrected VRA 2012 Albuquerque
- 12. Data is imported back into the file VRA 2012 Albuquerque
- 13. Example correction Before After • Users can search on any term • Image information is no longer dependent on a database • Data can be cleanly exported and imported VRA 2012 Albuquerque
- 14. Repurpose Data • Database (import/ingest) EmbARK • Course Web Sites – Web – Blackboard – Moodle (PolyLearn) VRA 2012 Albuquerque
- 15. RepurposedData - Image Caption • Captions provided by faculty • Imported into “Description Field” • Web pages automatically generated • Uploaded to Web, BB, Moodle VRA 2012 Albuquerque
- 16. Ideal Workflow Low Source • Images oriented & cropped * Scanned • Saved as Tiffs Metadata • Data entered Embedded • Reviewed, peer checked Images • Color, contrast, etc. Edited • Resized Curator • Data reviewed • Images reviewed & distributed High * Faculty can obtain images at different points Quality throughout the workflow. VRA 2012 Albuquerque
- 17. VRA’s Custom Panel VRA 2012 Albuquerque
- 18. Beyond: The CSU Panel VRA 2012 Albuquerque
- 19. CSU Visual Collective - DSpace VRA 2012 Albuquerque
- 20. CSU Visual Collective - DSpace Full Record Source Data VRA 2012 Albuquerque
- 21. CSU Visual Collective Future Feature: Google Books • Online access to original source • Link to library resources VRA 2012 Albuquerque
- 22. CSU Visual Collective VRA 2012 Albuquerque
- 23. S Why? U Deluge of images R v • 250 million images are uploaded to Facebook each day • 4.2 million Flickr each day, 51 million registered i members v How will we survive without Embedded Metadata? a l Image removed due to copyright. See: Erik Kessels, installation, printed all images posted to Flickr in a 24, hour period. 350,000 prints. Foam, Amsterdam. 2011.@: http://www.foam.org/foam-amsterdam/exhibitions/whatsnext/kessels VRA 2012 Albuquerque
- 24. Thank You John Vu Greg Reser, UC San Diego Dr. Kathleen Cohen, CSU Image Program CSU Center for Distributed Learning Marvin Pollard, CSU Systemwide Digital Library Services CSU Visual Resources Specialists Images courtesy of: Kathleen Cohen, CSU WorldImages (http://worldimages.sjsu.edu) VRA 2012 Albuquerque
Notas del editor
- It’s VRA’s 30th anniversary and in the first day of this conference we are talking about embedding metadata into image files. The EmbARK User’s group just saw a demo of how to move data from the EmbARK database to image files using the VRA custom panel and export/import scripts. By now, we are familiar with the advantages of embedding descriptive metadata into image files and how it can help us with our digital workflow. As we continue this practice, we are starting to learn more about the interoperability of embedded metadata and the tools that allow us to work with it. Beyond describing images, we are learning different ways it can connect us to digital materials in collections and on the Web. While it can facilitate cataloging, it can also assist users, faculty and students, by serving as a gateway to discover more material to further scholarship. This case study will illustrate the practice of embedding metadata into image files at CalPoly, from its early stages to today. It will show the evolution from using embedded metadata as a method of applying descriptive label information to images, to its use in cataloging, and how it can lead to the discovery of digital resources that enhance teaching and learning.
- At CalPoly we’ve been embedding descriptive metadata into our image files for some time now – since 2004. Why did we do this? It was a result of working with one of our art history faculty. He was the first of our faculty, to move from slides and use digital images to teach his courses as well as offer students course Web sites for online study. On several occasions, he would come into the then Slide Library asking for information, not images. It might be the date of a work, or the name of the museum where the work was located - basically information that was previously found on the slide label. This involved looking up the filename for the image that he was working with in our FileMaker database. Usually we found what he was looking for, but it took some time. Being resourceful and wanting to solve this problem, he would change the filename so that it would include some of the label information. Unfortunately, this removed the only connection that the image had to our database. Clearly, we needed a way to have descriptive information accessible in the new digital format. At the very least, we needed a reliable way to look it up in our database. You may recall that early in the transition to digital images, the discussion focused primarily on image quality. It was felt that slides were of a higher quality than digital images and therefore there was some resistance to changing to the new format. Yet, faculty also needed the data that accompanied the image. There was a single user database that existed on a desktop, but no online resource where faculty could remotely access information. For slides, the data appeared on the slide label, however there was no equivalent for the digital image or so we thought. At the same time, I was trying to sell digitization to the faculty in the hopes of acquiring the appropriate software, equipment, and staffing – this way we could move forward and welcome the digital age with open arms. Yet, we couldn’t readily provide basic data about the image in digital format – this was one more check in the “con” column. We didn’t have the resources that we needed and the question became – how are we going to provide services? The reality of what we had, did not add up to what was expected for a digital workflow. So the real reason for embedding metadata was:
- S.U.R.V.I.V.A.L. Acronym is adapted for the U.S. Army manual on survival (Headquarters, Department of the Army: The U.S. Army Survival Manual: Department of the Army Field Manual 21-76. Ulysses Press, 2009, p.3.). S Size up the situationU Use what’s availableR Remember where you areV Vanquish fear, solve the problem (expectations vs. reality)I ImproviseV Value living A Act L Learn basic skills (“Cal Poly - Where Learn by Doing Transforms Lives”) -encourages experimentation and entrepreneurship
- S Size up the situation (resources)I Promise not to go through the entire acronym, but some background is helpful. CalPoly – is a four year “comprehensive public university” where “academically focused” students can obtain a “hands-on”, “learn by doing” educational experience. The Art and Design program offers a BFA in Art & Design with concentrations in: Graphic DesignPhotography Studio Art (No art history major or minor at that time) Art History Area – support courses for the concentrations and the university's general education courses. Visual Resources Collection - The VRC’s purpose is to support teaching and learning. Our first priority is to provide images for the classroom and for remote study on course Web sites and courses in Learning Management Systems (LMS) such as Blackboard, Moodle (PolyLearn). Staffing: 1 professional curator, 10 months with additional duties as assigned –Art and Design Resource Center – student center2-5 student assistants, mostly undergraduates and typically non-art majorsBudget: Primarily supports student assistants, large course support
- Use what’s available At the time:Beige MacStudents Slide scannerPhotoshop (CS2)FileMaker (text based) database used for slides and digital images
- Evolution of embedding descriptive metadataWe started by entering the filename into the “Document Title” field of Photoshop’s (CS2) XMP panel. This way when our faculty changed the filename we could locate it and look it up in our FileMaker database thus allowing us to find the descriptive data. This involved too many steps to be practical. Next, we tried “fitting” the data into Photoshop’s XMP panels. Since our faculty have access to Photoshop on their desktops, this efficiently solved the problem of having descriptive information accessible. They could now view the information in File Info in Photoshop. Faculty could search their computer on any term and the image would be found.Image information is no longer dependent on a database. At the time we did NOT have export or import scripts to move the data around so we ended up entering data twice, once in the panel and then again in the FileMaker database. This was inefficient. Ideally we wanted to enter data once. We started looking for scripts that would help us move the data. The earliest ones that were found, allowed us to export the data out of the panels and after a few steps into an Excel spreadsheet. Here, data had to be cleaned up, before it could be imported into FileMaker. This was very time consuming. It was clear that if the data could be exported cleanly, less data processing would be required and we could move it to the database with fewer steps. We seemed so close. If we could customize our own panel and export clean data, we would be set. Then one day a miracle happened. We were hiring students and one came in for an interview - a computer science student who loved Photoshop and wanted to work with it.
- Creator, Work, Image panels – Info panels After researching Custom File Info panels, reading Adobe’s XMP documents, and JavaScript References for Adobe Bridge and Photoshop, our computer science student developed three custom panels as well as export and import scripts written in JavaScript. The Creator, Work and Image panels are text files. The VRA Core served as the guidelines for the fields. The panels were designed by a student to be used by student assistants. The student perspective was key since students would be capturing the data.
- Creator, Work, Image palettes – Bridge The custom panels could also be accessed in Adobe Bridge’s metadata palettes for bulk or batch cataloging.
- Pre-cataloging in Bridge CS3 •Students enter data for each image•Data is embedded into the image•Includes batch processing - Images with fields having the same data (source, provider) could be filled out simultaneously for a group of images. For example, when you have several works by the same artist, common data (Creator, Creator’s role, Creator Dates), could be entered into several recordssimultaneously.
- Exporting data from BridgeExport Script – written in JavaScript - exports selected data.
- Review Metadata in Spreadsheet Data is cleanly exported, reviewed and checked. All the data entry features of Excel are available for bulk corrections.
- Import script Corrected data is imported back into the image file - all data, or only the corrections – whatever is desired.
- Example of Correction – Before and After Here the Description field has been filled.Now that the data is clean, it can be repurposed…
- Repurpose DataData can be moved to databases – at the time, it was FileMaker - now EmbARK, and the CSU’s Visual Collective. Data is imported using an Excel spreadsheet by mapping fields on the spreadsheet to those in the database. Repurposed for: Course Web Sites, Blackboard or Moodle (PolyLearn)
- Course Web pages. Blackboard, Moodle, PolyLearn Take advantage of export/import tools:Captions provided by faculty preferably in an Excel spreadsheet with filenames and the information that they would like their students to study. Captions are imported into the Description FieldWeb pages automatically generated by Photoshop/Bridge’s Web GalleryUploaded to Web. For Blackboard, Moodle (PolyLearn) ,zip files of the Web Gallery are created, uploaded and “unzipped” in Blackboard or PolyLearn.
- WorkflowIn addition to our resources, we also need to accommodate three, ten week quarters. As a result, a flexible workflow where faculty are able to receive their images throughout the digitization process was developed. Obviously, high quality images and data require more time. Typically our faculty give us generous lead times. Also, images given quickly to faculty can be replaced with higher quality versions at a later moment. Source is scanned and images are oriented and cropped. Student enters data. Once all the data is entered for a group of images, it is exported to an Excel Spreadsheet. There, students review their work. Corrections to data are imported back into the image files. Images are given to another student for peer checking. Images are edited and resized. Reviewed by Curator – corrections made.Curator distributes:Faculty – server, portable hard drives, emailDatabases (EmbARK – Visual Collective)Archived The workflow can also adjust to the abilities of the student workforce. Several students can work on one order, enter data and process the images. Some students are quite good with data entry, while others have a knack for editing images and working in Photoshop. A Peer Checking step where students correct each others work, was created. Data entry improved. Fresh eyes..
- VRA’s Custom Panel With Photoshop CS4, Adobe changes the way custom panels work with the program and we can no longer use our text panels. Fortunately, we can now use the VRA panel.
- Beyond: The CSU Panel Still, we continue to work with embedded metadata and develop tools that allow us to manipulate data. Panels can be customized and tailored to specific projects. With the help of Greg Reser (UCSD) a panel has been customized for use in the California State University System. Its purpose is to streamline the data workflow from capture to upload in the CSU system’s Visual Collective. The Visual Collective is an image repository that can be shared by the 23 campuses in the system. It is built in DSpace, an open source program for digital repositories. DSpace accommodates most repository collections throughout the CSU system. Programs developed to handle images have been added on with some success. Under development – the Visual Collective contains approximately 400 images – and is in the beta phase. In the future other open source programs will be integrated for the user interface while DSpace will serve on the backend. Evolve and change. Proof of concept. With the CSU panel we have moved from labeling images to a full fledge cataloging tool. We needed to provide more granularity of data than the VRA panel offered - where display fields are used. Greg will demonstrate some of itsfeatures in his presentation.
- CSU Visual Collective – Dspace Adélaïde de Labille-Guiard. Adélaïde de of France, Daughter of Louis XV, known as Madame Adélaïde de. 1787. Versailles, Musée National du Château de Versailles et du TrianonURI: http://hdl.handle.net/10211.6/303Simple item view. Maps to Dublin Core. Thumbnail images. Images sized for PowerPoint. JPEG2000 format allows for zooming in the djatoka viewer. Faculty can zoom in on specific areas of the work and create their own details. A full view of the record is also available.
- CSU Visual Collective – Dspace - Source Data Full Item Record: DSpace can be integrated with other tools in the CSU – system such as our Libraries. For example, source information can lead to other resources in the system. The student user can easily locate the source of an image in the full record view and in the metadata when the image is downloaded. Source Data
- Visual Collective – Dspace – Google Books With source information the student can go back to the source of the image either online on Google Books or link to a library. http://books.google.com/books?id=XJkvjgxwby4C&pg=PA140&dq=Ad%C3%A9la%C3%AFde+de+Labille-Guiard:+The+Artist+in+the+Age+of+Revolution/Laura+Auricchio.+Los+Angeles,+CA:+The+J.+Paul+Getty+Museum,+2009.+ISBN:+9780892369546.&hl=en&sa=X&ei=SligT5itB6bjiAL2gtCNAg&ved=0CDQQ6AEwAA#v=onepage&q&f=falseBook citation: Laura Auricchio, J. Paul Getty Museum: Adélaīde Labille-Guiard: Artist in the Age of Revolution. Getty Publications, 2009.
- Visual Collective – Dspace – Link+ and the University LibraryThis can already be done manually, but will be linked up in the future. You can see how embedded metadata has moved beyond labeling images, to cataloging, and can serve as a gateway to more material to further scholarship. It benefits:Users It makes information accessible that would otherwise be unavailable. Information resides with the image and travels with it - outside the database or online environment – and can be sharedFacilitates searching – e.g. search computer by any word entered into the image file.Discovery – for example data pertaining to source information can aid in research by leading the user to find more information. The WorkflowEmbedding metadata can benefit the digital workflow in an environment of restricted resources and funding.Bulk or batch entry and editing speed up the process; minimum information can be entered quickly.Digital images are self-describing and portable early in the workflow allowing users to get their images sooner rather than later - after they have been cataloged in a database. Repurpose: Metadata can be repurposed. It can be imported into databases and used on Web sites. Tools developed to manipulate metadata can also be useful for image management. Yet, there’s another reason to continue to embed metadata and I will leave you with this thought:
- S.U.R.V.I.V.A.L.To survive the image deluge 250 million images are uploaded to Facebook each dayInfographic Labs. “Facebook 2012.” http://infographiclabs.com/news/facebook-2012/. Inforgraphic Labs, February 15, 2012. Web. 11 April 2012.4.2 million Flickr each day, 51 million registered members“Flickr.” http://advertising.yahoo.com/article/flickr.html. YAHOO! Advertising Solutions. Content Solutions. Web. 11 April 2012. How will we survive without Embedded Metadata? Thank you.ErikKessels work:What's Next?The Future of the Photography MuseumGuest curators: Lauren Cornell, Jefferson Hack, Erik Kessels, Alison Nordström5 november - 7 december 2011 Erik Kessels (KesselsKramer, Amsterdam)| Photography in abundanceThrough the digitalization of photography and the rise of sites such as Flickr and Facebook, everyone now takes photos, and distributes and shares them with the world - the result is countless photos at our disposal. Kessels visualizes 'drowning in pictures of the experiences of others', by printing all the images that were posted on Flickr during a 24-hour period and dumping them in the exhibition space. The end result is an overwhelming presentation of 350,000 prints. http://www.foam.org/press/2011/what%27snextfoammok