SlideShare una empresa de Scribd logo
1 de 13
-
A F F E C T O F C O N C E N T R A T I O N O N T H E
R A T E O F O S M O S I S
Prepared for:BIOLOGY
Prepared by:ABDULLRHMAN ZAKI
Date:1/12/2012
:
Osmosis Investigation
Aim:
The aim of this experiment is to investigate the effect of changing the
concentration of sucrose on the rate of osmosis in cylinders of
potatoes.
This would happen by using similar sizes and lengths of potato
cylinders and applying them into different concentrations of sucrose
(0,10%, 30%, 50%, 70%) in test tubes then measuring the change in mass
of the potatocylinders afterwards. Maintaining all variables
unchanged such as the pH, same size, and a constant temperature.
The time taken for all potato cylinders will be 30 minutes.
Hypothesis:
I predict that if the potato cylinders where put in a sucrose
concentration where the water potential is higher than the water
potential that of the potato it self that would cause the mass of the
potato to increase and if they had similar water potential there will be
no change in mass.
ground:Scientific Back
Osmosis is the movement of water particles (molecules) from a high
water potential to a low water potential through a semi permeable
membrane. Many factors affect the rate of osmosis including size of
particle and temperature however the factor investigated today is
concentration of sucrose.
As the concentration of sucrose increases the difference in mass of
potato will increase since sucrose is a hypertonic solution which
means that it has a higher amount of particles dissolved in the
solution, while a hypotonic solution such as water where there
isfewer particles dissolved.
When the potato is put in sucrose concentration where the water
potential is greater than that of the potato the particles will move
from the potato to the sucrose then a decrease in mass will happen
While if it is put in a concentration where they have the same water
Potential this solution is called isotonic
Variables:
Independent Variable:
The Concentration of sucrose solution in which the potato cylinder is
placed in. (0%, 10%, 30%50%, 70%)
Dependent Variable:
The change in mass (grams) of the potato cylinders before and after
the experiment
Controlled Variables:
SA/V Ratios:
To be able to balance different SA/V ratio to limit its effect on the rate
of osmosis one must first measure the sizes using a ruler (±0.1 cm) as
well as using a cork borer to maintain the same diameter for each
cylinder but changing the length of cylinders themselves.
Temperature:
Temperature is one of the factors that affect osmosis, due to the
existence of more kinetic energy as temperature increases meaning
more effective collisions so we start by Using room temp to maintain
Variable Reason? How to control it?
the same set temp for each investigation performed by using a
thermometer to monitor.
Type of tissue:
The type of tissue has a certain effect on rate of osmosis since the
amount of glucose in each type of tissue differs This will be controlled
by using only one type of tissue which is the same potato
Materials:
2 Large Potato Pieces
1 Cork Borer (0.9 c)
1 Scalpel
1 White Tile
1 Clear Plastic ruler (±0.1 cm)
25 test tubes (UNCERTAINTY) unknown*
120 ml of distilled water
5 Stopwatches (± 0.1s)
Electric balance(± 0.1s)
1 weighing bottle
4 Sucrose solutions (10%, 30%, 50%, 70%)
1 marker
Method:
Using the cork borer remove twenty five potato cylinders from the
potato pieces
Place each cylinder on the tile
With the use of the ruler as well as scalpel, cut cylinders into 5.5 cm s
each
Place each cylinder into a weighing bottle
Measure each potato’s initial mass with the use of the electric balance
Record results of each different concentration of potato
Place the measured potatocylinders into different test tubes
Label each test tube with the concentration of sucrose being tested in
it, Apply 10 ml of (0% )sucrose concentration (distilled water) to 5 test
tubes that have potato in them and then repeat the same procedure
by adding 10 ml of 10% sucrose concentration, 5 differentand so on for
the rest of the concentrations until 25 test tubes are filled with bead
potatoes and different sucrose concentrations (5 of each
concentration)
Data collection:
Table 1:
Shows the results of each Exp (experiment) with each of the
concentrationsof sucrose.
Sucrose
concentrati
on %
(±0.1mm)
Potato (cylinder) mass
(±0.01g)
Initial Final
Exp 1 Exp 2 Exp 3 Exp 4 Exp 5 Exp
1
Exp
2
Exp
3
Exp
4
Exp 5
Distilled
water
1.91 1.90 1.75 1.70 1.91 1.92 2.00 1.79 1.76 1.93
10.0(%) 1.69 1.75 1.68 1.65 1.53 1.61 1.55 1.59 1.65 1.46
30.0(%) 1.69 1.79 1.78 0.89 1.48 1.51 1.37 1.47 1.21 1.46
50.0(%) 1.60 1.61 1.33 1.49 0.97 1.23 1.19 1.01 1.12 0.35
70.0(%) 1.44 1.69 1.54 1.77 1.58 1.07 1.24 1.18 1.32 1.16
Immediately begin timing the experiment with the stopwatch for 30
minutes
When the 30 minutes have finished, take out the cylinders
With a paper towel slightly dry the potato cylinder
Once again place each potato cylinder in the beaker seperately and
record final mass
Construct a table for collection of raw data, and record the initial and
final mass of each different size of tissue
*Repeat these steps for each of the concentrationsto record accurate
results.
Qualitative data:
The potato cylinders fizzed small air bubbles in the distilled water cylinder
and another thing that was noticed was that potato became more dull when
place is distilled water thusly changing its color and I can briefly tell by pre
measuring and estimation before measuring with a ruler that as
concentration of sucrose increased the size of the potato decreased making
the size of the potato, which was placed in distilled water the biggest in size.
Data Processing:
After having collected the data from the experiment the data will be
processed.
As seen previously for each trial we had a different initial and a final weight
the difference that was calculated as seen in graph 1.
-The difference in mass was calculated by subtracting the final mass
from the initial mass.
The change in mass must be calculated to be able to find out the percentage
change in mass for every potato cylinder for each of the 5 trials
Producing the results one must first find the change in mass for every
potato cylinder and that can be done by dividing it by the initial mass and
then multiplying it by a 100 this is how it will look like:
x 100mass∆=
Taking Distilled waterfor an example of the five trials:
Percentage change in mass of the potato cylinder in experiment 1
x 100= ∆mass
Initial mass of potato
= 0.04x 100/1.75 = 2.29%
Percentage change in mass of the potato cylinder in experiment 2
x 100mass∆=
Initial mass of potato
x 100/1.91 = 0.52%0.01=
Percentage change in mass of the potato cylinder in experiment 2
x 100∆ mass=
Initial mass of potato
=0.1×100/1.90=5.23%
Percentage change in mass of the potato cylinder in experiment 2
x 100∆mass=
Initial mass of potato
= 0.06×100/1.70=3.53%
Percentage change in mass of the potato cylinder in experiment 2
x 100∆mass=
Initial mass of potato
= 0.02×100/1.91=1.05%
In order to calculate the change in the mass of each potato cylinder we
must calculate the change in percentage of the potato cylinders to find the
average change in mass for the potato cylinders in different sucrose
concentrations.
To find the average percentage add the % change of the mass in
experiment to the % change in mass of the potato cylinder in experiment 2
and 3 and 4 and 5 and then / them all over 5. Taking distilled water as an
example for all the experiments:
Average percentage change in mass=
change in mass in1 + percentagehange in mass in experimentrcentage cPe
52+3 +4 +
= 2.52%.0.52+5.23+2.29+3.53+1.05=
Average percentage change in mass for the potato cylinders in the 5
different sucrose concentrations is put in to show the rate of osmosis in the
potato cylinders for the sucrose concentrations.
e change in mass in the 5 experiments, the averagepercentagThe:Table 2
percentage changes in mass of the potato cylinders for each of the 5 different
sucrose concentrations.
The Standard deviation for the experiments was calculated using Microsoft
excel:
Sucrose
sconcentration
(%)(±0.1m
m)
% change and the average change inThe difference in mass
ass (±0.1g) for each of the 5 concentrations (%)m
Trial 1 Trial 2 Trial 3 Trial 4 Trial 5
∆
Mass
%
Change
in mass
∆
mass
%
Change
in mass
∆
Mass
%
Change
in mass
∆mass %
Change
in mass
∆
Mass
%
Chang
e in
mass
Average
percentage
change
0.0 (%) 0.01 0.52 0.1
0
5.23 0.0
4
2.29 0.06 3.53 0.0
2
1.05 2.52
10.0 (%) -
0.08
-4.73 -
0.0
2
-
11.43
-
0.0
9
-5.36 0.07 -4.24 -
0.0
7
-
4.5
8
6.07-
30.0 (%) -0.18 -
10.6
5
-
0.3
4
-
23.4
6
-
0.31
-
17.42
-
0.28
-
24.4
5
-
0.22
-
14.3
5
18.07-
50.0 (%) -
0.37
-
23.14
-
0.4
2
-
26.0
9
-
0.32
-
24.0
6
-
0.37
-
24.8
3
-
0.4
5
-
27.9
0
25.20-
70.0 (%) -
0.37
-
25.6
9
-
0.4
5
-
26.6
3
-
0.36
-
23.2
0
-
0.45
-
25.42
-
0.4
2
-
26.5
8
25.52-
The most accurate experiment was for sucrose concentration (70 %) as it
1.353045.standard deviation ofthehad
Table3:
S.D for each change in % in (grams)
Standard deviation in (g) for each average percentage change in (g).
Concentration of sucrose (%) Average percentage
change (g)(±0.1)
Standard deviation (g)
0.0 2.52 1.91
10.0 -6.07 3.02
30.0 -18.07 5.90
50.0 -25.20 1.86
70.0 -25.52 1.35
Data Presentation:
Graph 1:The effect of the 5-sucrose concentration on the average
percentage change in the mass of the potato cylinders.
:Conclusion
To wrap this experiment up I can say that the trails that were done on
each of the 5 different concentrations were repeated for each
concentration 5 times for higher accuracy.
When doing this experiment I was able to see the effect of different
concentrations on the rate of osmosis, each trail was done by measuring
the initial mass of the potato cylinder and after osmosis, the results that
were conducted shows that as the sucrose concentration increases the
rate of osmosis also increases thusly making a direct decrease in mass.
A good example would be the experiments with the concentrations of
10% and 70% concentration results to show the change.In the
10%concentration I noticed a decrease in the percentage change in mas
for experiment 1 the percentage decrease was -4.73 while for the
concentration of sucrose 70% the change was -25.69 we can see that the
R² = 0.999
-30
-25
-20
-15
-10
-5
0
5
10
-10 0 10 20 30 40 50 60 70 80
averagepercentagechangeinmass
sucrose concentration
The effect of the 5 sucrose
concentrations (%) on the average
percentage change in the mass
(%)(±0.1g) of the potato cylinders
percentage of change in mass is decreasing thusly we can conclude that
the difference of the initial from the final and as it gets greater that
means the mass of the potato changed massively
According to the osmosis theory as the concentration of the sucrose
solution increases the particle’s water potential increases and becomes
higher than the particles that are inn the potato.
While in the experiment of the distilled water it was a little different
since the water potential is higher than those in the potato thusly the
mass of the potato cylinders increased.
As seen the in the graph as the curve cuts the x-axis both the
concentration and differences in mass of the potato cylinders are the
same, thusly making the solution an isotonic solution which means that
the water potential of concentration is similar to the water potential
concentration of the potato cylinder.
So we can see that osmosis cannot take place since it is a movement
from high to low water potential and in this case they are both equal.
According to the experiments I have done and the data I was able to
extract I can say that my hypothesis was supported by the collected
data, which is as the concentration of sucrose increases the rate of
osmosis increases.
The Standard deviation was calculated through mac iWork, which was
able to show the reliability of the data that was collected and have the
ability to see the range of errors using the error bars.
I was able to see that the standard deviation was different from one
concentration to the other as in distilled water;
), while for the concentration of 10 % itg1.91(The standard deviation was
ithighest,%, which is thethe concentration of 30and for)g(3.02swa
thethe concentration of 70 % that wasforand finally)g(5.90came about
)g(-.351lowest
Evaluation:
In the investigation I had a wide range of errors that I wasn’t able to
control as in the temperature of the surroundings as the room
temperature and that could have manipulated the results in a slight
way yet it wont make the a experiment a fair one.
Another factor would be that the sugar around the potato pieces
might not have been distributed equally so each potato cylinder my
have contained a different amount of sugar thusly affecting the rate
of osmosis.
Another thing that would have caused some error in the experiment is
that the experiment required more than one piece of potato thusly 2
needed to be used and that gives us 2 different sources of sucrose and
each piece of potato might have had a different amount of nutrition
thusly affecting the amount of sugar in each so that might have
affected the results of the experiments that were conducted.
:Improvements
I suggest that if possible a way to make the experiment better
would be by the use of one source of equally distributed sucrose
source and a controlled room temperature to maintain more
reliable results.
Bibliography
"Lab Help for Ex. 6 Green Plant - II." Lab Help for Ex. 6 Green
Plant - II. N.p., n.d. Web. 29 Nov. 2012.
(A person using the cork borer to extract a potato cylinder)

Más contenido relacionado

La actualidad más candente

Diffusion lab
Diffusion labDiffusion lab
Diffusion lab14771
 
Independent Research Osmosis Lab
Independent Research Osmosis LabIndependent Research Osmosis Lab
Independent Research Osmosis LabHonori
 
CAPE Caribbean Studies Internal Assessment
CAPE Caribbean Studies Internal AssessmentCAPE Caribbean Studies Internal Assessment
CAPE Caribbean Studies Internal AssessmentCamilla Holgate
 
Aprevised osmosis lab
Aprevised osmosis labAprevised osmosis lab
Aprevised osmosis labsbarkanic
 
English SBA Sample *Teacher Approved*
English SBA Sample *Teacher Approved*English SBA Sample *Teacher Approved*
English SBA Sample *Teacher Approved*Gian Forerunner
 
Transpiration Lab
Transpiration LabTranspiration Lab
Transpiration Labguest970cb3
 
Bio Catalyze Lab
Bio Catalyze LabBio Catalyze Lab
Bio Catalyze Labtangkwa22
 
Human & Social Biology - Sample Project on 'The Impact of Heath Practices on ...
Human & Social Biology - Sample Project on 'The Impact of Heath Practices on ...Human & Social Biology - Sample Project on 'The Impact of Heath Practices on ...
Human & Social Biology - Sample Project on 'The Impact of Heath Practices on ...Raheme Matthie
 
Chromatography lab report biology
Chromatography lab report  biologyChromatography lab report  biology
Chromatography lab report biologyMariam Ohanyan
 
Implementing Science Investigations for the CSEC SBA
Implementing Science Investigations for the CSEC SBAImplementing Science Investigations for the CSEC SBA
Implementing Science Investigations for the CSEC SBADebbie-Ann Hall
 
Cape biology uni 2 -_ecosystems_population_ecology_and_practical_methods_of_e...
Cape biology uni 2 -_ecosystems_population_ecology_and_practical_methods_of_e...Cape biology uni 2 -_ecosystems_population_ecology_and_practical_methods_of_e...
Cape biology uni 2 -_ecosystems_population_ecology_and_practical_methods_of_e...Hilton Ritch
 
CAPE Caribbean Studies Unit 2 - Sample SBA
CAPE Caribbean Studies Unit 2 - Sample SBACAPE Caribbean Studies Unit 2 - Sample SBA
CAPE Caribbean Studies Unit 2 - Sample SBARaheme Matthie
 
Chemistry report final
Chemistry report finalChemistry report final
Chemistry report finalAsyh Syiedah
 

La actualidad más candente (20)

Diffusion lab
Diffusion labDiffusion lab
Diffusion lab
 
Independent Research Osmosis Lab
Independent Research Osmosis LabIndependent Research Osmosis Lab
Independent Research Osmosis Lab
 
Biology Lab
Biology LabBiology Lab
Biology Lab
 
Biology Lab Report 2
Biology Lab Report 2Biology Lab Report 2
Biology Lab Report 2
 
CAPE Caribbean Studies Internal Assessment
CAPE Caribbean Studies Internal AssessmentCAPE Caribbean Studies Internal Assessment
CAPE Caribbean Studies Internal Assessment
 
Aprevised osmosis lab
Aprevised osmosis labAprevised osmosis lab
Aprevised osmosis lab
 
Eng sba
Eng sbaEng sba
Eng sba
 
Chemistry Lab Report 2
Chemistry Lab Report 2Chemistry Lab Report 2
Chemistry Lab Report 2
 
English SBA Sample *Teacher Approved*
English SBA Sample *Teacher Approved*English SBA Sample *Teacher Approved*
English SBA Sample *Teacher Approved*
 
Paper chromatography experiment
Paper chromatography experimentPaper chromatography experiment
Paper chromatography experiment
 
Transpiration Lab
Transpiration LabTranspiration Lab
Transpiration Lab
 
Bio Catalyze Lab
Bio Catalyze LabBio Catalyze Lab
Bio Catalyze Lab
 
Human & Social Biology - Sample Project on 'The Impact of Heath Practices on ...
Human & Social Biology - Sample Project on 'The Impact of Heath Practices on ...Human & Social Biology - Sample Project on 'The Impact of Heath Practices on ...
Human & Social Biology - Sample Project on 'The Impact of Heath Practices on ...
 
Chromatography lab report biology
Chromatography lab report  biologyChromatography lab report  biology
Chromatography lab report biology
 
English A SBA
English A SBAEnglish A SBA
English A SBA
 
Caribbean History SBA
Caribbean History SBACaribbean History SBA
Caribbean History SBA
 
Implementing Science Investigations for the CSEC SBA
Implementing Science Investigations for the CSEC SBAImplementing Science Investigations for the CSEC SBA
Implementing Science Investigations for the CSEC SBA
 
Cape biology uni 2 -_ecosystems_population_ecology_and_practical_methods_of_e...
Cape biology uni 2 -_ecosystems_population_ecology_and_practical_methods_of_e...Cape biology uni 2 -_ecosystems_population_ecology_and_practical_methods_of_e...
Cape biology uni 2 -_ecosystems_population_ecology_and_practical_methods_of_e...
 
CAPE Caribbean Studies Unit 2 - Sample SBA
CAPE Caribbean Studies Unit 2 - Sample SBACAPE Caribbean Studies Unit 2 - Sample SBA
CAPE Caribbean Studies Unit 2 - Sample SBA
 
Chemistry report final
Chemistry report finalChemistry report final
Chemistry report final
 

Similar a Osmosis lab report

Diffusion osmosis planning lab
Diffusion osmosis planning labDiffusion osmosis planning lab
Diffusion osmosis planning labtomoyonda
 
Graded yeast rhea
Graded  yeast rheaGraded  yeast rhea
Graded yeast rheaRhea Singh
 
Irp 3 cell respiration
Irp 3   cell respirationIrp 3   cell respiration
Irp 3 cell respirationRaeAnneSmith
 
Irp 3 cell respiration
Irp 3   cell respirationIrp 3   cell respiration
Irp 3 cell respirationRaeAnneSmith
 
Investigate the effect of temperature on amylase activity
Investigate the effect of temperature on amylase activityInvestigate the effect of temperature on amylase activity
Investigate the effect of temperature on amylase activitylanceqwerty
 
The activity of enzymes Emad Zeidan
The activity of enzymes   Emad ZeidanThe activity of enzymes   Emad Zeidan
The activity of enzymes Emad ZeidanEmad Zeidan
 
Bacteria enumeration
Bacteria enumerationBacteria enumeration
Bacteria enumerationmartyynyyte
 
Gallus Egg Lab Report
Gallus Egg Lab ReportGallus Egg Lab Report
Gallus Egg Lab ReportJill Ailts
 
Biology SPM paper 3 experiment
Biology SPM paper 3 experimentBiology SPM paper 3 experiment
Biology SPM paper 3 experimentTiffany Cheah
 

Similar a Osmosis lab report (10)

Diffusion osmosis planning lab
Diffusion osmosis planning labDiffusion osmosis planning lab
Diffusion osmosis planning lab
 
Graded yeast rhea
Graded  yeast rheaGraded  yeast rhea
Graded yeast rhea
 
Osmosis Paper
Osmosis PaperOsmosis Paper
Osmosis Paper
 
Irp 3 cell respiration
Irp 3   cell respirationIrp 3   cell respiration
Irp 3 cell respiration
 
Irp 3 cell respiration
Irp 3   cell respirationIrp 3   cell respiration
Irp 3 cell respiration
 
Investigate the effect of temperature on amylase activity
Investigate the effect of temperature on amylase activityInvestigate the effect of temperature on amylase activity
Investigate the effect of temperature on amylase activity
 
The activity of enzymes Emad Zeidan
The activity of enzymes   Emad ZeidanThe activity of enzymes   Emad Zeidan
The activity of enzymes Emad Zeidan
 
Bacteria enumeration
Bacteria enumerationBacteria enumeration
Bacteria enumeration
 
Gallus Egg Lab Report
Gallus Egg Lab ReportGallus Egg Lab Report
Gallus Egg Lab Report
 
Biology SPM paper 3 experiment
Biology SPM paper 3 experimentBiology SPM paper 3 experiment
Biology SPM paper 3 experiment
 

Osmosis lab report

  • 1. - A F F E C T O F C O N C E N T R A T I O N O N T H E R A T E O F O S M O S I S Prepared for:BIOLOGY Prepared by:ABDULLRHMAN ZAKI Date:1/12/2012 :
  • 2. Osmosis Investigation Aim: The aim of this experiment is to investigate the effect of changing the concentration of sucrose on the rate of osmosis in cylinders of potatoes. This would happen by using similar sizes and lengths of potato cylinders and applying them into different concentrations of sucrose (0,10%, 30%, 50%, 70%) in test tubes then measuring the change in mass of the potatocylinders afterwards. Maintaining all variables unchanged such as the pH, same size, and a constant temperature. The time taken for all potato cylinders will be 30 minutes. Hypothesis: I predict that if the potato cylinders where put in a sucrose concentration where the water potential is higher than the water potential that of the potato it self that would cause the mass of the potato to increase and if they had similar water potential there will be no change in mass. ground:Scientific Back Osmosis is the movement of water particles (molecules) from a high water potential to a low water potential through a semi permeable membrane. Many factors affect the rate of osmosis including size of particle and temperature however the factor investigated today is concentration of sucrose. As the concentration of sucrose increases the difference in mass of potato will increase since sucrose is a hypertonic solution which means that it has a higher amount of particles dissolved in the solution, while a hypotonic solution such as water where there isfewer particles dissolved.
  • 3. When the potato is put in sucrose concentration where the water potential is greater than that of the potato the particles will move from the potato to the sucrose then a decrease in mass will happen While if it is put in a concentration where they have the same water Potential this solution is called isotonic Variables: Independent Variable: The Concentration of sucrose solution in which the potato cylinder is placed in. (0%, 10%, 30%50%, 70%) Dependent Variable: The change in mass (grams) of the potato cylinders before and after the experiment Controlled Variables: SA/V Ratios: To be able to balance different SA/V ratio to limit its effect on the rate of osmosis one must first measure the sizes using a ruler (±0.1 cm) as well as using a cork borer to maintain the same diameter for each cylinder but changing the length of cylinders themselves. Temperature: Temperature is one of the factors that affect osmosis, due to the existence of more kinetic energy as temperature increases meaning more effective collisions so we start by Using room temp to maintain Variable Reason? How to control it?
  • 4. the same set temp for each investigation performed by using a thermometer to monitor. Type of tissue: The type of tissue has a certain effect on rate of osmosis since the amount of glucose in each type of tissue differs This will be controlled by using only one type of tissue which is the same potato Materials: 2 Large Potato Pieces 1 Cork Borer (0.9 c) 1 Scalpel 1 White Tile 1 Clear Plastic ruler (±0.1 cm) 25 test tubes (UNCERTAINTY) unknown* 120 ml of distilled water 5 Stopwatches (± 0.1s) Electric balance(± 0.1s) 1 weighing bottle 4 Sucrose solutions (10%, 30%, 50%, 70%) 1 marker Method: Using the cork borer remove twenty five potato cylinders from the potato pieces Place each cylinder on the tile With the use of the ruler as well as scalpel, cut cylinders into 5.5 cm s each Place each cylinder into a weighing bottle Measure each potato’s initial mass with the use of the electric balance
  • 5. Record results of each different concentration of potato Place the measured potatocylinders into different test tubes Label each test tube with the concentration of sucrose being tested in it, Apply 10 ml of (0% )sucrose concentration (distilled water) to 5 test tubes that have potato in them and then repeat the same procedure by adding 10 ml of 10% sucrose concentration, 5 differentand so on for the rest of the concentrations until 25 test tubes are filled with bead potatoes and different sucrose concentrations (5 of each concentration) Data collection: Table 1: Shows the results of each Exp (experiment) with each of the concentrationsof sucrose. Sucrose concentrati on % (±0.1mm) Potato (cylinder) mass (±0.01g) Initial Final Exp 1 Exp 2 Exp 3 Exp 4 Exp 5 Exp 1 Exp 2 Exp 3 Exp 4 Exp 5 Distilled water 1.91 1.90 1.75 1.70 1.91 1.92 2.00 1.79 1.76 1.93 10.0(%) 1.69 1.75 1.68 1.65 1.53 1.61 1.55 1.59 1.65 1.46 30.0(%) 1.69 1.79 1.78 0.89 1.48 1.51 1.37 1.47 1.21 1.46 50.0(%) 1.60 1.61 1.33 1.49 0.97 1.23 1.19 1.01 1.12 0.35 70.0(%) 1.44 1.69 1.54 1.77 1.58 1.07 1.24 1.18 1.32 1.16
  • 6. Immediately begin timing the experiment with the stopwatch for 30 minutes When the 30 minutes have finished, take out the cylinders With a paper towel slightly dry the potato cylinder Once again place each potato cylinder in the beaker seperately and record final mass Construct a table for collection of raw data, and record the initial and final mass of each different size of tissue *Repeat these steps for each of the concentrationsto record accurate results. Qualitative data: The potato cylinders fizzed small air bubbles in the distilled water cylinder and another thing that was noticed was that potato became more dull when place is distilled water thusly changing its color and I can briefly tell by pre measuring and estimation before measuring with a ruler that as concentration of sucrose increased the size of the potato decreased making the size of the potato, which was placed in distilled water the biggest in size. Data Processing: After having collected the data from the experiment the data will be processed. As seen previously for each trial we had a different initial and a final weight the difference that was calculated as seen in graph 1. -The difference in mass was calculated by subtracting the final mass from the initial mass.
  • 7. The change in mass must be calculated to be able to find out the percentage change in mass for every potato cylinder for each of the 5 trials Producing the results one must first find the change in mass for every potato cylinder and that can be done by dividing it by the initial mass and then multiplying it by a 100 this is how it will look like: x 100mass∆= Taking Distilled waterfor an example of the five trials: Percentage change in mass of the potato cylinder in experiment 1 x 100= ∆mass Initial mass of potato = 0.04x 100/1.75 = 2.29% Percentage change in mass of the potato cylinder in experiment 2 x 100mass∆= Initial mass of potato x 100/1.91 = 0.52%0.01= Percentage change in mass of the potato cylinder in experiment 2 x 100∆ mass= Initial mass of potato =0.1×100/1.90=5.23% Percentage change in mass of the potato cylinder in experiment 2 x 100∆mass=
  • 8. Initial mass of potato = 0.06×100/1.70=3.53% Percentage change in mass of the potato cylinder in experiment 2 x 100∆mass= Initial mass of potato = 0.02×100/1.91=1.05% In order to calculate the change in the mass of each potato cylinder we must calculate the change in percentage of the potato cylinders to find the average change in mass for the potato cylinders in different sucrose concentrations. To find the average percentage add the % change of the mass in experiment to the % change in mass of the potato cylinder in experiment 2 and 3 and 4 and 5 and then / them all over 5. Taking distilled water as an example for all the experiments: Average percentage change in mass= change in mass in1 + percentagehange in mass in experimentrcentage cPe 52+3 +4 + = 2.52%.0.52+5.23+2.29+3.53+1.05= Average percentage change in mass for the potato cylinders in the 5 different sucrose concentrations is put in to show the rate of osmosis in the potato cylinders for the sucrose concentrations.
  • 9. e change in mass in the 5 experiments, the averagepercentagThe:Table 2 percentage changes in mass of the potato cylinders for each of the 5 different sucrose concentrations. The Standard deviation for the experiments was calculated using Microsoft excel: Sucrose sconcentration (%)(±0.1m m) % change and the average change inThe difference in mass ass (±0.1g) for each of the 5 concentrations (%)m Trial 1 Trial 2 Trial 3 Trial 4 Trial 5 ∆ Mass % Change in mass ∆ mass % Change in mass ∆ Mass % Change in mass ∆mass % Change in mass ∆ Mass % Chang e in mass Average percentage change 0.0 (%) 0.01 0.52 0.1 0 5.23 0.0 4 2.29 0.06 3.53 0.0 2 1.05 2.52 10.0 (%) - 0.08 -4.73 - 0.0 2 - 11.43 - 0.0 9 -5.36 0.07 -4.24 - 0.0 7 - 4.5 8 6.07- 30.0 (%) -0.18 - 10.6 5 - 0.3 4 - 23.4 6 - 0.31 - 17.42 - 0.28 - 24.4 5 - 0.22 - 14.3 5 18.07- 50.0 (%) - 0.37 - 23.14 - 0.4 2 - 26.0 9 - 0.32 - 24.0 6 - 0.37 - 24.8 3 - 0.4 5 - 27.9 0 25.20- 70.0 (%) - 0.37 - 25.6 9 - 0.4 5 - 26.6 3 - 0.36 - 23.2 0 - 0.45 - 25.42 - 0.4 2 - 26.5 8 25.52-
  • 10. The most accurate experiment was for sucrose concentration (70 %) as it 1.353045.standard deviation ofthehad Table3: S.D for each change in % in (grams) Standard deviation in (g) for each average percentage change in (g). Concentration of sucrose (%) Average percentage change (g)(±0.1) Standard deviation (g) 0.0 2.52 1.91 10.0 -6.07 3.02 30.0 -18.07 5.90 50.0 -25.20 1.86 70.0 -25.52 1.35 Data Presentation:
  • 11. Graph 1:The effect of the 5-sucrose concentration on the average percentage change in the mass of the potato cylinders. :Conclusion To wrap this experiment up I can say that the trails that were done on each of the 5 different concentrations were repeated for each concentration 5 times for higher accuracy. When doing this experiment I was able to see the effect of different concentrations on the rate of osmosis, each trail was done by measuring the initial mass of the potato cylinder and after osmosis, the results that were conducted shows that as the sucrose concentration increases the rate of osmosis also increases thusly making a direct decrease in mass. A good example would be the experiments with the concentrations of 10% and 70% concentration results to show the change.In the 10%concentration I noticed a decrease in the percentage change in mas for experiment 1 the percentage decrease was -4.73 while for the concentration of sucrose 70% the change was -25.69 we can see that the R² = 0.999 -30 -25 -20 -15 -10 -5 0 5 10 -10 0 10 20 30 40 50 60 70 80 averagepercentagechangeinmass sucrose concentration The effect of the 5 sucrose concentrations (%) on the average percentage change in the mass (%)(±0.1g) of the potato cylinders
  • 12. percentage of change in mass is decreasing thusly we can conclude that the difference of the initial from the final and as it gets greater that means the mass of the potato changed massively According to the osmosis theory as the concentration of the sucrose solution increases the particle’s water potential increases and becomes higher than the particles that are inn the potato. While in the experiment of the distilled water it was a little different since the water potential is higher than those in the potato thusly the mass of the potato cylinders increased. As seen the in the graph as the curve cuts the x-axis both the concentration and differences in mass of the potato cylinders are the same, thusly making the solution an isotonic solution which means that the water potential of concentration is similar to the water potential concentration of the potato cylinder. So we can see that osmosis cannot take place since it is a movement from high to low water potential and in this case they are both equal. According to the experiments I have done and the data I was able to extract I can say that my hypothesis was supported by the collected data, which is as the concentration of sucrose increases the rate of osmosis increases. The Standard deviation was calculated through mac iWork, which was able to show the reliability of the data that was collected and have the ability to see the range of errors using the error bars. I was able to see that the standard deviation was different from one concentration to the other as in distilled water; ), while for the concentration of 10 % itg1.91(The standard deviation was ithighest,%, which is thethe concentration of 30and for)g(3.02swa
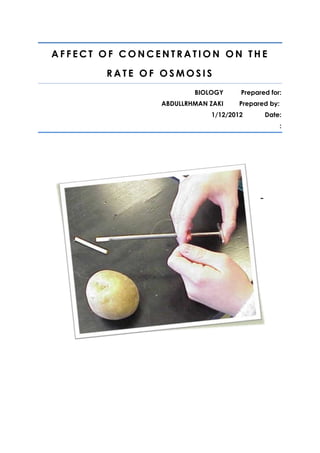
  • 13. thethe concentration of 70 % that wasforand finally)g(5.90came about )g(-.351lowest Evaluation: In the investigation I had a wide range of errors that I wasn’t able to control as in the temperature of the surroundings as the room temperature and that could have manipulated the results in a slight way yet it wont make the a experiment a fair one. Another factor would be that the sugar around the potato pieces might not have been distributed equally so each potato cylinder my have contained a different amount of sugar thusly affecting the rate of osmosis. Another thing that would have caused some error in the experiment is that the experiment required more than one piece of potato thusly 2 needed to be used and that gives us 2 different sources of sucrose and each piece of potato might have had a different amount of nutrition thusly affecting the amount of sugar in each so that might have affected the results of the experiments that were conducted. :Improvements I suggest that if possible a way to make the experiment better would be by the use of one source of equally distributed sucrose source and a controlled room temperature to maintain more reliable results. Bibliography "Lab Help for Ex. 6 Green Plant - II." Lab Help for Ex. 6 Green Plant - II. N.p., n.d. Web. 29 Nov. 2012. (A person using the cork borer to extract a potato cylinder)