Distinction between outliers and influential data points w out hyp test
•Descargar como DOCX, PDF•
1 recomendación•514 vistas


Recomendados
Recomendados
Más contenido relacionado
La actualidad más candente
La actualidad más candente (18)
Destacado
Destacado (14)
Similar a Distinction between outliers and influential data points w out hyp test
Similar a Distinction between outliers and influential data points w out hyp test (20)
Último
Último (20)
Distinction between outliers and influential data points w out hyp test
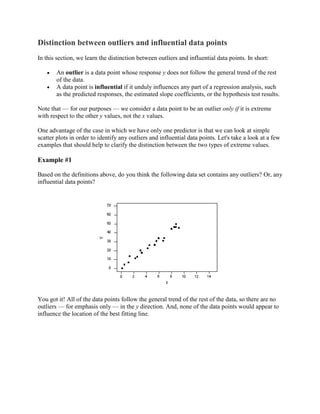
- 1. Distinction between outliers and influential data points In this section, we learn the distinction between outliers and influential data points. In short: An outlier is a data point whose response y does not follow the general trend of the rest of the data. A data point is influential if it unduly influences any part of a regression analysis, such as the predicted responses, the estimated slope coefficients, or the hypothesis test results. Note that — for our purposes — we consider a data point to be an outlier only if it is extreme with respect to the other y values, not the x values. One advantage of the case in which we have only one predictor is that we can look at simple scatter plots in order to identify any outliers and influential data points. Let's take a look at a few examples that should help to clarify the distinction between the two types of extreme values. Example #1 Based on the definitions above, do you think the following data set contains any outliers? Or, any influential data points? You got it! All of the data points follow the general trend of the rest of the data, so there are no outliers — for emphasis only — in the y direction. And, none of the data points would appear to influence the location of the best fitting line.
- 2. Example #2 Now, how about this example? Do you think the following data set contains any outliers? Or, any influential data points?(Wink!Wink!) Of course! Because the blue data point does not follow the general trend of the rest of the data, it would be considered an outlier. But, is the blue data point influential? An easy way to determine if the data point is influential is to find the best fitting line twice — once with the blue data point included and once the blue data point excluded. The following plot illustrates the two best fitting lines: Wow — it's hard to even tell the two estimated regression equations apart! The dashed line represents the estimated regression equation with the blue data point included, while the solid line represents the estimated regression equation with the blue data point taken excluded. The slopes of the two lines are very similar — 5.04 and 5.12, respectively.
- 3. and the following output when the blue data point is excluded: In short, the predicted responses, estimated slope coefficients, and hypothesis test results are not affected by the inclusion of the blue data point. Therefore, the data point is not deemed influential. In summary, the blue data point is not influential, but still an outlier. Example #3 Now, how about this example? Do you think the following data set contains any outliers? Or, any influential data points? In this case, the blue data point does follow the general trend of the rest of the data. Therefore, it is not deemed an outlier here. But, is the blue data point influential? It certainly appears to be far removed from the rest of the data — in the x direction. Is that sufficient to make the data point influential?
- 4. The following plot illustrates two best fitting lines — one obtained when the blue data point is included and one obtained when the blue data point is excluded: Again, it's hard to even tell the two estimated regression equations apart! The dashed line represents the estimated regression equation with the blue data point included, while the solid line represents the estimated regression equation with the blue data point taken excluded. The slopes of the two lines are very similar — 4.93 and 5.12, respectively. and the following output when the blue data point is excluded: Here, there are hardly any side effects at all of including the blue data point: In short, the predicted responses, estimated slope coefficients, and hypothesis test results are not affected by the inclusion of the blue data point. Therefore, the data point is not deemed influential. In summary, the blue data point is not influential, nor is it an outlier.
- 5. Example #4 One last example! Do you think the following data set contains any outliers? Or, any influential data points? That's right — in this case, the blue data point is most certainly an outlier and influential! The blue data point does follow the general trend of the rest of the data. Below are the two best fitting lines — one obtained when the blue data point is included and one obtained when the blue data point is excluded: are (not surprisingly) substantially different. The dashed line represents the estimated regression equation with the blue data point included, while the solid line represents the estimated regression equation with the blue data point taken excluded. The existence of the blue data point significantly reduces the slope of the regression line — dropping it from 5.12 to 3.32.
- 6. and the following output when the blue data point is excluded: Here, the predicted responses and estimated slope coefficients are clearly affected by the presence of the blue data point. In this case, the blue data point is deemed both influential and an outlier. Summary The above examples — through the use of simple plots — have highlighted the distinction between outliers and influential data points. We have seen an example, in which a data point was an outlier, but not influential. That is, not every outlier strongly influences the regression analysis. It is your job as a regression analyst to always determine if your regression analysis is unduly influenced by one or a few data points. Of course, the easy situation occurs for simple linear regression, when we can rely on simple scatter plots to elucidate matters. Unfortunately, we don't have that luxury in the case of multiple linear regression. In that situation, we have to rely on various measures to help us determine whether a data point is an outlier, influential or both.