

Recomendados
Más contenido relacionado
La actualidad más candente
La actualidad más candente (20)
Destacado
Destacado (20)
Similar a Flow charts
Similar a Flow charts (20)
Más de Aditya Sharat
Más de Aditya Sharat (16)
Último
Último (20)
Flow charts
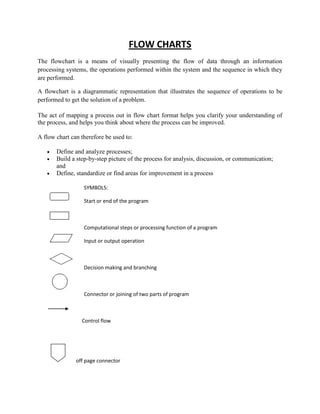
- 1. FLOW CHARTS The flowchart is a means of visually presenting the flow of data through an information processing systems, the operations performed within the system and the sequence in which they are performed. A flowchart is a diagrammatic representation that illustrates the sequence of operations to be performed to get the solution of a problem. The act of mapping a process out in flow chart format helps you clarify your understanding of the process, and helps you think about where the process can be improved. A flow chart can therefore be used to: Define and analyze processes; Build a step-by-step picture of the process for analysis, discussion, or communication; and Define, standardize or find areas for improvement in a process SYMBOLS: Start or end of the program Computational steps or processing function of a program Input or output operation Decision making and branching Connector or joining of two parts of program Control flow off page connector
- 2. GUIDELINES: a. In drawing a proper flowchart, all necessary requirements should be listed out in logical order. b. The flowchart should be clear, neat and easy to follow. There should not be any room for ambiguity in understanding the flowchart. c. The usual direction of the flow of a procedure or system is from left to right or top to bottom. d. Only one flow line should come out from a process symbol. or e. Only one flow line should enter a decision symbol, but two or three flow lines, one for each possible answer, should leave the decision symbol. f. Only one flow line is used in conjunction with terminal symbol. g. Write within standard symbols briefly. As necessary, you can use the annotation symbol to describe data or computational steps more clearly. h. If the flowchart becomes complex, it is better to use connector symbols to reduce the number of flow lines. Avoid the intersection of flow lines if you want to make it more effective and better way of communication. i. Ensure that the flowchart has a logical start and finish. j. It is useful to test the validity of the flowchart by passing through it with a simple test data.
- 3. The benefits of flowcharts are as follows: 1. Communication: Flowcharts are better way of communicating the logic of a system to all concerned. 2. Effective analysis: With the help of flowchart, problem can be analysed in more effective way. 3. Proper documentation: Program flowcharts serve as a good program documentation, which is needed for various purposes. 4. Efficient Coding: The flowcharts act as a guide or blueprint during the systems analysis and program development phase. 5. Proper Debugging: The flowchart helps in debugging process. 6. Efficient Program Maintenance: The maintenance of operating program becomes easy with the help of flowchart. It helps the programmer to put efforts more efficiently on that part 25.6 LIMITATIONS OF USING FLOWCHARTS 1. Complex logic: Sometimes, the program logic is quite complicated. In that case, flowchart becomes complex and clumsy. 2. Alterations and Modifications: If alterations are required the flowchart may require re- drawing completely. 3. Reproduction: As the flowchart symbols cannot be typed, reproduction of flowchart becomes a problem. 4. The essentials of what is done can easily be lost in the technical details of how it is done. Types of flowcharts Document flowcharts, showing controls over a document-flow through a system Data flowcharts, showing controls over a data flows in a system System flowcharts showing controls at a physical or resource level Program flowchart, showing the controls in a program within a system Notice that every type of flowchart focuses on some kind of control, rather then on the particular flow itself. More recently in 2001, more differences: Decision flowcharts logic flowcharts systems flowcharts product flowcharts process flowcharts
- 4. EXAMPLES: 1. Flowchart to find the sum of first 50 natural numbers.
- 5. 2. Flowchart to find the largest of three numbers A,B, and C.