CustomerGauge B2b Net Promoter Score Measurement
•
4 recomendaciones•2,694 vistas

Overview of the Net Promoter Score (R) Measurement system from CustomerGauge. This system is tailored to b2b relationship measurement.

Recomendados
Recomendados
Más contenido relacionado
La actualidad más candente
La actualidad más candente (19)
Similar a CustomerGauge B2b Net Promoter Score Measurement
Similar a CustomerGauge B2b Net Promoter Score Measurement (20)
Más de CustomerGauge
Más de CustomerGauge (19)
Último
Último (20)
CustomerGauge B2b Net Promoter Score Measurement
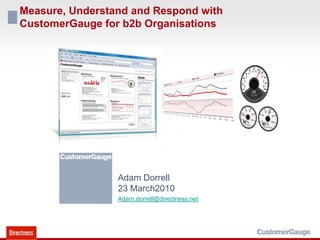
- 1. Measure, Understand and Respond with CustomerGauge for b2b Organisations Adam Dorrell23 March2010 Adam.dorrell@directness.net
- 2. Trap for business: When customer feedback goes wrong… Question 41 of 50 Most business surveys… ask too many questions for marginal use Ask customers information you already know Take up too much time Have low response rates Need to be interpreted by skilled market researchers Actions? Little – normally too late for response Get left on shelf for a year Customers frustrations not answered Expensive and little operational use Alert! You must fill in all of the questions! Thick reports get left on the shelf, too late to action Survey only once a year: 3Qs without update…
- 3. Alternative? Just one question. Page 1 of 1 Better solution! Use data you already have One page survey Use industry standard Net Promoter® Score Benefits Not intrusive for customers, high response “Bite-sized” information gathering Instant results you can interpret AND action Act on information this quarter Reward internally on results Short, quick survey Do not ask customers information you already know. Build information into survey system before you ask. *Net Promoter is a registered trademark of Satmetrix Systems, Inc., Bain & Company and Fred Reichheld.
- 4. Result – Tracking and feedback Acting on Voice of Customer: Real customer comments Satisfied customers! Tracking metrics over time Quantitative customer scores help you understand the issues over time Multiple segmentation: Industry / Type of partner / Issue / Salesperson Feedback helps you understand what needs to be changed Share comments with partners
- 5. The Net Promoter Score (NPS) Net Promoter Score® Developed by Fred Reicheld. Open system: Just one number Measure every transaction: “Would you recommend us?” Get customer feedback Becoming a hard-metric, reported in Earnings results Download from: http://customergauge.com/wordpress/?p=42
- 6. Net Promoter Methodology Simple, one number Follow NPS methodology Recommenders (promoters) Avoiders (detractors) R – A = Net Recommendation Score Detractors Neutrals Promoters
- 7. CustomerGauge Introduction Simple dashboard operation All the tools you need to measure, understand and respond to customers Built-in survey tools Analysis Tools Workflow to help respond to customers Based on Net Promoter Score® Survey relationships or transactions Sales Customer Service
- 8. Demonstration Agenda Objective Measure NPS, multiple segments: Account Manager, Revenue Cluster, Country, Region, Department Introduction “Flights” Less b2c Data input Email Invitation Survey Home page Reports Response Response by company Increasing response Net Promoter Score (flights) Segments (Account Managers) Comments Bubbles Companies Company Drill Down Root Cause Task + Misc Search Sent a test email Tag a comment Export Unsubscribe/bounce etc Tag setup Customisation options Additional survey questions Workflow Gallery and home page Divisional reporting Future: Profit v NPS
- 9. Data Input Multiple segments possible (up to 9) Data can be provided from Excel, CSV etc
- 10. Login http://www.c1-gauge.com/loginb2b.phpuser: acmeb2b@c1-gauge.compass: testAcme09 jvr@directness.net / b2bdemo
- 11. Touching customers Acme Corp Acme Corp Acme Corp Branded email invitation Branded Survey – 2 minutes to complete Real-time results
- 12. Multiple Reports
- 13. Understanding what is working Example: Comparing salespeople – how customers rate them Which products are performing best
- 14. Deep NPS Analysis Multiple ways of viewing NPS using drill down filters Evolution of Detractors, Promoters over weeks/months Score Frequency charts
- 15. Voice of Customer – Comments clickable drill down Understand voice of customer by different segments
- 16. Categorise comments – understanding the “why” Add richness to customer comments by tagging and classifying Or use “Customer Self-service” in survey* *Optional Extra
- 17. Multiple levels of categorisation Up to 75 different 2-level factors can be stored and tagged
- 18. Reporting on Issues What is causing negative or positive experiences? Issue trends: Are we getting better over time?
- 19. Root Cause Analysis Understand drivers of promoters and detractors “Drill-down” Multiple filter options
- 20. Reporting NPS by Organisation For situations when surveying multiple decision makers and executives in larger organisations Examine scores in the Decision Making Unit Understand NPS by seniority level (eg. A, B, C) or Job Function Compare NPS of Company, and Level to all Organisations Look at individual scores Hover and click through for comments See all information and comments in easy printable form. Acme Corp
- 21. NPS Certificate (new for 2010) To help standardise reporting, new “NPS Certificate” is now standard Shows survey methodology and score per “flight” Can be configured to be shown: privately in CustomerGauge On intranet Publicly on website In press release http://customergauge.com/2010/02/customergauge-introduces-new-b2b-survey-tool-for-net-promoter-score-with-publishable-document-of-record/
- 22. Beyond basics
- 23. A single company dashboard… CustomerGauge can be used to roll up multiple sources of data Geographic or divisional segmentation possible Highly customisable to your needs
- 24. Comparing divisional performance Acme Corp Acme Corporation – Global Net Promoter Scores Acme Corporation – Division A NPS Acme Corporation – Division E NPS Acme Corporation – Division D NPS Acme Corporation – Division B NPS Understand regional and divisional differences
- 25. Surveying Customers Automatically Avoid surveying customers just once a year Customergauge allows automatic surveying options A/B at random 25% each quarter 50% each quarter Plus unsubscribe and non-repeat logic to prevent over-surveying A. Survey customers 2x each year B. Survey customers 1x each year
- 26. Customisation Home Page Other modules available. Eg “Drivers”
- 27. Net Promoter Score® Trend Filter by segments and dates to analyse trends
- 28. Alerts Workflow set up allows alerts to be triggered on certain actions Example: Customer Scores ‘0’ Email sent from CustomerGauge to account manager with comment Workflow marked as “open” Account manager takes action Mark as “closed” Marketing Director can monitor open/closed cases
- 29. Respond Distribute customer feedback around organisation Ensure comments get followed up with workflow tools Email reply templates for speedy answering CustomerGauge “lite” version for call-centre agents Track progress using task manager display
- 30. Segmenting by loyalty and value Find your most loyal customers…. …And the ones about to defect
- 31. Creating Customer Advocates How to prioritise the time to respond to the best customers? Pareto (80/20) and Magic Grid reporting help identify highest spenders “Customer Club” Guide your customer service triage Fix problems or ask for testimonials Reward Rescue
- 32. Digital Signage Customised to needs Show live reporting where needed
- 35. Directness Business Model Software as a Service (SaaS) Secure access via Online portal Use with any web browser No hardware required No IT help needed to implement Speedy implementation Pricing Monthly subscription based on volumes measured Minimal setup fees No license fees Included in all Directness products Customer support Free updates and upgrades Storage of your data Permanent access to your data
- 36. CustomerGauge application “Operational Feedback” Dashboard style Designed for simple use by non-market researchers Sales Managers, Marketing Managers, Executives No technology needed – only an internet connection