PC pacientes neurologicos mujeres G2
•
0 likes•603 views

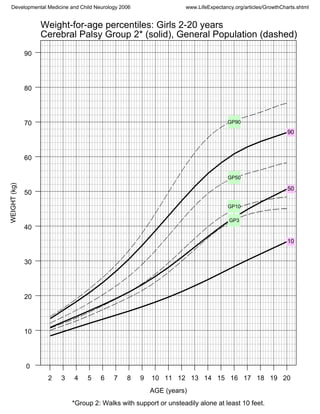
The document contains 3 charts comparing weight, height, and BMI percentiles of girls ages 2 to 20 years with cerebral palsy who can walk with support at least 10 feet (solid lines) to percentiles for the general population (dashed lines). The charts show the 90th, 50th and 10th percentiles for each group based on age.

Recommended
Recommended
More Related Content
More from Andrés Dante Podestá
More from Andrés Dante Podestá (20)
PC pacientes neurologicos mujeres G2
- 1. WEIGHT(kg) AGE (years) 0 10 20 30 40 50 60 70 80 90 2 3 4 5 6 7 8 9 10 11 12 13 14 15 16 17 18 19 20 90 50 10 GP90 GP50 GP10 GP3 Weight-for-age percentiles: Girls 2-20 years Cerebral Palsy Group 2* (solid), General Population (dashed) *Group 2: Walks with support or unsteadily alone at least 10 feet. Developmental Medicine and Child Neurology 2006 www.LifeExpectancy.org/articles/GrowthCharts.shtml
- 2. HEIGHT(cm) AGE (years) 50 60 70 80 90 100 110 120 130 140 150 160 170 180 190 2 3 4 5 6 7 8 9 10 11 12 13 14 15 16 17 18 19 20 90 50 10 GP90 GP50 GP10 Height-for-age percentiles: Girls 2-20 years Cerebral Palsy Group 2* (solid), General Population (dashed) *Group 2: Walks with support or unsteadily alone at least 10 feet. Developmental Medicine and Child Neurology 2006 www.LifeExpectancy.org/articles/GrowthCharts.shtml
- 3. BMI(kg/m2) AGE (years) 0 10 20 30 2 3 4 5 6 7 8 9 10 11 12 13 14 15 16 17 18 19 20 90 50 10 GP90 GP50 GP10 BMI-for-age percentiles: Girls 2-20 years Cerebral Palsy Group 2* (solid), General Population (dashed) *Group 2: Walks with support or unsteadily alone at least 10 feet. Developmental Medicine and Child Neurology 2006 www.LifeExpectancy.org/articles/GrowthCharts.shtml