SlideShare una empresa de Scribd logo
1 de 18
An Algorithm for Building Decision Trees (C4.5) 1. Let T be the set of training instances.2. Choose an attribute that best differentiates the instances in T.3. Create a tree node whose value is the chosen attribute. 	-Create child links from this node where each link  represents a unique value 	  for the chosen attribute.	-Use the child link values to further subdivide the instances into subclasses. 4. For each subclass created in step 3:     	-If the instances in the subclass satisfy predefined criteria or if the set of 	  remaining attribute choices for this path is null, specify the classification 	  for new instances following this decision path. 	-If the subclass does not satisfy the criteria and there is at least one attribute 	  to further subdivide the path of the tree, let T be 	the current set of subclass 	  instances and return to step 2.
Entropy Example Given a set R of objects Entropy(R) = S (–p(I)log2p(I)) where p(I) is the proportion of set R that belongs to class I. An example: If set R is a collection of 14 objects, 9 of them belong to class A, and 5 of them belong to class B, then Entropy(R) = - (9/14) log2 (9/14) - (5/14) log2 (5/14) = 0.940 The range of entropy is from 0 (perfectly classified) to 1 (totally random).
Information Gain Example Actual example: Suppose there are 14 objects in set R, 9 of them belong to the class Evil, 5 of them belong to the class Good. Suppose that each object has an attribute Size, and Size can either be Big or Small. Suppose that out of these 14 objects, 8 have Size = Big, and 6 have Size = Small. Suppose that out of the 8 objects who have Size = Big, 6 are Evil and 2 are Good. Suppose that out of the 6 objects who have Size = Small, 3 are Evil and 3 are Good. Then, the information gain due to splitting R by attribute Size is: Gain(R,Size)=Entropy(R)-(8/14)*Entropy(RBig)-(6/14)*Entropy(RSmall)                       = 0.940 - (8/14)*0.811 - (6/14)*1.00                      = 0.048 Entropy(RBig) = - (6/8)*log2(6/8) - (2/8)*log2(2/8) = 0.811 Entropy(RSmall) = - (3/6)*log2(3/6) - (3/6)*log2(3/6) = 1.00
Which attribute to use as split point for a node in decision tree? At the node, calculate information gain for each attribute. Choose the attribute that has the highest information gain, and use that as the split point. In the preceding example, the attribute Size has only two possible values. Often, an attribute can have more than two possible values, and we’d have to adapt the formula accordingly.
A Decision Tree Example The weather data example.
Information Gained by Knowing the Result of a Decision 	In the weather data example, there are 9 instances of which the decision to play is “yes” and there are 5 instances of which the decision to play is “no”.  Then, the information gained by knowing the result of the decision is
Information Further Required If “Outlook” Is Placed at the Root Outlook sunny overcast rainy yes yes no no no yes yes yes yes yes yes yes no no
Information Gained by Placing Each of the 4 Attributes Gain(outlook) = 0.940 bits – 0.693 bits  	= 0.247 bits. Gain(temperature) = 0.029 bits. Gain(humidity) = 0.152 bits. Gain(windy) = 0.048 bits.
The Strategy for Selecting an Attribute to Place at a Node Select the attribute that gives us the largest information gain. In this example, it is the attribute “Outlook”. Outlook sunny overcast rainy 2 “yes”  3 “no” 4 “yes” 3 “yes” 2 “no”
The Recursive Procedure for Constructing a Decision Tree The operation discussed above is applied to each branch recursively to construct the decision tree. For example, for the branch “Outlook = Sunny”, we evaluate the information gained by applying each of the remaining 3 attributes. Gain(Outlook=sunny;Temperature) = 0.971 – 0.4 = 0.571 Gain(Outlook=sunny;Humidity) = 0.971 – 0 = 0.971 Gain(Outlook=sunny;Windy) = 0.971 – 0.951 = 0.02
Similarly, we also evaluate the information gained by applying each of the remaining 3 attributes for the branch “Outlook = rainy”. Gain(Outlook=rainy;Temperature) = 0.971 – 0.951 = 0.02 Gain(Outlook=rainy;Humidity) = 0.971 – 0.951 = 0.02 Gain(Outlook=rainy;Windy) =0.971 – 0 = 0.971
Over-fitting and Pruning If we recursively build the decision tree based on our training set until each leaf is totally classified, we have most likely over-fitted the data. To avoid over-fitting, we need to set aside part of the training data to test the decision tree, and prune (delete) the branches that give poor predictions.
The Over-fitting Issue Over-fitting is caused by creating decision rules that work accurately on the training set based on insufficient quantity of samples. As a result, these decision rules may not work well in more general cases.
Evaluation Training accuracy How many training instances can be correctly classify based on the available data? Is high when the tree is deep/large, or when there is less confliction in the training instances.  however, higher training accuracy does not mean good generalization Testing accuracy Given a number of new instances, how many of them can we correctly classify? Cross validation
A partial decision tree with root node = income range
A partial decision tree with root node = credit card insurance
A three-node decision tree for the credit card database

Más contenido relacionado

La actualidad más candente

Binary search tree
Binary search treeBinary search tree
Binary search treeRacksaviR
 
Unsupervised Learning
Unsupervised LearningUnsupervised Learning
Unsupervised LearningAlia Hamwi
 
Data structures and algorithms lab10
Data structures and algorithms lab10Data structures and algorithms lab10
Data structures and algorithms lab10Bianca Teşilă
 
Interval intersection
Interval intersectionInterval intersection
Interval intersectionAabida Noman
 
Heap Sort in Design and Analysis of algorithms
Heap Sort in Design and Analysis of algorithmsHeap Sort in Design and Analysis of algorithms
Heap Sort in Design and Analysis of algorithmssamairaakram
 
ID3 Algorithm & ROC Analysis
ID3 Algorithm & ROC AnalysisID3 Algorithm & ROC Analysis
ID3 Algorithm & ROC AnalysisTalha Kabakus
 
Data Compression in Data mining and Business Intelligencs
Data Compression in Data mining and Business Intelligencs Data Compression in Data mining and Business Intelligencs
Data Compression in Data mining and Business Intelligencs ShahDhruv21
 
USING CUCKOO ALGORITHM FOR ESTIMATING TWO GLSD PARAMETERS AND COMPARING IT WI...
USING CUCKOO ALGORITHM FOR ESTIMATING TWO GLSD PARAMETERS AND COMPARING IT WI...USING CUCKOO ALGORITHM FOR ESTIMATING TWO GLSD PARAMETERS AND COMPARING IT WI...
USING CUCKOO ALGORITHM FOR ESTIMATING TWO GLSD PARAMETERS AND COMPARING IT WI...ijcsit
 
WEKA: Practical Machine Learning Tools And Techniques
WEKA: Practical Machine Learning Tools And TechniquesWEKA: Practical Machine Learning Tools And Techniques
WEKA: Practical Machine Learning Tools And TechniquesDataminingTools Inc
 
Presentation on Heap Sort
Presentation on Heap Sort Presentation on Heap Sort
Presentation on Heap Sort Amit Kundu
 
Data Visualization using base graphics
Data Visualization using base graphicsData Visualization using base graphics
Data Visualization using base graphicsRupak Roy
 
Data Analysis project "TITANIC SURVIVAL"
Data Analysis project "TITANIC SURVIVAL"Data Analysis project "TITANIC SURVIVAL"
Data Analysis project "TITANIC SURVIVAL"LefterisMitsimponas
 
Binary Heap Tree, Data Structure
Binary Heap Tree, Data Structure Binary Heap Tree, Data Structure
Binary Heap Tree, Data Structure Anand Ingle
 
Path compression
Path compressionPath compression
Path compressionDEEPIKA T
 

La actualidad más candente (17)

Binary search tree
Binary search treeBinary search tree
Binary search tree
 
ID3 Algorithm
ID3 AlgorithmID3 Algorithm
ID3 Algorithm
 
Unsupervised Learning
Unsupervised LearningUnsupervised Learning
Unsupervised Learning
 
Data structures and algorithms lab10
Data structures and algorithms lab10Data structures and algorithms lab10
Data structures and algorithms lab10
 
Interval intersection
Interval intersectionInterval intersection
Interval intersection
 
Heap Sort in Design and Analysis of algorithms
Heap Sort in Design and Analysis of algorithmsHeap Sort in Design and Analysis of algorithms
Heap Sort in Design and Analysis of algorithms
 
ID3 Algorithm & ROC Analysis
ID3 Algorithm & ROC AnalysisID3 Algorithm & ROC Analysis
ID3 Algorithm & ROC Analysis
 
Data Compression in Data mining and Business Intelligencs
Data Compression in Data mining and Business Intelligencs Data Compression in Data mining and Business Intelligencs
Data Compression in Data mining and Business Intelligencs
 
USING CUCKOO ALGORITHM FOR ESTIMATING TWO GLSD PARAMETERS AND COMPARING IT WI...
USING CUCKOO ALGORITHM FOR ESTIMATING TWO GLSD PARAMETERS AND COMPARING IT WI...USING CUCKOO ALGORITHM FOR ESTIMATING TWO GLSD PARAMETERS AND COMPARING IT WI...
USING CUCKOO ALGORITHM FOR ESTIMATING TWO GLSD PARAMETERS AND COMPARING IT WI...
 
Lect4
Lect4Lect4
Lect4
 
WEKA: Practical Machine Learning Tools And Techniques
WEKA: Practical Machine Learning Tools And TechniquesWEKA: Practical Machine Learning Tools And Techniques
WEKA: Practical Machine Learning Tools And Techniques
 
Presentation on Heap Sort
Presentation on Heap Sort Presentation on Heap Sort
Presentation on Heap Sort
 
Data Visualization using base graphics
Data Visualization using base graphicsData Visualization using base graphics
Data Visualization using base graphics
 
Data Analysis project "TITANIC SURVIVAL"
Data Analysis project "TITANIC SURVIVAL"Data Analysis project "TITANIC SURVIVAL"
Data Analysis project "TITANIC SURVIVAL"
 
Binary Heap Tree, Data Structure
Binary Heap Tree, Data Structure Binary Heap Tree, Data Structure
Binary Heap Tree, Data Structure
 
Path compression
Path compressionPath compression
Path compression
 
Heap sort
Heap sortHeap sort
Heap sort
 

Destacado

The Solar System
The Solar SystemThe Solar System
The Solar Systembingari0922
 
Algoritma C4.5 Dalam Data Mining
Algoritma C4.5 Dalam Data MiningAlgoritma C4.5 Dalam Data Mining
Algoritma C4.5 Dalam Data MiningNasha Dmasive
 
Decision Tree - C4.5&CART
Decision Tree - C4.5&CARTDecision Tree - C4.5&CART
Decision Tree - C4.5&CARTXueping Peng
 
Lecture 3b: Decision Trees (1 part)
Lecture 3b: Decision Trees (1 part)Lecture 3b: Decision Trees (1 part)
Lecture 3b: Decision Trees (1 part) Marina Santini
 
Lecture 4 Decision Trees (2): Entropy, Information Gain, Gain Ratio
Lecture 4 Decision Trees (2): Entropy, Information Gain, Gain RatioLecture 4 Decision Trees (2): Entropy, Information Gain, Gain Ratio
Lecture 4 Decision Trees (2): Entropy, Information Gain, Gain RatioMarina Santini
 

Destacado (8)

The Solar System
The Solar SystemThe Solar System
The Solar System
 
Algoritma C4.5 Dalam Data Mining
Algoritma C4.5 Dalam Data MiningAlgoritma C4.5 Dalam Data Mining
Algoritma C4.5 Dalam Data Mining
 
Decision Tree - C4.5&CART
Decision Tree - C4.5&CARTDecision Tree - C4.5&CART
Decision Tree - C4.5&CART
 
Id3,c4.5 algorithim
Id3,c4.5 algorithimId3,c4.5 algorithim
Id3,c4.5 algorithim
 
Lecture6 - C4.5
Lecture6 - C4.5Lecture6 - C4.5
Lecture6 - C4.5
 
Lecture 3b: Decision Trees (1 part)
Lecture 3b: Decision Trees (1 part)Lecture 3b: Decision Trees (1 part)
Lecture 3b: Decision Trees (1 part)
 
Decision tree Using c4.5 Algorithm
Decision tree Using c4.5 AlgorithmDecision tree Using c4.5 Algorithm
Decision tree Using c4.5 Algorithm
 
Lecture 4 Decision Trees (2): Entropy, Information Gain, Gain Ratio
Lecture 4 Decision Trees (2): Entropy, Information Gain, Gain RatioLecture 4 Decision Trees (2): Entropy, Information Gain, Gain Ratio
Lecture 4 Decision Trees (2): Entropy, Information Gain, Gain Ratio
 

Similar a An algorithm for building

ML_Unit_1_Part_C
ML_Unit_1_Part_CML_Unit_1_Part_C
ML_Unit_1_Part_CSrimatre K
 
module_3_1.pptx
module_3_1.pptxmodule_3_1.pptx
module_3_1.pptxWanderer20
 
module_3_1.pptx
module_3_1.pptxmodule_3_1.pptx
module_3_1.pptxWanderer20
 
Machine learning session6(decision trees random forrest)
Machine learning   session6(decision trees random forrest)Machine learning   session6(decision trees random forrest)
Machine learning session6(decision trees random forrest)Abhimanyu Dwivedi
 
Random forest sgv_ai_talk_oct_2_2018
Random forest sgv_ai_talk_oct_2_2018Random forest sgv_ai_talk_oct_2_2018
Random forest sgv_ai_talk_oct_2_2018digitalzombie
 
Classification decision tree
Classification  decision treeClassification  decision tree
Classification decision treeyazad dumasia
 
Random Forest / Bootstrap Aggregation
Random Forest / Bootstrap AggregationRandom Forest / Bootstrap Aggregation
Random Forest / Bootstrap AggregationRupak Roy
 
Download presentation source
Download presentation sourceDownload presentation source
Download presentation sourcebutest
 
Machine learning basics using trees algorithm (Random forest, Gradient Boosting)
Machine learning basics using trees algorithm (Random forest, Gradient Boosting)Machine learning basics using trees algorithm (Random forest, Gradient Boosting)
Machine learning basics using trees algorithm (Random forest, Gradient Boosting)Parth Khare
 
Chapter 02-logistic regression
Chapter 02-logistic regressionChapter 02-logistic regression
Chapter 02-logistic regressionRaman Kannan
 
Machine learning and decision trees
Machine learning and decision treesMachine learning and decision trees
Machine learning and decision treesPadma Metta
 
Kaggle Otto Challenge: How we achieved 85th out of 3,514 and what we learnt
Kaggle Otto Challenge: How we achieved 85th out of 3,514 and what we learntKaggle Otto Challenge: How we achieved 85th out of 3,514 and what we learnt
Kaggle Otto Challenge: How we achieved 85th out of 3,514 and what we learntEugene Yan Ziyou
 
Data Mining In Market Research
Data Mining In Market ResearchData Mining In Market Research
Data Mining In Market Researchjim
 
Data Mining in Market Research
Data Mining in Market ResearchData Mining in Market Research
Data Mining in Market Researchbutest
 
Data Mining In Market Research
Data Mining In Market ResearchData Mining In Market Research
Data Mining In Market Researchkevinlan
 

Similar a An algorithm for building (20)

ML_Unit_1_Part_C
ML_Unit_1_Part_CML_Unit_1_Part_C
ML_Unit_1_Part_C
 
module_3_1.pptx
module_3_1.pptxmodule_3_1.pptx
module_3_1.pptx
 
module_3_1.pptx
module_3_1.pptxmodule_3_1.pptx
module_3_1.pptx
 
Decision tree learning
Decision tree learningDecision tree learning
Decision tree learning
 
Decision tree
Decision treeDecision tree
Decision tree
 
Decision tree
Decision treeDecision tree
Decision tree
 
Machine learning session6(decision trees random forrest)
Machine learning   session6(decision trees random forrest)Machine learning   session6(decision trees random forrest)
Machine learning session6(decision trees random forrest)
 
Random forest sgv_ai_talk_oct_2_2018
Random forest sgv_ai_talk_oct_2_2018Random forest sgv_ai_talk_oct_2_2018
Random forest sgv_ai_talk_oct_2_2018
 
Decision tree and random forest
Decision tree and random forestDecision tree and random forest
Decision tree and random forest
 
Classification decision tree
Classification  decision treeClassification  decision tree
Classification decision tree
 
Random Forest / Bootstrap Aggregation
Random Forest / Bootstrap AggregationRandom Forest / Bootstrap Aggregation
Random Forest / Bootstrap Aggregation
 
Download presentation source
Download presentation sourceDownload presentation source
Download presentation source
 
Dbm630 lecture06
Dbm630 lecture06Dbm630 lecture06
Dbm630 lecture06
 
Machine learning basics using trees algorithm (Random forest, Gradient Boosting)
Machine learning basics using trees algorithm (Random forest, Gradient Boosting)Machine learning basics using trees algorithm (Random forest, Gradient Boosting)
Machine learning basics using trees algorithm (Random forest, Gradient Boosting)
 
Chapter 02-logistic regression
Chapter 02-logistic regressionChapter 02-logistic regression
Chapter 02-logistic regression
 
Machine learning and decision trees
Machine learning and decision treesMachine learning and decision trees
Machine learning and decision trees
 
Kaggle Otto Challenge: How we achieved 85th out of 3,514 and what we learnt
Kaggle Otto Challenge: How we achieved 85th out of 3,514 and what we learntKaggle Otto Challenge: How we achieved 85th out of 3,514 and what we learnt
Kaggle Otto Challenge: How we achieved 85th out of 3,514 and what we learnt
 
Data Mining In Market Research
Data Mining In Market ResearchData Mining In Market Research
Data Mining In Market Research
 
Data Mining in Market Research
Data Mining in Market ResearchData Mining in Market Research
Data Mining in Market Research
 
Data Mining In Market Research
Data Mining In Market ResearchData Mining In Market Research
Data Mining In Market Research
 

Último

Influencing policy (training slides from Fast Track Impact)
Influencing policy (training slides from Fast Track Impact)Influencing policy (training slides from Fast Track Impact)
Influencing policy (training slides from Fast Track Impact)Mark Reed
 
What is Model Inheritance in Odoo 17 ERP
What is Model Inheritance in Odoo 17 ERPWhat is Model Inheritance in Odoo 17 ERP
What is Model Inheritance in Odoo 17 ERPCeline George
 
THEORIES OF ORGANIZATION-PUBLIC ADMINISTRATION
THEORIES OF ORGANIZATION-PUBLIC ADMINISTRATIONTHEORIES OF ORGANIZATION-PUBLIC ADMINISTRATION
THEORIES OF ORGANIZATION-PUBLIC ADMINISTRATIONHumphrey A Beña
 
Procuring digital preservation CAN be quick and painless with our new dynamic...
Procuring digital preservation CAN be quick and painless with our new dynamic...Procuring digital preservation CAN be quick and painless with our new dynamic...
Procuring digital preservation CAN be quick and painless with our new dynamic...Jisc
 
Roles & Responsibilities in Pharmacovigilance
Roles & Responsibilities in PharmacovigilanceRoles & Responsibilities in Pharmacovigilance
Roles & Responsibilities in PharmacovigilanceSamikshaHamane
 
Q4 English4 Week3 PPT Melcnmg-based.pptx
Q4 English4 Week3 PPT Melcnmg-based.pptxQ4 English4 Week3 PPT Melcnmg-based.pptx
Q4 English4 Week3 PPT Melcnmg-based.pptxnelietumpap1
 
Judging the Relevance and worth of ideas part 2.pptx
Judging the Relevance  and worth of ideas part 2.pptxJudging the Relevance  and worth of ideas part 2.pptx
Judging the Relevance and worth of ideas part 2.pptxSherlyMaeNeri
 
Keynote by Prof. Wurzer at Nordex about IP-design
Keynote by Prof. Wurzer at Nordex about IP-designKeynote by Prof. Wurzer at Nordex about IP-design
Keynote by Prof. Wurzer at Nordex about IP-designMIPLM
 
Earth Day Presentation wow hello nice great
Earth Day Presentation wow hello nice greatEarth Day Presentation wow hello nice great
Earth Day Presentation wow hello nice greatYousafMalik24
 
Gas measurement O2,Co2,& ph) 04/2024.pptx
Gas measurement O2,Co2,& ph) 04/2024.pptxGas measurement O2,Co2,& ph) 04/2024.pptx
Gas measurement O2,Co2,& ph) 04/2024.pptxDr.Ibrahim Hassaan
 
Full Stack Web Development Course for Beginners
Full Stack Web Development Course  for BeginnersFull Stack Web Development Course  for Beginners
Full Stack Web Development Course for BeginnersSabitha Banu
 
GRADE 4 - SUMMATIVE TEST QUARTER 4 ALL SUBJECTS
GRADE 4 - SUMMATIVE TEST QUARTER 4 ALL SUBJECTSGRADE 4 - SUMMATIVE TEST QUARTER 4 ALL SUBJECTS
GRADE 4 - SUMMATIVE TEST QUARTER 4 ALL SUBJECTSJoshuaGantuangco2
 
Computed Fields and api Depends in the Odoo 17
Computed Fields and api Depends in the Odoo 17Computed Fields and api Depends in the Odoo 17
Computed Fields and api Depends in the Odoo 17Celine George
 
ANG SEKTOR NG agrikultura.pptx QUARTER 4
ANG SEKTOR NG agrikultura.pptx QUARTER 4ANG SEKTOR NG agrikultura.pptx QUARTER 4
ANG SEKTOR NG agrikultura.pptx QUARTER 4MiaBumagat1
 
ENGLISH6-Q4-W3.pptxqurter our high choom
ENGLISH6-Q4-W3.pptxqurter our high choomENGLISH6-Q4-W3.pptxqurter our high choom
ENGLISH6-Q4-W3.pptxqurter our high choomnelietumpap1
 

Último (20)

Influencing policy (training slides from Fast Track Impact)
Influencing policy (training slides from Fast Track Impact)Influencing policy (training slides from Fast Track Impact)
Influencing policy (training slides from Fast Track Impact)
 
What is Model Inheritance in Odoo 17 ERP
What is Model Inheritance in Odoo 17 ERPWhat is Model Inheritance in Odoo 17 ERP
What is Model Inheritance in Odoo 17 ERP
 
THEORIES OF ORGANIZATION-PUBLIC ADMINISTRATION
THEORIES OF ORGANIZATION-PUBLIC ADMINISTRATIONTHEORIES OF ORGANIZATION-PUBLIC ADMINISTRATION
THEORIES OF ORGANIZATION-PUBLIC ADMINISTRATION
 
Procuring digital preservation CAN be quick and painless with our new dynamic...
Procuring digital preservation CAN be quick and painless with our new dynamic...Procuring digital preservation CAN be quick and painless with our new dynamic...
Procuring digital preservation CAN be quick and painless with our new dynamic...
 
TataKelola dan KamSiber Kecerdasan Buatan v022.pdf
TataKelola dan KamSiber Kecerdasan Buatan v022.pdfTataKelola dan KamSiber Kecerdasan Buatan v022.pdf
TataKelola dan KamSiber Kecerdasan Buatan v022.pdf
 
Roles & Responsibilities in Pharmacovigilance
Roles & Responsibilities in PharmacovigilanceRoles & Responsibilities in Pharmacovigilance
Roles & Responsibilities in Pharmacovigilance
 
Q4 English4 Week3 PPT Melcnmg-based.pptx
Q4 English4 Week3 PPT Melcnmg-based.pptxQ4 English4 Week3 PPT Melcnmg-based.pptx
Q4 English4 Week3 PPT Melcnmg-based.pptx
 
Judging the Relevance and worth of ideas part 2.pptx
Judging the Relevance  and worth of ideas part 2.pptxJudging the Relevance  and worth of ideas part 2.pptx
Judging the Relevance and worth of ideas part 2.pptx
 
Keynote by Prof. Wurzer at Nordex about IP-design
Keynote by Prof. Wurzer at Nordex about IP-designKeynote by Prof. Wurzer at Nordex about IP-design
Keynote by Prof. Wurzer at Nordex about IP-design
 
Earth Day Presentation wow hello nice great
Earth Day Presentation wow hello nice greatEarth Day Presentation wow hello nice great
Earth Day Presentation wow hello nice great
 
Gas measurement O2,Co2,& ph) 04/2024.pptx
Gas measurement O2,Co2,& ph) 04/2024.pptxGas measurement O2,Co2,& ph) 04/2024.pptx
Gas measurement O2,Co2,& ph) 04/2024.pptx
 
FINALS_OF_LEFT_ON_C'N_EL_DORADO_2024.pptx
FINALS_OF_LEFT_ON_C'N_EL_DORADO_2024.pptxFINALS_OF_LEFT_ON_C'N_EL_DORADO_2024.pptx
FINALS_OF_LEFT_ON_C'N_EL_DORADO_2024.pptx
 
YOUVE GOT EMAIL_FINALS_EL_DORADO_2024.pptx
YOUVE GOT EMAIL_FINALS_EL_DORADO_2024.pptxYOUVE GOT EMAIL_FINALS_EL_DORADO_2024.pptx
YOUVE GOT EMAIL_FINALS_EL_DORADO_2024.pptx
 
Full Stack Web Development Course for Beginners
Full Stack Web Development Course  for BeginnersFull Stack Web Development Course  for Beginners
Full Stack Web Development Course for Beginners
 
GRADE 4 - SUMMATIVE TEST QUARTER 4 ALL SUBJECTS
GRADE 4 - SUMMATIVE TEST QUARTER 4 ALL SUBJECTSGRADE 4 - SUMMATIVE TEST QUARTER 4 ALL SUBJECTS
GRADE 4 - SUMMATIVE TEST QUARTER 4 ALL SUBJECTS
 
YOUVE_GOT_EMAIL_PRELIMS_EL_DORADO_2024.pptx
YOUVE_GOT_EMAIL_PRELIMS_EL_DORADO_2024.pptxYOUVE_GOT_EMAIL_PRELIMS_EL_DORADO_2024.pptx
YOUVE_GOT_EMAIL_PRELIMS_EL_DORADO_2024.pptx
 
LEFT_ON_C'N_ PRELIMS_EL_DORADO_2024.pptx
LEFT_ON_C'N_ PRELIMS_EL_DORADO_2024.pptxLEFT_ON_C'N_ PRELIMS_EL_DORADO_2024.pptx
LEFT_ON_C'N_ PRELIMS_EL_DORADO_2024.pptx
 
Computed Fields and api Depends in the Odoo 17
Computed Fields and api Depends in the Odoo 17Computed Fields and api Depends in the Odoo 17
Computed Fields and api Depends in the Odoo 17
 
ANG SEKTOR NG agrikultura.pptx QUARTER 4
ANG SEKTOR NG agrikultura.pptx QUARTER 4ANG SEKTOR NG agrikultura.pptx QUARTER 4
ANG SEKTOR NG agrikultura.pptx QUARTER 4
 
ENGLISH6-Q4-W3.pptxqurter our high choom
ENGLISH6-Q4-W3.pptxqurter our high choomENGLISH6-Q4-W3.pptxqurter our high choom
ENGLISH6-Q4-W3.pptxqurter our high choom
 

An algorithm for building

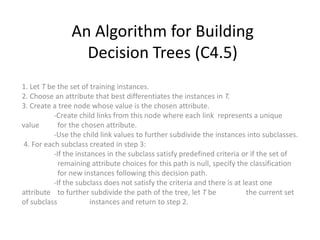
  • 1. An Algorithm for Building Decision Trees (C4.5) 1. Let T be the set of training instances.2. Choose an attribute that best differentiates the instances in T.3. Create a tree node whose value is the chosen attribute. -Create child links from this node where each link represents a unique value for the chosen attribute. -Use the child link values to further subdivide the instances into subclasses. 4. For each subclass created in step 3: -If the instances in the subclass satisfy predefined criteria or if the set of remaining attribute choices for this path is null, specify the classification for new instances following this decision path. -If the subclass does not satisfy the criteria and there is at least one attribute to further subdivide the path of the tree, let T be the current set of subclass instances and return to step 2.
  • 2. Entropy Example Given a set R of objects Entropy(R) = S (–p(I)log2p(I)) where p(I) is the proportion of set R that belongs to class I. An example: If set R is a collection of 14 objects, 9 of them belong to class A, and 5 of them belong to class B, then Entropy(R) = - (9/14) log2 (9/14) - (5/14) log2 (5/14) = 0.940 The range of entropy is from 0 (perfectly classified) to 1 (totally random).
  • 3. Information Gain Example Actual example: Suppose there are 14 objects in set R, 9 of them belong to the class Evil, 5 of them belong to the class Good. Suppose that each object has an attribute Size, and Size can either be Big or Small. Suppose that out of these 14 objects, 8 have Size = Big, and 6 have Size = Small. Suppose that out of the 8 objects who have Size = Big, 6 are Evil and 2 are Good. Suppose that out of the 6 objects who have Size = Small, 3 are Evil and 3 are Good. Then, the information gain due to splitting R by attribute Size is: Gain(R,Size)=Entropy(R)-(8/14)*Entropy(RBig)-(6/14)*Entropy(RSmall) = 0.940 - (8/14)*0.811 - (6/14)*1.00 = 0.048 Entropy(RBig) = - (6/8)*log2(6/8) - (2/8)*log2(2/8) = 0.811 Entropy(RSmall) = - (3/6)*log2(3/6) - (3/6)*log2(3/6) = 1.00
  • 4. Which attribute to use as split point for a node in decision tree? At the node, calculate information gain for each attribute. Choose the attribute that has the highest information gain, and use that as the split point. In the preceding example, the attribute Size has only two possible values. Often, an attribute can have more than two possible values, and we’d have to adapt the formula accordingly.
  • 5. A Decision Tree Example The weather data example.
  • 6. Information Gained by Knowing the Result of a Decision In the weather data example, there are 9 instances of which the decision to play is “yes” and there are 5 instances of which the decision to play is “no”. Then, the information gained by knowing the result of the decision is
  • 7. Information Further Required If “Outlook” Is Placed at the Root Outlook sunny overcast rainy yes yes no no no yes yes yes yes yes yes yes no no
  • 8. Information Gained by Placing Each of the 4 Attributes Gain(outlook) = 0.940 bits – 0.693 bits = 0.247 bits. Gain(temperature) = 0.029 bits. Gain(humidity) = 0.152 bits. Gain(windy) = 0.048 bits.
  • 9. The Strategy for Selecting an Attribute to Place at a Node Select the attribute that gives us the largest information gain. In this example, it is the attribute “Outlook”. Outlook sunny overcast rainy 2 “yes” 3 “no” 4 “yes” 3 “yes” 2 “no”
  • 10. The Recursive Procedure for Constructing a Decision Tree The operation discussed above is applied to each branch recursively to construct the decision tree. For example, for the branch “Outlook = Sunny”, we evaluate the information gained by applying each of the remaining 3 attributes. Gain(Outlook=sunny;Temperature) = 0.971 – 0.4 = 0.571 Gain(Outlook=sunny;Humidity) = 0.971 – 0 = 0.971 Gain(Outlook=sunny;Windy) = 0.971 – 0.951 = 0.02
  • 11. Similarly, we also evaluate the information gained by applying each of the remaining 3 attributes for the branch “Outlook = rainy”. Gain(Outlook=rainy;Temperature) = 0.971 – 0.951 = 0.02 Gain(Outlook=rainy;Humidity) = 0.971 – 0.951 = 0.02 Gain(Outlook=rainy;Windy) =0.971 – 0 = 0.971
  • 12. Over-fitting and Pruning If we recursively build the decision tree based on our training set until each leaf is totally classified, we have most likely over-fitted the data. To avoid over-fitting, we need to set aside part of the training data to test the decision tree, and prune (delete) the branches that give poor predictions.
  • 13. The Over-fitting Issue Over-fitting is caused by creating decision rules that work accurately on the training set based on insufficient quantity of samples. As a result, these decision rules may not work well in more general cases.
  • 14.
  • 15. Evaluation Training accuracy How many training instances can be correctly classify based on the available data? Is high when the tree is deep/large, or when there is less confliction in the training instances. however, higher training accuracy does not mean good generalization Testing accuracy Given a number of new instances, how many of them can we correctly classify? Cross validation
  • 16. A partial decision tree with root node = income range
  • 17. A partial decision tree with root node = credit card insurance
  • 18. A three-node decision tree for the credit card database