This document provides instructions for making a contour map from elevation data measured in meters. The contour interval is 10 meters. Students are directed to highlight data points that are multiples of 10 meters, and connect them with contour lines that separate higher and lower elevations. The lowest value on the map is to be highlighted first.
1. Name:______________________________ Period: ______ Date: _____________________
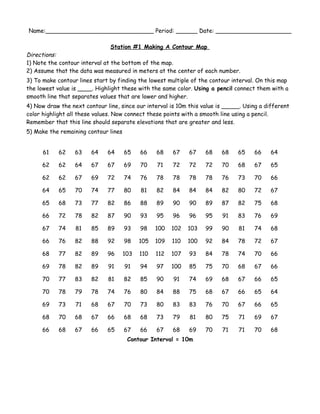
Station #1 Making A Contour Map
Directions:
1) Note the contour interval at the bottom of the map.
2) Assume that the data was measured in meters at the center of each number.
3) To make contour lines start by finding the lowest multiple of the contour interval. On this map
the lowest value is ____. Highlight these with the same color. Using a pencil connect them with a
smooth line that separates values that are lower and higher.
4) Now draw the next contour line, since our interval is 10m this value is _____. Using a different
color highlight all these values. Now connect these points with a smooth line using a pencil.
Remember that this line should separate elevations that are greater and less.
5) Make the remaining contour lines
61 62 63 64 64 65 66 68 67 67 68 68 65 66 64
62 62 64 67 67 69 70 71 72 72 72 70 68 67 65
62 62 67 69 72 74 76 78 78 78 78 76 73 70 66
64 65 70 74 77 80 81 82 84 84 84 82 80 72 67
65 68 73 77 82 86 88 89 90 90 89 87 82 75 68
66 72 78 82 87 90 93 95 96 96 95 91 83 76 69
67 74 81 85 89 93 98 100 102 103 99 90 81 74 68
66 76 82 88 92 98 105 109 110 100 92 84 78 72 67
68 77 82 89 96 103 110 112 107 93 84 78 74 70 66
69 78 82 89 91 91 94 97 100 85 75 70 68 67 66
70 77 83 82 81 82 85 90 91 74 69 68 67 66 65
70 78 79 78 74 76 80 84 88 75 68 67 66 65 64
69 73 71 68 67 70 73 80 83 83 76 70 67 66 65
68 70 68 67 66 68 68 73 79 81 80 75 71 69 67
66 68 67 66 65 67 66 67 68 69 70 71 71 70 68
Contour Interval = 10m
2. Station # 2 Contour Mapping
1. What is the contour interval of this map? ______________
2. Number all the contour lines.
3. What is the scale of miles of this map? ______________
4. By means of the scale, measure the distance from the top of hill B to the top of hill A. _______
5. Which side of hill A has the steepest slope? _____________________
6. How can you tell whether a landform has a steep or gentle slopes?
__________________________________________________________________________
7. In what direction from hill A is hill B? ___________
8. What is the elevation above sea level of hill A?
9. a) Which of the two hill is higher? _________ b) How much higher? _______________
10. If you climbed to the top of hill B from C, how many feet would you climb?
11. In what direction is the Red River flowing? _________________ How do you know?
_________________________________________________
12. Shade the area on the map which would be under water if the sea level rose 40 feet.
13. Calculate the gradient of the Red River from point D to the ocean.
3. Station # 3: Drawing a Profile
1. What is the gradient of the slope between point A and point B. Show all work including the
formula.
2. Construct a profile of this map from point C to D.
5. Station #4: Contour Mapping Rules
Directions: Read these rules and use them to fill in the blanks for the Conclusion
Questions.
1. A contour line represents a single equal elevation: that is, all points on the same contour line have
the same elevation.
2. Where one closed contour line surrounds another, the inner contour line represents the higher
elevation.
3. The elevation represented by a contour line is always a simple multiple of the contour interval.
4. A contour line that closes within the limits of the map indicates a hill, ridge or plateau.
5. Commonly, every fifth contour line (index contour) is darker and its elevation is shown.
6. On the same map, closely spaced contour lines indicate a relatively steep slope, widely spaced
contour lines indicate a relatively gentle slope, and uniformly spaced contour lines indicate a
uniform slope.
7. Contour lines do not cross other contour lines. Exception: on a vertical cliff or a nearly vertical
cliff, contour lines touch because they are on top of one another
8. Every contour line eventually closes against itself. However, the map area may not be large
enough to show this closure. Therefore, the contours will end at the edge of the map.
9. Closed depressions are shown by hachured contour lines. The hachures point into the
depression. (Hachures = short dashes)
10. A hachured contour line, lying between two different contour lines, is the same elevation as the
lower contour line.
11. Where two adjacent contours indicate opposite slopes (hachured contour next to plain
contour), both are the SAME elevation.
12. Where a contour line crosses a stream or valley, the contour bends to form a “V” that points
upstream or up the valley. Therefore the river flows opposite the direction of the “v”
13. A topographic map is aerial view of a location with contour lines that indicate areas of equal
elevation above sea level (sea level = 0m)
14.
6. Station #4: Contour Mapping Rules
Conclusion Questions
1. The difference in value between two contour lines is called the ____________.
2. The zero contour line is ______________.
3. The line that is shaded darker than the other contour lines is the _________________.
4. A topographic map shows ____________________________________________________.
5. The closer the contour lines, the __________ the slope; the father
apart the contour lines, the ___________ the slope.
6. Contour lines form ____________ when they cross streams or valleys.
This _________ points _____________ or ___________.
7. Closed depressions are shown by _____________________.
8. Every contour line eventually _______________________.
9. Gradient is equal to _________________________________. *First page of your ESRT*
10. A ___________________________ is a side view of a particular area.
11. The ________________________________ can be determined by
estimating the distance between contour lines
7. Station # 5: Critical Thinking (you can do it!)
An island measures 10 kilometers from east to west and 8 kilometers from north to south. A single
hill on the east side of the island has a maximum elevation of 57 Meters and is steepest to the
north. In the box below, draw a simple contour map to represent this island, using a distance scale
of 1 centimeter = 1 kilometer and a contour interval of 10 meters.
N
8. Station 6: Using a Globe
Part 1: Use the globes to complete the data charts 1 and 2
Data Chart 1
Place Latitude Longitude
Southern tip of Florida
Eastern edge of Iceland
Southern tip of India
Southern tip of Greenland
Suez Canal
Data Chart 2
Latitude Longitude Location (Country)
40° N 140° E
15° N 75° E
45° N 90° W
32° S 118° E
30° S 20° E
20° S 43° W
Conclusion Questions:
1. What is the highest number of degrees latitude that exists?
2. What is the latitude of the North Pole?
3. Explain why two lines of latitude never touch each other
9. Station # 7: Time Zones
Longitude lines have two major purposes. First when used in location. In addition, longitude
lines also separate time zones.
Using a globe fill in Data Chart 3 with the appropriate information.
Column 1: # of degrees around the Column 2: # of degrees Column 3: # of longitude lines around
globe between lines of longitude the globe (column 1/ column 2)
Questions:
1) What does the number calculated in column 3 remind you of?
2) How many hours are between each line of longitude
3) How many degrees longitude are equal to one hour of time?
4) If two cities are located on the same line of longitude, what else do the two cities have
in common?
10. Station #8 Latitude and Longitude
How do latitude and longitude coordinates help us see patterns on Earth?
Steps to use classzone
1. use internet browser to go to classzone.com
2. Choose subject: Science
3. Click on Earth Science textbook
4. Click on “Go to the Exploring Earth Web site”
5. Enter Keycode number ES0303 and click go
6. Follow the instructions on the screen.
7. Use the worksheet provided to record your answers.
Questions:
1. How does sea surface temperature appear to change with latitude?
2. How does sea surface temperature appear to change with longitude?
3. Which lines (longitutde or latitude) run from north to south?
4. Which lines (longitutde or latitude) run from east to west?
5. Which line is the reference line for longitude?
6. Which line is the reference line for latitude?
7. Describe the distribution of sea surface temperatures around the world.
8. How does sea surface temperature change along latitude lines?
9. How does sea surface temperature change along longitude lines?
10. What conclusion might you have drawn had you looked at global sea surface
temperatures along only one latitude line?
11. Station #1 Making A Contour Map
Directions:
1) Note the contour interval at the bottom of the map.
2) Assume that the data was measured in meters at the center of each number.
3) To make contour lines start by finding the lowest multiple of the contour interval. On this map
the lowest value is ____. Highlight these with the same color. Using a pencil connect them with a
smooth line that separates values that are lower and higher.
4) Now draw the next contour line, since our interval is 10m this value is _____. Using a different
color highlight all these values. Now connect these points with a smooth line using a pencil.
Remember that this line should separate elevations that are greater and less.
5) Make the remaining contour lines
61 62 63 64 64 65 66 68 67 67 68 68 65 66 64
62 62 64 67 67 69 70 71 72 72 72 70 68 67 65
62 62 67 69 72 74 76 78 78 78 78 76 73 70 66
64 65 70 74 77 80 81 82 84 84 84 82 80 72 67
65 68 73 77 82 86 88 89 90 90 89 87 82 75 68
66 72 78 82 87 90 93 95 96 96 95 91 83 76 69
67 74 81 85 89 93 98 100 102 103 99 90 81 74 68
66 76 82 88 92 98 105 109 110 100 92 84 78 72 67
68 77 82 89 96 103 110 112 107 93 84 78 74 70 66
69 78 82 89 91 91 94 97 100 85 75 70 68 67 66
70 77 83 82 81 82 85 90 91 74 69 68 67 66 65
70 78 79 78 74 76 80 84 88 75 68 67 66 65 64