SlideShare una empresa de Scribd logo
1 de 74
Descargar para leer sin conexión
Geology of the
          lithosphere
The lithosphere is the outer solid part of the earth, including
the crust and uppermost mantle. The lithosphere is about 100
km thick, although its thickness is age dependent (older litho-
sphere is thicker). The lithosphere below the crust is brittle
enough at some locations to produce earthquakes by faulting,
such as within a subducted oceanic plate. Source: USGS
 THE BASE OF THE LITHOSPHERE IS DEFINED AS
                  THE 1300oC ISOTHERM
The Earth loses heat through it’s surface.

Volcanoes produce molten rock suggesting internal heat is much hotter than surface
heat.

Generally the temperature increases depth: 1km deep =30oC above surface
temperatures.

The rate at which temperature rises (geothermal gradient) varies.

In some parts of the crust the temperature rises slowly whilst in other parts it
rises rapidly.

Steep geothermal gradients are found in areas of igneous activity: magma chambers
or cooling batholiths provide heat sources at depth.

Since the inside of the earth is hotter than the outside it follows that heat must
flow outwards.

HEAT FLOW is measured in joules per square metre per second (J m-2 s-1 ).

The steeper the geothermal gradient the greater the heat flow.

Rocks which are relatively good conductors permit a high heat flow.

Heat flow is measured at depths below @ 30m so that solar input does not affect
results.
Heat flow over the earth


There is a general relationship of high heat flow associated
with the igneous activity of oceanic ridges and young mountain
ranges while lowest values are found in ancient shield areas.

Area of Earth’s Surface       Heat Flow (J m-2 s-1 )

Whole Earth                   0.069

All Oceans                    0.069

All Continents                0.069

Ocean Basins                  0.053

Oceanic Ridges                0.080

Oceanic Trenches              0.049

Ancient Shield areas          0.041
(older than 570 Ma)

Platform areas                0.062
(younger than 570 Ma)

Old mountain areas            0.060
(570-225 Ma)

Young mountain areas          0.074
(younger than 225 Ma)
   Average heat flows from continental and oceanic crust are about
    equal.
   Observed heat flow of continental crust could easily be produced
    by the rocks of the continental crust.
   Continental crust appears to have a higher concentration
    (compared to Oceanic crust) of long-lived radioactive isotopes—the
    decay of which is the most important source of the earth’s heat.
   Oceanic crust could not produce the observed heat flow so it would
    appear that the heat is comes from the underlying mantle.
   This suggests that the mantle under the oceans is hotter than the
    mantle under the continents.
   This suggests that convection currents exist under the oceans but
    not under the continents.
   The currents bring heat from greater depth, they turn and flow
    under the oceanic giving off heat which escapes through the crust.
   The fact that the highest levels of heat flow occur at the ocean
    ridges an decreases across the ocean basins (lowest values at ocean
    trenches) suggests that the currents rise under the ridges , flow
    under the ocean basins and sink under the ocean trenches.
Just to jog your memories from last year..
Rock strength related to temperature

We all know that rocks near the surface of the Earth behave in a brittle
manner. Crustal rocks are composed of minerals like quartz and feldspar
which have high strength, particularly at low pressure and temperature.
As we go deeper in the Earth the strength of these rocks initially in-
creases. At a depth of about 15 km we reach a point called the brit-
tle-ductile transition zone. Below this point rock strength decreases
because fractures become closed and the temperature is higher,
making the rocks behave in a ductile manner. At the base of the crust
the rock type changes to peridotite which is rich in olivine. Olivine is
stronger than the minerals that make up most crustal rocks, so the upper
part of the mantle is again strong. But, just as in the crust, increasing
temperature eventually predominates and at a depth of about 40 km the
brittle-ductile transition zone in the mantle occurs. Below this point


                       http://www.tulane.edu/~sanelson/geol111/deform.htm
Diagram 1


Diagram 2


               Diagram 3
C


C

                      Diagram 4


    Look at the four diagrams provided:

    Explain the distinction between the Lithosphere and Asthenosphere (quote from the diagrams)


    What is the difference in the melting points of wet and dry granite?
Read page 142—Webster

With the aid of diagrams explain why localised melting in the asthenosphere generates basaltic magmas.
Use geological terminology including: Benioff zone.
Why could this scenario be classified as idealistic?
THE BASE OF THE LITHOSPHERE IS DEFINED AS THE 1300oC ISOTHERM

What is meant by the term isotherm?

Describe the pattern of lithospheric thickness using the diagram above:


How might this relate to the age of the lithosphere?
Seismology and the Lithospshere


Seismic waves are waves of energy that travel through the earth, for example as a
result of an earthquake, explosion, or some other process that imparts low-
frequency acoustic energy. The propagation velocity of the waves depends on den-
sity and elasticity of the medium. Velocity tends to increase with depth, and ranges
from approximately 2 to 8 km/s in the Earth's crust up to 13 km/s in the deep man-
tle.

Earthquakes create various types of waves with different velocities; when reaching
seismic observatories, their different travel time enables the scientists to locate
the epicenter. In geophysics the refraction or reflection of seismic waves is used
for research of the Earth's interior, and artificial vibrations to investigate subsur-
face structures.
Read page 119 of McLeish

Draw and label diagram 6.8
Add bullet points about the velocities of earthquake waves















Body waves

Body waves travel through the interior of the Earth. They follow raypaths refracted
by the varying density and modulus (stiffness) of the Earth's interior. The density
and modulus, in turn, vary according to temperature and composition. This effect is
similar to the refraction of light waves.

P-waves

P waves (primary waves) are compressional waves that are longitudinal in nature. P
waves are pressure waves that are the initial set of waves produced by an earth-
quake. These waves can travel through any type of material, and can travel at nearly
twice the speed of S waves.: 1450 m/s in water and about 5000 m/s in granite.

S-waves

S waves (secondary waves) are shear waves that are transverse in nature. These
waves typically follows P waves during an earthquake and displaces the ground per-
pendicular to the direction of propagation. S waves can travel only through solids, as
fluids (liquids and gases) do not support shear stresses. S waves are slower than P
waves, and speeds are typically around 60% of that of P waves in any given material.


  Both waves get slower as the density of the medium increases.
  P waves get faster as the compressibility decreases.
  S waves get faster as rigidity increases. (Liquids have a zero rigidity)
Read pages 121/122/123 of McLeish:
1.  Draw and explain diagram 6.13


2.   Draw and explain 6.14


         A) Why do the waves bend?


         B) Why do the waves speed up with depth?
3.   What is the Moho? (this is covered in more detail in the next few pages)


4.   What is the thickness of oceanic and continental crust?


5. What happens to P and S waves just below the Moho?
Using the diagram above describe the relationship between velocity and depth of the seismic P wave:
Using the diagrams above describe the relationship between velocity and depth of the seismic S
waves, suggest an explanation for this occurrence:
How can such data be used to show crustal layering?


What can be deduced about the internal structure of the crust?


How can such data be used to calculate the thickness of the crust?


Why are earthquakes rare occur in the asthenosphere?
Extra Reading and research can be found at COCORP and
BIRPS:

Below is an extract from the COCORP website -


The Consortium for Continental Reflection Profiling (COCORP)
pioneered the use of multichannel seismic reflection profiling
for the systematic exploration of the continental lithosphere.
COCORP-type profiles routinely probe to the base of the crust
and frequently deeper. COCORP has collected over eleven thou-
sand kilometers of profiling at thirty sites in the United
States. Among the best known of COCORP's US results are its
demonstration of large-scale, low-angle thrust faulting in the
Appalachians; confirmation of a thrust origin for Laramide
basement uplifts; delineation of the variable character of the
continental Moho, including new evidence for its post-orogenic
re-equilibration, its multi-genetic origin (including phase
changes) and possible role as a structural detachment; magma
"bright spots" beneath Cenozoic rifts of the western US;
crustal-scale detachment faults in the eastern Basin and
Range; mapping of major buried Precambrian layered sequences
in interior US; and definition of crustal shear zones marking
major Proterzoic sutures of the buried craton.

The success of COCORP stimulated major deep seismic explo-
ration programs in over twenty countries, including Great Brit-
ain (BIRPS), France (ECORS), Germany (DEKORP) and Canada
(LITHOPROBE).
Using Figures 2a and 2b complete Figure 2c to show the Lithosphere and Astheno-
sphere.


Looking back at the thickness of the lithosphere how do you think depth of the
low velocity zone correlates to the distance from the oceanic ridges?
The Mohorovičić discontinuity (Croatian pronunciation: [mɔhɔˈrɔvitʃitɕ]) (MOE-HOE-
ROE-vee-cheech), usually referred to as the Moho, is the boundary between the
Earth's crust and the mantle. Named after the pioneering Croatian seisomologist
Andrija Mohorovičić, the Moho separates both oceanic crust and continental crust
from underlying mantle. The Moho mostly lies entirely within the lithosphere; only
beneath mid-ocean ridges does it define the lithosphere – asthenosphere boundary.
The Mohorovičić discontinuity was first identified in 1909 by Mohorovičić, when he
observed that seismograms from shallow-focus earthquakes had two sets of P-waves
and S-waves, one that followed a direct path near the Earth's surface and the other
refracted by a high velocity medium.[1]

The Mohorovičić discontinuity is 5 to 10 kilometres (3–6 mi) below the ocean floor
and 20 to 90 kilometres (10–60 mi) beneath typical continents, with an average of 35
kilometres (22 mi) beneath them.


Two paths of a P-wave, one direct and one refracted as it crosses the Moho

Immediately above the Moho the velocities of primary seismic waves (P-waves) are
approximately those of basalt (6.7 – 7.2 km/s), and below they are that of peri-
dotitic or dunitic Earth-materials (7.6 – 8.6 km/s).[3] That suggests the Moho marks
a change of composition, but the interface appears to be too even for any believable
sorting mechanism within the Earth. Near-surface observations suggest such sorting
produces an irregular surface. Some history of suggestions that the boundary marks
instead a phase change controlled by a temperature gradient in the Earth. (See
McLeish page 122/123 for further detail)
The Moho is a high velocity medium. Which P wave would travel fastest—the wave
that passed through the Moho or the wave that travelled within the overlying crust?


From Specimen paper:

3. Describe and explain how a study of earthquake body waves provides
evidence for the variation in thickness and mechanical properties of the
lithosphere and asthenosphere.
[25]

Use the text books, classwork and research to plan the answer to the above essay.
The mark scheme below should help you.

3. Holistic approach (12+1 marks description) (12+1 marks explanation)
Define earthquake body waves.
Use of/explanation of formulae for P and S wave velocities.
Incompressibility v density changes - P-wave
Rigidity v density - S-wave
Depth profile of P and S waves to show velocity variation.
Depth of the Low velocity zone with distance from spreading centre.
Thickening of the lithosphere with age and distance from ridge.
Diagrams credited
Definition of the difference between Lithosphere and Asthenosphere in terms of
mechanical
properties.
Lithosphere = plate. Cold (<1300o C isotherm) -Brittle thus fractures.
Asthenosphere = partially molten (5 %) - Ductile thus flows
Total 25 marks


You will have 35 minutes to write the response under timed conditions in class.
You may on this first occasion use your notes.


Poor responses will have to repeat the timed task after college until an accept-
able standard is achieved.
Oceanic crust is the part of Earth's lithosphere that surfaces in the
ocean basins. Oceanic crust is primarily composed of mafic rocks, which
is rich in iron and magnesium. It is thinner than continental crust, gener-
ally less than 10 kilometers thick, however it is denser, having a mean
density of about 3.3 grams per cubic centimeter.

Although a complete section of oceanic crust has not yet been drilled,
geologists have several pieces of evidence that help them understand
the ocean floor. Estimations of composition are based on analyses of
ophiolites (sections of oceanic crust that are preserved on the conti-
nents), comparisons of the seismic structure of the oceanic crust with
laboratory determinations of seismic velocities in known rock types, and
samples recovered from the ocean floor by submersibles, dredging
(especially from ridge crests and fracture zones) and drilling. Oceanic
crust is significantly simpler than continental crust and generally can be
divided in three layers.

Layer 1 is on an average 0.4 km thick. It consists of unconsolidated or
semiconsolidated sediments, usually thin or even not present near the
mid-ocean ridges but thickens farther away from the ridge. Near the
continental margins sediment is terrigenous, meaning derived from the
land, unlike deep sea sediments which are made of tiny shells of marine
organisms, usually calcareous and siliceous, or it can be made of volcanic
ash and terrigenous sediments transported by turbidity currents.

Layer 2 could be divided into two parts: layer 2A – 0.5 km thick upper-
most volcanic layer of glassy to finely crystalline basalt usually in the
form of pillow basalt, and layer 2B – 1.5 km thick layer composed of dia-
base dykes.

Layer 3 is formed by slow cooling of magma beneath the surface and
consists of coarse grained gabbros and cumulate ultramafic rocks. It
constitutes over two-thirds of oceanic crust volume with almost 5 km
thickness.
Label the Moho in the above diagram.


Note the diagrams below show symmetry. You can be asked to complete half a diagram in the exam.
Label the Moho
2002
Ophiolites


Ophiolites are pieces of oceanic plate that have been thrusted (obducted) onto the
edge of continental plates. They provide models for processes at mid-ocean ridges.

Ophiolites are an assemblage of mafic and ultramafic lavas and hypabyssal rocks
found in association with sedimentary rocks like greywackes and cherts. They are
found in areas that have complex structure. Cross-sections simplified from R.C.
Coleman, 1981, Journal of Geophysical Research, v. 86, p. 2497-2508.

Ophiolites have been found in Cyprus, New Guinea, Newfoundland, California, and
Oman. The Samail ophiolite in southeastern Oman has probably been studied in the
greatest detail. The rocks probably formed in the Cretaceous not far from the what is
now the Persian Gulf. The rocks were later thrust (pushed uphill at a low angle)
westward onto the Arabian shield.


Why do Ophiolites give evidence for the composition of oceanic crust and upper
mantle?
This is an American diagram in UK
                                                   we spell: DYKES


Ophiolites are characterized by a classic sequence of rocks. This sequence is well
exposed at the Samail ophiolite. The base of the sequence is sedimentary rocks of
the Arabian shield, not part of the ophiolite, on which the oceanic plate was pushed.
From base to top the ophiolite is made of: peridotite, layered gabbro, massive gab-
bro, dykes, and volcanic rocks. At Samail this entire sequence is 15 km thick. The
basal peridotite is made of a rock called harzburgite (made mostly of the minerals
olivine and enstatite). Within the peridotite are many dikes of gabbro and dunite.
The peridotite is deformed. The peridotite is overlain by dunite (an intrusive igneous
rock made mostly of the mineral olivine) that grades upward to gabbro (an intrusive
igneous rock made mostly of plagioclase and clinopyroxene - augite). The sequence
is capped by dikes and volcanic rocks (pillow basalts that erupted on the ocean
floor). Sequence of rocks simplified from R.C. Coleman (1981).

This Oman classic ophiolite complex should be studied carefully.

You can be examined on this or a similar sequence.
From a tectonic perspective, the peridotite is depleted mantle that was under the magma chamber
at the mid-ocean ridge crest. The gabbro layer is related, in some way, to the crystallization of the
magma chamber (probably with repeated injections of magma). The dikes and volcanic rocks are
formed by magma in transit to or at the surface. Cross-section simplified from Pallister, J.S., and
Hopson, C.A., 1981, Journal of Geophysical Research, v. 86, p. 2593-2644.

To learn more about gabbro and other igneous rocks review the Geotour Igneous Rocks Module or
visit the petrography homepage.

To see a classic bit of oceanic crust that has been thrusted up on a continent (an ophiolite ) visit the
Oman Virtual Field Trip.


Source of Information:

McBirney, A.R., 1985, Igneous petrology: Freeman Cooper & Co.


Space for your own notes:/research:

Where can ophiolites be found in Britain?


Why do ophiolites not typically show magnetic anomalies?
How can ocean drilling be used to provide evidence for the
composition of oceanic crust and upper mantle?
Give an example of an ocean core.
How might the evidence compare with that of ophiolites?
2004
Oceanic


What do these two diagrams show?


                                         Continental
Complete this diagram


Extra : Read pages 174/176 McLeish
What does the above diagram indicate about the plate movements in
the Atlantic and Pacific Oceans?
Work out the rate of movement for each ocean.
What does the diagram below indicate?
What is the relationship between the direction of magnetism and the table above?
How can the diagrams above help to provide a frame of reference for calculating the rate of seafloor
spreading?


How can radiometric dating and ocean drilling be used to date magnetic anomalies?
Hot Spots
Read page 44/45 of the OCR book
Copy the formula to calculate the rates of sea floor spreading.
Answer questions 1,2 and 3 from page 45.
Oceanic lithosphere consists mainly of mafic crust and
ultramafic mantle (peridotite) and is denser than the
continental lithosphere, for which the mantle is associated with
crust made of silicic rocks. Oceanic lithosphere thickens as it
ages and moves away from the mid-ocean ridge. This
thickening occurs by conductive cooling, which converts hot
asthenosphere into lithospheric mantle, and causes the
oceanic lithosphere to become increasingly thick and dense
with age. Oceanic lithosphere is less dense than
asthenosphere for a few tens of millions of years, but after this
becomes increasingly denser than the asthenosphere. The
gravitational instability of mature oceanic lithosphere has the
effect that, at subduction zones, the oceanic lithosphere
invariably sinks underneath the overriding lithosphere, which
can be oceanic or continental. New oceanic lithosphere is
constantly being produced at mid-ocean ridges and is
recycled back to the mantle at subduction zones. As a result,
oceanic lithosphere is much younger than continental
lithosphere: the oldest oceanic lithosphere is about 170 million
years old, while parts of the continental lithosphere are billions
of years old.


Write a definition for each of the following terms:

MAFIC


ULTRAMAFIC


SILICIC
What conclusions can be drawn from the diagram above?
Firstly describe the pattern of earthquakes, then try to explain the trend shown. Look
back at the previous page.
Label a likely location for Ophiolites.
Explain why the volcano could produce basalt, andesite or granite.
LABEL THE DIRECTION OF PLATE MOVEMENT


Explain how an accretionary prism is formed.
LEARN THIS DIAGRAM FOR ESSAYS!!


Use page 39 of the OCR text book to complete the above diagram.
Use notes from page 40 Oceanic—continental convergent plate margin to
explain the processes below.
Create a mind map for the information on page 40 OCR book:
Oceanic –Oceanic convergent plate margin
Include the diagram of the cross section.
Draw diagram b from page 39 of the OCR text book and write 10 bullet points to
explain the process. Make sure you give specific examples throughout.
Make notes on the ppt point presentation given in class. Use page 43 of the OCR book to supplement your
notes.


                      GL5, Theme 4, Key Idea 2:
                      The J. Tuzo Wilson Cycle –
                        Ocean Basin Evolution


   Continental rift
   formation –
   constructive
   plate margin
Oceanic-continental destructive plate margin
        e.g. Andes, South America
Continental-continental destructive plate margin
         e.g. India/Tibet and the Alps


     Age of crust is calculated using radio isotope
                         dating
Past examples of ocean formation
             and closure.
 Iapetus ocean, closed causing the Caledonian
  orogeny (Siliurian to Early Devonian, roughly
  440-390Ma)
 Tethys ocean closed as India collided with

  Eurasia forming the Himalayas and Africa
  collided with Europe forming the Alps (end
  Cretaceous, early Tertiary)
(see movie)


                    GEOLOGY GL5
                   THEMATIC UNIT 4
            GEOLOGY OF THE LITHOSPHERE
              A.M. MONDAY, 24 June 2002

4. Describe and explain the evidence for ocean basin evolution
   (formation, growth and destruction) as proposed in the J. Tuzo Wilson
   cycle.

           [25]
Why does the continental lithosphere resist subduction?


What does this suggest about the age of continental crust?
What conclusions can be drawn about the distribution of the ages of
the rocks in the diagrams above?
What do you think an inside out continent would be?
(Extra reading :Super continent by Ted Neild
Partial Melting and granite magmatism

In pairs try to answer Q1 2008 paper.
Then write 10 bullet points for your notes
ISOSTASY

Use Webster page 17 and your own research to explain isostatic uplift and gravitation collapse. Make sure you use
diagrams!!
Use the internet to research isostasy.
Use published lithosphere sections and densities to compare the relative weights and
heights of columns of continental and oceanic lithosphere.
What is delamination?
How might this explain the Tibetan Plateau?
What impact could this have on the direction of stress and subsequent
faulting in the Tibetan Plateau region?
Read 157,158,159 of Webster
Use diagrams and bullet points to show how the fold mountains were formed during the closing of the Iapetus Ocean.
4. (a) Describe how fold mountains are formed.
(b) Evaluate the importance of isostasy during their formation. [25]       2010

You will write this under timed conditions 35mins. (Remember to include diagrams) You must achieve
your target grade or you will have repeat the exercise under timed conditions in your lunchtime.

Use the space below to plan your response:
What type of faults are above?
What is the direction of stress?
Use Webster page 100/157/158 to explain the formation of the Moine Thrust.
(Note the folding takes place before the faulting.)
http://www.see.leeds.ac.uk/structure/faults/stress/

Research and make notes from this website on the direction of stress in faults. Use diagrams!!! Then answer Q1 2004 .
4. (a) Describe how forces acting on continental lithosphere may cause brittle or ductile
deformation.
(b) Evaluate the importance of the depth in the lithosphere on the types of deformation
produced. [25]
Research for homework -to be completed under timed conditions.


Use the past papers to complete the data response and essay questions you have not yet done.
This is good for revision!!!

Please see me if you get stuck and use the mark schemes to help you understand what the exam-
iners are looking for.

(There are one or two essay questions that would not now be in GL5 but in GL4 instead.)
Lithosphere

Más contenido relacionado

La actualidad más candente

Precambrian geology
Precambrian geologyPrecambrian geology
Precambrian geologyPramoda Raj
 
Internal structure of the earth
Internal structure of the earthInternal structure of the earth
Internal structure of the earthJahangir Alam
 
Principles of stratigraphy
Principles of stratigraphyPrinciples of stratigraphy
Principles of stratigraphyOmer M. Ahmed
 
Sedimentary depositional environments
Sedimentary depositional environmentsSedimentary depositional environments
Sedimentary depositional environmentsuos
 
The Rock Cycle and Rocks
The Rock Cycle and RocksThe Rock Cycle and Rocks
The Rock Cycle and Rocksrebelbrindley
 
Cycle of erosion, davis and penk
Cycle of erosion, davis and penkCycle of erosion, davis and penk
Cycle of erosion, davis and penkRajithK
 
The Structure of the Earth and Plate Tectonics
The Structure of the Earth and Plate TectonicsThe Structure of the Earth and Plate Tectonics
The Structure of the Earth and Plate TectonicsSteven Heath
 
Geography - Landforms, water, Glacier, Wind - Pragnya IAS Academy - Civil Ser...
Geography - Landforms, water, Glacier, Wind - Pragnya IAS Academy - Civil Ser...Geography - Landforms, water, Glacier, Wind - Pragnya IAS Academy - Civil Ser...
Geography - Landforms, water, Glacier, Wind - Pragnya IAS Academy - Civil Ser...Pragnya IAS Academy
 
Glaciers and its types
Glaciers and its types Glaciers and its types
Glaciers and its types GCUF
 
Metamorphism limits temperature and pressure limits
Metamorphism  limits temperature and pressure limits Metamorphism  limits temperature and pressure limits
Metamorphism limits temperature and pressure limits Sajith Sadanandan
 

La actualidad más candente (20)

Mass wasting processes
Mass wasting processesMass wasting processes
Mass wasting processes
 
Metamorphic rocks
Metamorphic rocksMetamorphic rocks
Metamorphic rocks
 
Precambrian geology
Precambrian geologyPrecambrian geology
Precambrian geology
 
Sedimentary Rocks
Sedimentary RocksSedimentary Rocks
Sedimentary Rocks
 
Internal structure of the earth
Internal structure of the earthInternal structure of the earth
Internal structure of the earth
 
Mass Movement
Mass MovementMass Movement
Mass Movement
 
MASS WASTING
MASS WASTINGMASS WASTING
MASS WASTING
 
Wilson cycle
Wilson cycleWilson cycle
Wilson cycle
 
Principles of stratigraphy
Principles of stratigraphyPrinciples of stratigraphy
Principles of stratigraphy
 
Sedimentary depositional environments
Sedimentary depositional environmentsSedimentary depositional environments
Sedimentary depositional environments
 
Mass wasting
Mass wastingMass wasting
Mass wasting
 
The Rock Cycle and Rocks
The Rock Cycle and RocksThe Rock Cycle and Rocks
The Rock Cycle and Rocks
 
Cycle of erosion, davis and penk
Cycle of erosion, davis and penkCycle of erosion, davis and penk
Cycle of erosion, davis and penk
 
Mass wasting 2
Mass wasting 2Mass wasting 2
Mass wasting 2
 
The Structure of the Earth and Plate Tectonics
The Structure of the Earth and Plate TectonicsThe Structure of the Earth and Plate Tectonics
The Structure of the Earth and Plate Tectonics
 
Geography - Landforms, water, Glacier, Wind - Pragnya IAS Academy - Civil Ser...
Geography - Landforms, water, Glacier, Wind - Pragnya IAS Academy - Civil Ser...Geography - Landforms, water, Glacier, Wind - Pragnya IAS Academy - Civil Ser...
Geography - Landforms, water, Glacier, Wind - Pragnya IAS Academy - Civil Ser...
 
Endogenous processes on earth
Endogenous processes on earthEndogenous processes on earth
Endogenous processes on earth
 
Glaciers and its types
Glaciers and its types Glaciers and its types
Glaciers and its types
 
THE EARTH'S CRUST
THE EARTH'S CRUSTTHE EARTH'S CRUST
THE EARTH'S CRUST
 
Metamorphism limits temperature and pressure limits
Metamorphism  limits temperature and pressure limits Metamorphism  limits temperature and pressure limits
Metamorphism limits temperature and pressure limits
 

Similar a Lithosphere

Internal Structure of The Earth? Major Structural unit of the earth
Internal Structure of The Earth? Major  Structural unit of the earthInternal Structure of The Earth? Major  Structural unit of the earth
Internal Structure of The Earth? Major Structural unit of the earthUday Kumar Shil
 
Chemical and Physical Properties of Earth's Layers and the Tectonic Plates (G...
Chemical and Physical Properties of Earth's Layers and the Tectonic Plates (G...Chemical and Physical Properties of Earth's Layers and the Tectonic Plates (G...
Chemical and Physical Properties of Earth's Layers and the Tectonic Plates (G...Raboon Redar
 
Quarter 1-Introduction to Plate Tectonics Part 2.
Quarter 1-Introduction to Plate Tectonics Part 2.Quarter 1-Introduction to Plate Tectonics Part 2.
Quarter 1-Introduction to Plate Tectonics Part 2.AnilynAcostaDizon
 
Aaa earthquake engineering2
Aaa earthquake engineering2Aaa earthquake engineering2
Aaa earthquake engineering2Edz Gapuz
 
Grade 10_science1stquartermodule1.pptx
Grade 10_science1stquartermodule1.pptxGrade 10_science1stquartermodule1.pptx
Grade 10_science1stquartermodule1.pptxErlenaMirador1
 
Plate tectonicsslideshow
Plate tectonicsslideshowPlate tectonicsslideshow
Plate tectonicsslideshowLynnCorliss
 
L3 EARTH'S INTERNAL HEAT.pptx
L3 EARTH'S INTERNAL HEAT.pptxL3 EARTH'S INTERNAL HEAT.pptx
L3 EARTH'S INTERNAL HEAT.pptxLearni Escote
 
Internaldynamics4eso
Internaldynamics4esoInternaldynamics4eso
Internaldynamics4esomartagar78
 
PLATE TECTONICS(GRADE10SCIENCE 1STQUARTER MODULE1)
PLATE TECTONICS(GRADE10SCIENCE 1STQUARTER MODULE1)PLATE TECTONICS(GRADE10SCIENCE 1STQUARTER MODULE1)
PLATE TECTONICS(GRADE10SCIENCE 1STQUARTER MODULE1)DARYL (MONKAYO NHS)
 
g10science1stquartermodule1-200502160553 (2).pdf
g10science1stquartermodule1-200502160553 (2).pdfg10science1stquartermodule1-200502160553 (2).pdf
g10science1stquartermodule1-200502160553 (2).pdfKhaoriVladir
 

Similar a Lithosphere (20)

01 chapter:Earthquake
01 chapter:Earthquake01 chapter:Earthquake
01 chapter:Earthquake
 
Eq chapter
Eq chapterEq chapter
Eq chapter
 
Plate Tectonics
Plate TectonicsPlate Tectonics
Plate Tectonics
 
Unit 5 - Disaster Management
Unit 5 - Disaster ManagementUnit 5 - Disaster Management
Unit 5 - Disaster Management
 
Internal Structure of The Earth? Major Structural unit of the earth
Internal Structure of The Earth? Major  Structural unit of the earthInternal Structure of The Earth? Major  Structural unit of the earth
Internal Structure of The Earth? Major Structural unit of the earth
 
Plate Tectonics
Plate TectonicsPlate Tectonics
Plate Tectonics
 
Chemical and Physical Properties of Earth's Layers and the Tectonic Plates (G...
Chemical and Physical Properties of Earth's Layers and the Tectonic Plates (G...Chemical and Physical Properties of Earth's Layers and the Tectonic Plates (G...
Chemical and Physical Properties of Earth's Layers and the Tectonic Plates (G...
 
Quarter 1-Introduction to Plate Tectonics Part 2.
Quarter 1-Introduction to Plate Tectonics Part 2.Quarter 1-Introduction to Plate Tectonics Part 2.
Quarter 1-Introduction to Plate Tectonics Part 2.
 
Aaa earthquake engineering2
Aaa earthquake engineering2Aaa earthquake engineering2
Aaa earthquake engineering2
 
Geo persentaion
Geo persentaion Geo persentaion
Geo persentaion
 
Grade 10_science1stquartermodule1.pptx
Grade 10_science1stquartermodule1.pptxGrade 10_science1stquartermodule1.pptx
Grade 10_science1stquartermodule1.pptx
 
Plate tectonicsslideshow
Plate tectonicsslideshowPlate tectonicsslideshow
Plate tectonicsslideshow
 
Lithosphere
LithosphereLithosphere
Lithosphere
 
L3 EARTH'S INTERNAL HEAT.pptx
L3 EARTH'S INTERNAL HEAT.pptxL3 EARTH'S INTERNAL HEAT.pptx
L3 EARTH'S INTERNAL HEAT.pptx
 
Final Exam Extra Answers
Final Exam Extra AnswersFinal Exam Extra Answers
Final Exam Extra Answers
 
Internaldynamics4eso
Internaldynamics4esoInternaldynamics4eso
Internaldynamics4eso
 
CSEC GEOGRAPHY
CSEC GEOGRAPHY CSEC GEOGRAPHY
CSEC GEOGRAPHY
 
PLATE TECTONICS(GRADE10SCIENCE 1STQUARTER MODULE1)
PLATE TECTONICS(GRADE10SCIENCE 1STQUARTER MODULE1)PLATE TECTONICS(GRADE10SCIENCE 1STQUARTER MODULE1)
PLATE TECTONICS(GRADE10SCIENCE 1STQUARTER MODULE1)
 
g10science1stquartermodule1-200502160553 (2).pdf
g10science1stquartermodule1-200502160553 (2).pdfg10science1stquartermodule1-200502160553 (2).pdf
g10science1stquartermodule1-200502160553 (2).pdf
 
Fountains of the deep
Fountains of the deepFountains of the deep
Fountains of the deep
 

Más de angelabentley

Hydrographs tcm4 134116
Hydrographs tcm4 134116Hydrographs tcm4 134116
Hydrographs tcm4 134116angelabentley
 
The hydrological cycle
The hydrological cycleThe hydrological cycle
The hydrological cycleangelabentley
 
Organic chemical sedimentary_rockssmall
Organic chemical sedimentary_rockssmallOrganic chemical sedimentary_rockssmall
Organic chemical sedimentary_rockssmallangelabentley
 
Sedimentary structures smallas
Sedimentary structures smallasSedimentary structures smallas
Sedimentary structures smallasangelabentley
 
Sedimentary structures smallas
Sedimentary structures smallasSedimentary structures smallas
Sedimentary structures smallasangelabentley
 
Metamorphismpptpntn.ppt2
Metamorphismpptpntn.ppt2Metamorphismpptpntn.ppt2
Metamorphismpptpntn.ppt2angelabentley
 
Clastic sedimentary rockssmall
Clastic sedimentary rockssmallClastic sedimentary rockssmall
Clastic sedimentary rockssmallangelabentley
 
Classifying igneous rocks
Classifying igneous rocksClassifying igneous rocks
Classifying igneous rocksangelabentley
 

Más de angelabentley (20)

AS Geology mapping
AS  Geology mappingAS  Geology mapping
AS Geology mapping
 
Dinosaurfootprints
DinosaurfootprintsDinosaurfootprints
Dinosaurfootprints
 
Dinosaursmodeoflife
DinosaursmodeoflifeDinosaursmodeoflife
Dinosaursmodeoflife
 
Hydrographs tcm4 134116
Hydrographs tcm4 134116Hydrographs tcm4 134116
Hydrographs tcm4 134116
 
The hydrological cycle
The hydrological cycleThe hydrological cycle
The hydrological cycle
 
Fossils
FossilsFossils
Fossils
 
Glacial landforms2
Glacial landforms2Glacial landforms2
Glacial landforms2
 
Glacial landforms
Glacial landformsGlacial landforms
Glacial landforms
 
Glacial features
Glacial featuresGlacial features
Glacial features
 
Organic chemical sedimentary_rockssmall
Organic chemical sedimentary_rockssmallOrganic chemical sedimentary_rockssmall
Organic chemical sedimentary_rockssmall
 
Sedimentary structures smallas
Sedimentary structures smallasSedimentary structures smallas
Sedimentary structures smallas
 
Sedimentary structures smallas
Sedimentary structures smallasSedimentary structures smallas
Sedimentary structures smallas
 
Metamorphismpptpntn.ppt2
Metamorphismpptpntn.ppt2Metamorphismpptpntn.ppt2
Metamorphismpptpntn.ppt2
 
Metamorphism intro
Metamorphism introMetamorphism intro
Metamorphism intro
 
Lava textures
Lava texturesLava textures
Lava textures
 
Igneousrockssmall
IgneousrockssmallIgneousrockssmall
Igneousrockssmall
 
Graphiclogs
GraphiclogsGraphiclogs
Graphiclogs
 
Graphiclogs
GraphiclogsGraphiclogs
Graphiclogs
 
Clastic sedimentary rockssmall
Clastic sedimentary rockssmallClastic sedimentary rockssmall
Clastic sedimentary rockssmall
 
Classifying igneous rocks
Classifying igneous rocksClassifying igneous rocks
Classifying igneous rocks
 

Último

Streamlining Python Development: A Guide to a Modern Project Setup
Streamlining Python Development: A Guide to a Modern Project SetupStreamlining Python Development: A Guide to a Modern Project Setup
Streamlining Python Development: A Guide to a Modern Project SetupFlorian Wilhelm
 
Anypoint Exchange: It’s Not Just a Repo!
Anypoint Exchange: It’s Not Just a Repo!Anypoint Exchange: It’s Not Just a Repo!
Anypoint Exchange: It’s Not Just a Repo!Manik S Magar
 
H2O.ai CEO/Founder: Sri Ambati Keynote at Wells Fargo Day
H2O.ai CEO/Founder: Sri Ambati Keynote at Wells Fargo DayH2O.ai CEO/Founder: Sri Ambati Keynote at Wells Fargo Day
H2O.ai CEO/Founder: Sri Ambati Keynote at Wells Fargo DaySri Ambati
 
DevoxxFR 2024 Reproducible Builds with Apache Maven
DevoxxFR 2024 Reproducible Builds with Apache MavenDevoxxFR 2024 Reproducible Builds with Apache Maven
DevoxxFR 2024 Reproducible Builds with Apache MavenHervé Boutemy
 
SIP trunking in Janus @ Kamailio World 2024
SIP trunking in Janus @ Kamailio World 2024SIP trunking in Janus @ Kamailio World 2024
SIP trunking in Janus @ Kamailio World 2024Lorenzo Miniero
 
Human Factors of XR: Using Human Factors to Design XR Systems
Human Factors of XR: Using Human Factors to Design XR SystemsHuman Factors of XR: Using Human Factors to Design XR Systems
Human Factors of XR: Using Human Factors to Design XR SystemsMark Billinghurst
 
Advanced Computer Architecture – An Introduction
Advanced Computer Architecture – An IntroductionAdvanced Computer Architecture – An Introduction
Advanced Computer Architecture – An IntroductionDilum Bandara
 
Unleash Your Potential - Namagunga Girls Coding Club
Unleash Your Potential - Namagunga Girls Coding ClubUnleash Your Potential - Namagunga Girls Coding Club
Unleash Your Potential - Namagunga Girls Coding ClubKalema Edgar
 
Are Multi-Cloud and Serverless Good or Bad?
Are Multi-Cloud and Serverless Good or Bad?Are Multi-Cloud and Serverless Good or Bad?
Are Multi-Cloud and Serverless Good or Bad?Mattias Andersson
 
Advanced Test Driven-Development @ php[tek] 2024
Advanced Test Driven-Development @ php[tek] 2024Advanced Test Driven-Development @ php[tek] 2024
Advanced Test Driven-Development @ php[tek] 2024Scott Keck-Warren
 
Hyperautomation and AI/ML: A Strategy for Digital Transformation Success.pdf
Hyperautomation and AI/ML: A Strategy for Digital Transformation Success.pdfHyperautomation and AI/ML: A Strategy for Digital Transformation Success.pdf
Hyperautomation and AI/ML: A Strategy for Digital Transformation Success.pdfPrecisely
 
Connect Wave/ connectwave Pitch Deck Presentation
Connect Wave/ connectwave Pitch Deck PresentationConnect Wave/ connectwave Pitch Deck Presentation
Connect Wave/ connectwave Pitch Deck PresentationSlibray Presentation
 
Leverage Zilliz Serverless - Up to 50X Saving for Your Vector Storage Cost
Leverage Zilliz Serverless - Up to 50X Saving for Your Vector Storage CostLeverage Zilliz Serverless - Up to 50X Saving for Your Vector Storage Cost
Leverage Zilliz Serverless - Up to 50X Saving for Your Vector Storage CostZilliz
 
Powerpoint exploring the locations used in television show Time Clash
Powerpoint exploring the locations used in television show Time ClashPowerpoint exploring the locations used in television show Time Clash
Powerpoint exploring the locations used in television show Time Clashcharlottematthew16
 
"ML in Production",Oleksandr Bagan
"ML in Production",Oleksandr Bagan"ML in Production",Oleksandr Bagan
"ML in Production",Oleksandr BaganFwdays
 
Story boards and shot lists for my a level piece
Story boards and shot lists for my a level pieceStory boards and shot lists for my a level piece
Story boards and shot lists for my a level piececharlottematthew16
 
DSPy a system for AI to Write Prompts and Do Fine Tuning
DSPy a system for AI to Write Prompts and Do Fine TuningDSPy a system for AI to Write Prompts and Do Fine Tuning
DSPy a system for AI to Write Prompts and Do Fine TuningLars Bell
 
Nell’iperspazio con Rocket: il Framework Web di Rust!
Nell’iperspazio con Rocket: il Framework Web di Rust!Nell’iperspazio con Rocket: il Framework Web di Rust!
Nell’iperspazio con Rocket: il Framework Web di Rust!Commit University
 
DevEX - reference for building teams, processes, and platforms
DevEX - reference for building teams, processes, and platformsDevEX - reference for building teams, processes, and platforms
DevEX - reference for building teams, processes, and platformsSergiu Bodiu
 

Último (20)

Streamlining Python Development: A Guide to a Modern Project Setup
Streamlining Python Development: A Guide to a Modern Project SetupStreamlining Python Development: A Guide to a Modern Project Setup
Streamlining Python Development: A Guide to a Modern Project Setup
 
Anypoint Exchange: It’s Not Just a Repo!
Anypoint Exchange: It’s Not Just a Repo!Anypoint Exchange: It’s Not Just a Repo!
Anypoint Exchange: It’s Not Just a Repo!
 
H2O.ai CEO/Founder: Sri Ambati Keynote at Wells Fargo Day
H2O.ai CEO/Founder: Sri Ambati Keynote at Wells Fargo DayH2O.ai CEO/Founder: Sri Ambati Keynote at Wells Fargo Day
H2O.ai CEO/Founder: Sri Ambati Keynote at Wells Fargo Day
 
DevoxxFR 2024 Reproducible Builds with Apache Maven
DevoxxFR 2024 Reproducible Builds with Apache MavenDevoxxFR 2024 Reproducible Builds with Apache Maven
DevoxxFR 2024 Reproducible Builds with Apache Maven
 
E-Vehicle_Hacking_by_Parul Sharma_null_owasp.pptx
E-Vehicle_Hacking_by_Parul Sharma_null_owasp.pptxE-Vehicle_Hacking_by_Parul Sharma_null_owasp.pptx
E-Vehicle_Hacking_by_Parul Sharma_null_owasp.pptx
 
SIP trunking in Janus @ Kamailio World 2024
SIP trunking in Janus @ Kamailio World 2024SIP trunking in Janus @ Kamailio World 2024
SIP trunking in Janus @ Kamailio World 2024
 
Human Factors of XR: Using Human Factors to Design XR Systems
Human Factors of XR: Using Human Factors to Design XR SystemsHuman Factors of XR: Using Human Factors to Design XR Systems
Human Factors of XR: Using Human Factors to Design XR Systems
 
Advanced Computer Architecture – An Introduction
Advanced Computer Architecture – An IntroductionAdvanced Computer Architecture – An Introduction
Advanced Computer Architecture – An Introduction
 
Unleash Your Potential - Namagunga Girls Coding Club
Unleash Your Potential - Namagunga Girls Coding ClubUnleash Your Potential - Namagunga Girls Coding Club
Unleash Your Potential - Namagunga Girls Coding Club
 
Are Multi-Cloud and Serverless Good or Bad?
Are Multi-Cloud and Serverless Good or Bad?Are Multi-Cloud and Serverless Good or Bad?
Are Multi-Cloud and Serverless Good or Bad?
 
Advanced Test Driven-Development @ php[tek] 2024
Advanced Test Driven-Development @ php[tek] 2024Advanced Test Driven-Development @ php[tek] 2024
Advanced Test Driven-Development @ php[tek] 2024
 
Hyperautomation and AI/ML: A Strategy for Digital Transformation Success.pdf
Hyperautomation and AI/ML: A Strategy for Digital Transformation Success.pdfHyperautomation and AI/ML: A Strategy for Digital Transformation Success.pdf
Hyperautomation and AI/ML: A Strategy for Digital Transformation Success.pdf
 
Connect Wave/ connectwave Pitch Deck Presentation
Connect Wave/ connectwave Pitch Deck PresentationConnect Wave/ connectwave Pitch Deck Presentation
Connect Wave/ connectwave Pitch Deck Presentation
 
Leverage Zilliz Serverless - Up to 50X Saving for Your Vector Storage Cost
Leverage Zilliz Serverless - Up to 50X Saving for Your Vector Storage CostLeverage Zilliz Serverless - Up to 50X Saving for Your Vector Storage Cost
Leverage Zilliz Serverless - Up to 50X Saving for Your Vector Storage Cost
 
Powerpoint exploring the locations used in television show Time Clash
Powerpoint exploring the locations used in television show Time ClashPowerpoint exploring the locations used in television show Time Clash
Powerpoint exploring the locations used in television show Time Clash
 
"ML in Production",Oleksandr Bagan
"ML in Production",Oleksandr Bagan"ML in Production",Oleksandr Bagan
"ML in Production",Oleksandr Bagan
 
Story boards and shot lists for my a level piece
Story boards and shot lists for my a level pieceStory boards and shot lists for my a level piece
Story boards and shot lists for my a level piece
 
DSPy a system for AI to Write Prompts and Do Fine Tuning
DSPy a system for AI to Write Prompts and Do Fine TuningDSPy a system for AI to Write Prompts and Do Fine Tuning
DSPy a system for AI to Write Prompts and Do Fine Tuning
 
Nell’iperspazio con Rocket: il Framework Web di Rust!
Nell’iperspazio con Rocket: il Framework Web di Rust!Nell’iperspazio con Rocket: il Framework Web di Rust!
Nell’iperspazio con Rocket: il Framework Web di Rust!
 
DevEX - reference for building teams, processes, and platforms
DevEX - reference for building teams, processes, and platformsDevEX - reference for building teams, processes, and platforms
DevEX - reference for building teams, processes, and platforms
 

Lithosphere

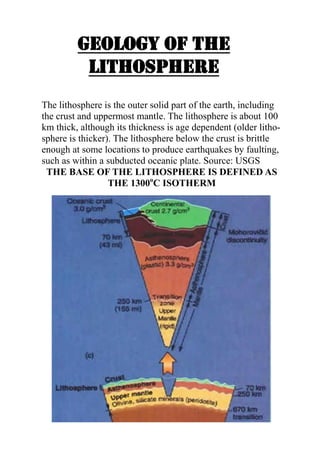
  • 1. Geology of the lithosphere The lithosphere is the outer solid part of the earth, including the crust and uppermost mantle. The lithosphere is about 100 km thick, although its thickness is age dependent (older litho- sphere is thicker). The lithosphere below the crust is brittle enough at some locations to produce earthquakes by faulting, such as within a subducted oceanic plate. Source: USGS THE BASE OF THE LITHOSPHERE IS DEFINED AS THE 1300oC ISOTHERM
  • 2.
  • 3.
  • 4. The Earth loses heat through it’s surface. Volcanoes produce molten rock suggesting internal heat is much hotter than surface heat. Generally the temperature increases depth: 1km deep =30oC above surface temperatures. The rate at which temperature rises (geothermal gradient) varies. In some parts of the crust the temperature rises slowly whilst in other parts it rises rapidly. Steep geothermal gradients are found in areas of igneous activity: magma chambers or cooling batholiths provide heat sources at depth. Since the inside of the earth is hotter than the outside it follows that heat must flow outwards. HEAT FLOW is measured in joules per square metre per second (J m-2 s-1 ). The steeper the geothermal gradient the greater the heat flow. Rocks which are relatively good conductors permit a high heat flow. Heat flow is measured at depths below @ 30m so that solar input does not affect results.
  • 5. Heat flow over the earth There is a general relationship of high heat flow associated with the igneous activity of oceanic ridges and young mountain ranges while lowest values are found in ancient shield areas. Area of Earth’s Surface Heat Flow (J m-2 s-1 ) Whole Earth 0.069 All Oceans 0.069 All Continents 0.069 Ocean Basins 0.053 Oceanic Ridges 0.080 Oceanic Trenches 0.049 Ancient Shield areas 0.041 (older than 570 Ma) Platform areas 0.062 (younger than 570 Ma) Old mountain areas 0.060 (570-225 Ma) Young mountain areas 0.074 (younger than 225 Ma)
  • 6. Average heat flows from continental and oceanic crust are about equal.  Observed heat flow of continental crust could easily be produced by the rocks of the continental crust.  Continental crust appears to have a higher concentration (compared to Oceanic crust) of long-lived radioactive isotopes—the decay of which is the most important source of the earth’s heat.  Oceanic crust could not produce the observed heat flow so it would appear that the heat is comes from the underlying mantle.  This suggests that the mantle under the oceans is hotter than the mantle under the continents.  This suggests that convection currents exist under the oceans but not under the continents.  The currents bring heat from greater depth, they turn and flow under the oceanic giving off heat which escapes through the crust.  The fact that the highest levels of heat flow occur at the ocean ridges an decreases across the ocean basins (lowest values at ocean trenches) suggests that the currents rise under the ridges , flow under the ocean basins and sink under the ocean trenches.
  • 7.
  • 8. Just to jog your memories from last year..
  • 9.
  • 10. Rock strength related to temperature We all know that rocks near the surface of the Earth behave in a brittle manner. Crustal rocks are composed of minerals like quartz and feldspar which have high strength, particularly at low pressure and temperature. As we go deeper in the Earth the strength of these rocks initially in- creases. At a depth of about 15 km we reach a point called the brit- tle-ductile transition zone. Below this point rock strength decreases because fractures become closed and the temperature is higher, making the rocks behave in a ductile manner. At the base of the crust the rock type changes to peridotite which is rich in olivine. Olivine is stronger than the minerals that make up most crustal rocks, so the upper part of the mantle is again strong. But, just as in the crust, increasing temperature eventually predominates and at a depth of about 40 km the brittle-ductile transition zone in the mantle occurs. Below this point http://www.tulane.edu/~sanelson/geol111/deform.htm
  • 11. Diagram 1 Diagram 2 Diagram 3
  • 12. C C Diagram 4 Look at the four diagrams provided: Explain the distinction between the Lithosphere and Asthenosphere (quote from the diagrams) What is the difference in the melting points of wet and dry granite?
  • 13. Read page 142—Webster With the aid of diagrams explain why localised melting in the asthenosphere generates basaltic magmas. Use geological terminology including: Benioff zone. Why could this scenario be classified as idealistic?
  • 14. THE BASE OF THE LITHOSPHERE IS DEFINED AS THE 1300oC ISOTHERM What is meant by the term isotherm? Describe the pattern of lithospheric thickness using the diagram above: How might this relate to the age of the lithosphere?
  • 15. Seismology and the Lithospshere Seismic waves are waves of energy that travel through the earth, for example as a result of an earthquake, explosion, or some other process that imparts low- frequency acoustic energy. The propagation velocity of the waves depends on den- sity and elasticity of the medium. Velocity tends to increase with depth, and ranges from approximately 2 to 8 km/s in the Earth's crust up to 13 km/s in the deep man- tle. Earthquakes create various types of waves with different velocities; when reaching seismic observatories, their different travel time enables the scientists to locate the epicenter. In geophysics the refraction or reflection of seismic waves is used for research of the Earth's interior, and artificial vibrations to investigate subsur- face structures.
  • 16. Read page 119 of McLeish Draw and label diagram 6.8 Add bullet points about the velocities of earthquake waves       
  • 17. Body waves Body waves travel through the interior of the Earth. They follow raypaths refracted by the varying density and modulus (stiffness) of the Earth's interior. The density and modulus, in turn, vary according to temperature and composition. This effect is similar to the refraction of light waves. P-waves P waves (primary waves) are compressional waves that are longitudinal in nature. P waves are pressure waves that are the initial set of waves produced by an earth- quake. These waves can travel through any type of material, and can travel at nearly twice the speed of S waves.: 1450 m/s in water and about 5000 m/s in granite. S-waves S waves (secondary waves) are shear waves that are transverse in nature. These waves typically follows P waves during an earthquake and displaces the ground per- pendicular to the direction of propagation. S waves can travel only through solids, as fluids (liquids and gases) do not support shear stresses. S waves are slower than P waves, and speeds are typically around 60% of that of P waves in any given material. Both waves get slower as the density of the medium increases. P waves get faster as the compressibility decreases. S waves get faster as rigidity increases. (Liquids have a zero rigidity)
  • 18. Read pages 121/122/123 of McLeish: 1. Draw and explain diagram 6.13 2. Draw and explain 6.14 A) Why do the waves bend? B) Why do the waves speed up with depth?
  • 19. 3. What is the Moho? (this is covered in more detail in the next few pages) 4. What is the thickness of oceanic and continental crust? 5. What happens to P and S waves just below the Moho?
  • 20. Using the diagram above describe the relationship between velocity and depth of the seismic P wave:
  • 21. Using the diagrams above describe the relationship between velocity and depth of the seismic S waves, suggest an explanation for this occurrence:
  • 22. How can such data be used to show crustal layering? What can be deduced about the internal structure of the crust? How can such data be used to calculate the thickness of the crust? Why are earthquakes rare occur in the asthenosphere?
  • 23. Extra Reading and research can be found at COCORP and BIRPS: Below is an extract from the COCORP website - The Consortium for Continental Reflection Profiling (COCORP) pioneered the use of multichannel seismic reflection profiling for the systematic exploration of the continental lithosphere. COCORP-type profiles routinely probe to the base of the crust and frequently deeper. COCORP has collected over eleven thou- sand kilometers of profiling at thirty sites in the United States. Among the best known of COCORP's US results are its demonstration of large-scale, low-angle thrust faulting in the Appalachians; confirmation of a thrust origin for Laramide basement uplifts; delineation of the variable character of the continental Moho, including new evidence for its post-orogenic re-equilibration, its multi-genetic origin (including phase changes) and possible role as a structural detachment; magma "bright spots" beneath Cenozoic rifts of the western US; crustal-scale detachment faults in the eastern Basin and Range; mapping of major buried Precambrian layered sequences in interior US; and definition of crustal shear zones marking major Proterzoic sutures of the buried craton. The success of COCORP stimulated major deep seismic explo- ration programs in over twenty countries, including Great Brit- ain (BIRPS), France (ECORS), Germany (DEKORP) and Canada (LITHOPROBE).
  • 24. Using Figures 2a and 2b complete Figure 2c to show the Lithosphere and Astheno- sphere. Looking back at the thickness of the lithosphere how do you think depth of the low velocity zone correlates to the distance from the oceanic ridges?
  • 25. The Mohorovičić discontinuity (Croatian pronunciation: [mɔhɔˈrɔvitʃitɕ]) (MOE-HOE- ROE-vee-cheech), usually referred to as the Moho, is the boundary between the Earth's crust and the mantle. Named after the pioneering Croatian seisomologist Andrija Mohorovičić, the Moho separates both oceanic crust and continental crust from underlying mantle. The Moho mostly lies entirely within the lithosphere; only beneath mid-ocean ridges does it define the lithosphere – asthenosphere boundary. The Mohorovičić discontinuity was first identified in 1909 by Mohorovičić, when he observed that seismograms from shallow-focus earthquakes had two sets of P-waves and S-waves, one that followed a direct path near the Earth's surface and the other refracted by a high velocity medium.[1] The Mohorovičić discontinuity is 5 to 10 kilometres (3–6 mi) below the ocean floor and 20 to 90 kilometres (10–60 mi) beneath typical continents, with an average of 35 kilometres (22 mi) beneath them. Two paths of a P-wave, one direct and one refracted as it crosses the Moho Immediately above the Moho the velocities of primary seismic waves (P-waves) are approximately those of basalt (6.7 – 7.2 km/s), and below they are that of peri- dotitic or dunitic Earth-materials (7.6 – 8.6 km/s).[3] That suggests the Moho marks a change of composition, but the interface appears to be too even for any believable sorting mechanism within the Earth. Near-surface observations suggest such sorting produces an irregular surface. Some history of suggestions that the boundary marks instead a phase change controlled by a temperature gradient in the Earth. (See McLeish page 122/123 for further detail)
  • 26. The Moho is a high velocity medium. Which P wave would travel fastest—the wave that passed through the Moho or the wave that travelled within the overlying crust? From Specimen paper: 3. Describe and explain how a study of earthquake body waves provides evidence for the variation in thickness and mechanical properties of the lithosphere and asthenosphere. [25] Use the text books, classwork and research to plan the answer to the above essay. The mark scheme below should help you. 3. Holistic approach (12+1 marks description) (12+1 marks explanation) Define earthquake body waves. Use of/explanation of formulae for P and S wave velocities. Incompressibility v density changes - P-wave Rigidity v density - S-wave Depth profile of P and S waves to show velocity variation. Depth of the Low velocity zone with distance from spreading centre. Thickening of the lithosphere with age and distance from ridge. Diagrams credited Definition of the difference between Lithosphere and Asthenosphere in terms of mechanical properties. Lithosphere = plate. Cold (<1300o C isotherm) -Brittle thus fractures. Asthenosphere = partially molten (5 %) - Ductile thus flows Total 25 marks You will have 35 minutes to write the response under timed conditions in class. You may on this first occasion use your notes. Poor responses will have to repeat the timed task after college until an accept- able standard is achieved.
  • 27.
  • 28. Oceanic crust is the part of Earth's lithosphere that surfaces in the ocean basins. Oceanic crust is primarily composed of mafic rocks, which is rich in iron and magnesium. It is thinner than continental crust, gener- ally less than 10 kilometers thick, however it is denser, having a mean density of about 3.3 grams per cubic centimeter. Although a complete section of oceanic crust has not yet been drilled, geologists have several pieces of evidence that help them understand the ocean floor. Estimations of composition are based on analyses of ophiolites (sections of oceanic crust that are preserved on the conti- nents), comparisons of the seismic structure of the oceanic crust with laboratory determinations of seismic velocities in known rock types, and samples recovered from the ocean floor by submersibles, dredging (especially from ridge crests and fracture zones) and drilling. Oceanic crust is significantly simpler than continental crust and generally can be divided in three layers. Layer 1 is on an average 0.4 km thick. It consists of unconsolidated or semiconsolidated sediments, usually thin or even not present near the mid-ocean ridges but thickens farther away from the ridge. Near the continental margins sediment is terrigenous, meaning derived from the land, unlike deep sea sediments which are made of tiny shells of marine organisms, usually calcareous and siliceous, or it can be made of volcanic ash and terrigenous sediments transported by turbidity currents. Layer 2 could be divided into two parts: layer 2A – 0.5 km thick upper- most volcanic layer of glassy to finely crystalline basalt usually in the form of pillow basalt, and layer 2B – 1.5 km thick layer composed of dia- base dykes. Layer 3 is formed by slow cooling of magma beneath the surface and consists of coarse grained gabbros and cumulate ultramafic rocks. It constitutes over two-thirds of oceanic crust volume with almost 5 km thickness.
  • 29. Label the Moho in the above diagram. Note the diagrams below show symmetry. You can be asked to complete half a diagram in the exam.
  • 31.
  • 32.
  • 33. 2002
  • 34. Ophiolites Ophiolites are pieces of oceanic plate that have been thrusted (obducted) onto the edge of continental plates. They provide models for processes at mid-ocean ridges. Ophiolites are an assemblage of mafic and ultramafic lavas and hypabyssal rocks found in association with sedimentary rocks like greywackes and cherts. They are found in areas that have complex structure. Cross-sections simplified from R.C. Coleman, 1981, Journal of Geophysical Research, v. 86, p. 2497-2508. Ophiolites have been found in Cyprus, New Guinea, Newfoundland, California, and Oman. The Samail ophiolite in southeastern Oman has probably been studied in the greatest detail. The rocks probably formed in the Cretaceous not far from the what is now the Persian Gulf. The rocks were later thrust (pushed uphill at a low angle) westward onto the Arabian shield. Why do Ophiolites give evidence for the composition of oceanic crust and upper mantle?
  • 35. This is an American diagram in UK we spell: DYKES Ophiolites are characterized by a classic sequence of rocks. This sequence is well exposed at the Samail ophiolite. The base of the sequence is sedimentary rocks of the Arabian shield, not part of the ophiolite, on which the oceanic plate was pushed. From base to top the ophiolite is made of: peridotite, layered gabbro, massive gab- bro, dykes, and volcanic rocks. At Samail this entire sequence is 15 km thick. The basal peridotite is made of a rock called harzburgite (made mostly of the minerals olivine and enstatite). Within the peridotite are many dikes of gabbro and dunite. The peridotite is deformed. The peridotite is overlain by dunite (an intrusive igneous rock made mostly of the mineral olivine) that grades upward to gabbro (an intrusive igneous rock made mostly of plagioclase and clinopyroxene - augite). The sequence is capped by dikes and volcanic rocks (pillow basalts that erupted on the ocean floor). Sequence of rocks simplified from R.C. Coleman (1981). This Oman classic ophiolite complex should be studied carefully. You can be examined on this or a similar sequence.
  • 36. From a tectonic perspective, the peridotite is depleted mantle that was under the magma chamber at the mid-ocean ridge crest. The gabbro layer is related, in some way, to the crystallization of the magma chamber (probably with repeated injections of magma). The dikes and volcanic rocks are formed by magma in transit to or at the surface. Cross-section simplified from Pallister, J.S., and Hopson, C.A., 1981, Journal of Geophysical Research, v. 86, p. 2593-2644. To learn more about gabbro and other igneous rocks review the Geotour Igneous Rocks Module or visit the petrography homepage. To see a classic bit of oceanic crust that has been thrusted up on a continent (an ophiolite ) visit the Oman Virtual Field Trip. Source of Information: McBirney, A.R., 1985, Igneous petrology: Freeman Cooper & Co. Space for your own notes:/research: Where can ophiolites be found in Britain? Why do ophiolites not typically show magnetic anomalies?
  • 37. How can ocean drilling be used to provide evidence for the composition of oceanic crust and upper mantle? Give an example of an ocean core. How might the evidence compare with that of ophiolites?
  • 38.
  • 39. 2004
  • 40. Oceanic What do these two diagrams show? Continental
  • 41. Complete this diagram Extra : Read pages 174/176 McLeish
  • 42. What does the above diagram indicate about the plate movements in the Atlantic and Pacific Oceans? Work out the rate of movement for each ocean. What does the diagram below indicate?
  • 43. What is the relationship between the direction of magnetism and the table above?
  • 44. How can the diagrams above help to provide a frame of reference for calculating the rate of seafloor spreading? How can radiometric dating and ocean drilling be used to date magnetic anomalies?
  • 45. Hot Spots Read page 44/45 of the OCR book Copy the formula to calculate the rates of sea floor spreading. Answer questions 1,2 and 3 from page 45.
  • 46. Oceanic lithosphere consists mainly of mafic crust and ultramafic mantle (peridotite) and is denser than the continental lithosphere, for which the mantle is associated with crust made of silicic rocks. Oceanic lithosphere thickens as it ages and moves away from the mid-ocean ridge. This thickening occurs by conductive cooling, which converts hot asthenosphere into lithospheric mantle, and causes the oceanic lithosphere to become increasingly thick and dense with age. Oceanic lithosphere is less dense than asthenosphere for a few tens of millions of years, but after this becomes increasingly denser than the asthenosphere. The gravitational instability of mature oceanic lithosphere has the effect that, at subduction zones, the oceanic lithosphere invariably sinks underneath the overriding lithosphere, which can be oceanic or continental. New oceanic lithosphere is constantly being produced at mid-ocean ridges and is recycled back to the mantle at subduction zones. As a result, oceanic lithosphere is much younger than continental lithosphere: the oldest oceanic lithosphere is about 170 million years old, while parts of the continental lithosphere are billions of years old. Write a definition for each of the following terms: MAFIC ULTRAMAFIC SILICIC
  • 47.
  • 48. What conclusions can be drawn from the diagram above?
  • 49. Firstly describe the pattern of earthquakes, then try to explain the trend shown. Look back at the previous page.
  • 50.
  • 51. Label a likely location for Ophiolites. Explain why the volcano could produce basalt, andesite or granite.
  • 52. LABEL THE DIRECTION OF PLATE MOVEMENT Explain how an accretionary prism is formed.
  • 53. LEARN THIS DIAGRAM FOR ESSAYS!! Use page 39 of the OCR text book to complete the above diagram. Use notes from page 40 Oceanic—continental convergent plate margin to explain the processes below.
  • 54. Create a mind map for the information on page 40 OCR book: Oceanic –Oceanic convergent plate margin Include the diagram of the cross section.
  • 55. Draw diagram b from page 39 of the OCR text book and write 10 bullet points to explain the process. Make sure you give specific examples throughout.
  • 56. Make notes on the ppt point presentation given in class. Use page 43 of the OCR book to supplement your notes. GL5, Theme 4, Key Idea 2: The J. Tuzo Wilson Cycle – Ocean Basin Evolution Continental rift formation – constructive plate margin
  • 57. Oceanic-continental destructive plate margin e.g. Andes, South America
  • 58. Continental-continental destructive plate margin e.g. India/Tibet and the Alps Age of crust is calculated using radio isotope dating
  • 59. Past examples of ocean formation and closure.  Iapetus ocean, closed causing the Caledonian orogeny (Siliurian to Early Devonian, roughly 440-390Ma)  Tethys ocean closed as India collided with Eurasia forming the Himalayas and Africa collided with Europe forming the Alps (end Cretaceous, early Tertiary) (see movie) GEOLOGY GL5 THEMATIC UNIT 4 GEOLOGY OF THE LITHOSPHERE A.M. MONDAY, 24 June 2002 4. Describe and explain the evidence for ocean basin evolution (formation, growth and destruction) as proposed in the J. Tuzo Wilson cycle. [25]
  • 60. Why does the continental lithosphere resist subduction? What does this suggest about the age of continental crust?
  • 61.
  • 62. What conclusions can be drawn about the distribution of the ages of the rocks in the diagrams above? What do you think an inside out continent would be? (Extra reading :Super continent by Ted Neild
  • 63.
  • 64. Partial Melting and granite magmatism In pairs try to answer Q1 2008 paper. Then write 10 bullet points for your notes
  • 65. ISOSTASY Use Webster page 17 and your own research to explain isostatic uplift and gravitation collapse. Make sure you use diagrams!!
  • 66. Use the internet to research isostasy. Use published lithosphere sections and densities to compare the relative weights and heights of columns of continental and oceanic lithosphere.
  • 67. What is delamination? How might this explain the Tibetan Plateau? What impact could this have on the direction of stress and subsequent faulting in the Tibetan Plateau region?
  • 68. Read 157,158,159 of Webster Use diagrams and bullet points to show how the fold mountains were formed during the closing of the Iapetus Ocean.
  • 69. 4. (a) Describe how fold mountains are formed. (b) Evaluate the importance of isostasy during their formation. [25] 2010 You will write this under timed conditions 35mins. (Remember to include diagrams) You must achieve your target grade or you will have repeat the exercise under timed conditions in your lunchtime. Use the space below to plan your response:
  • 70. What type of faults are above? What is the direction of stress?
  • 71. Use Webster page 100/157/158 to explain the formation of the Moine Thrust. (Note the folding takes place before the faulting.)
  • 72. http://www.see.leeds.ac.uk/structure/faults/stress/ Research and make notes from this website on the direction of stress in faults. Use diagrams!!! Then answer Q1 2004 .
  • 73. 4. (a) Describe how forces acting on continental lithosphere may cause brittle or ductile deformation. (b) Evaluate the importance of the depth in the lithosphere on the types of deformation produced. [25] Research for homework -to be completed under timed conditions. Use the past papers to complete the data response and essay questions you have not yet done. This is good for revision!!! Please see me if you get stuck and use the mark schemes to help you understand what the exam- iners are looking for. (There are one or two essay questions that would not now be in GL5 but in GL4 instead.)