Operations Management, business presentation

100 Operations Management models and diagrams for your powerful business presentations. Content: Powerpoint, presentations, business, slides, diagrams, charts, Transformation Process, In-Output, Macro Operations, Physical Buffering, Operations Strategy, Process Design, Manufactoring, Supply Chain Management, Vertical Integration, Assembly Operations, Capacity Leading Strategy, Product Technology, CAD, Job Design, Capacity Planning, Inventory Management, Economic Order Quantity, Pareto Curve, ABC Analysis, Material Management, Master Production Schedule, Layouting, Production Plan, Just-in-Time, Quality Management, PDCA Cycle, Process Reengineering, Cause Effect Diagram, Pareto Diagram, Why Why Analysis, TQM, Operations Network, Buffer Inventory Download these diagrams on http://www.drawpack.com (try our free membership offer)

Recomendados
Más contenido relacionado
Más de http://www.drawpack.com
Más de http://www.drawpack.com (20)
Último
Último (20)
Operations Management, business presentation
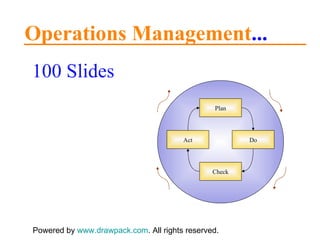
- 1. Operations Management ... 100 Slides Powered by www.drawpack.com . All rights reserved. Check Do Act Plan
- 2. Key Words ... Transformation Process – In-Output – Macro Operations – Physical Buffering – Operations Strategy – Process Design – Manufactoring – Supply Chain Management – Vertical Integration – Assembly Operations – Capacity Leading Strategy – Product Technology – CAD – Job Design – Capacity Planning – Inventory Management – Economic Order Quantity – Pareto Curve – ABC Analysis – Material Management – Master Production Schedule – Layouting – Production Plan – Just-in-Time – Quality Management – PDCA Cycle – Process Reengineering – Cause Effect Diagram – Pareto Diagram – Why Why Analysis – TQM – Operations Network – Buffer Inventory
- 3. Operations Function: Narrow Definition Operations management Marketing Purchasing Accounting and finance Personnel Product/service development Engineering/ technical Extent of the operations function
- 4. Operations Function: Broad Definition Operations management Personnel Marketing Purchasing Accounting and finance Product/service development Engineering/ technical Extent of the operations function
- 5. Input-Transformation-Output Processes Input transformed resources Materials information customers Facilities staff Input transforming resources Input Output Goods and services The transformations process Environment Environment
- 6. Output: A Mixture of Goods and Services Crude oil production Aluminium smelting Specialist machine tool manufacturer Restaurant Computer systems services Management consultancy Psychotherapy clinic Pure Goods Tangible Can be stored Production precedes consumption Low customer contact Can be transported Quality is evident Pure Services Intangible Cannot be stored Production and consumption are simultaneous High customer contact Cannot be transported Quality difficult to judge
- 7. Macro and Micro Operations Set and props manufacture Wood, steel, plastic, etc. Carpenters Machines Scenery and props Marketing and sales Information from customers Computer systems Survey and analysis staff Market forecasts, sales proposales and plans Engineering Broadcasting and programme- making equipment Test and repair equipment Staff Adapted, maintained and repaired equipment
- 8. Micro Operations and Business Processes Customer needs Business processes Customer needs fulfilled Preparing quotations Programme production Promotional and advertising contracts Technical support contracts Music videos Marketing and sales Set and props manufacture Engineering Production units Finance and costing Micro operations Size of each micro operation‘s contribution to each process
- 9. Physical Buffering Not applicable Customer processors e.g. Queues and waiting lists at hospitals e.g. On-line subscriber services of financial data Information processors e.g. Databases in national and local government e.g. Physical inventories of finished goods Material processors e.g. Physical inventories of raw materials and components The operation system Buffer Buffer
- 10. Organizational Buffering The operation function Purchasing Marketing Technical/ engineering Personnel Accounting and finance Product/services development Staff Suppliers Process technology Staff Customers Funds
- 11. A Typology of Operations Low High Volume Low High Volume Low High Volume Low High Volume Low repetition Each staff member performs more of job Less systemization High unit costs Flexible Complex Match customer needs High unit costs Changing capacity Anticipation Flexibility In touch with demand High unit costs Short waiting tolerance Satisfaction governed by customer perception Customer contact skills needed Received variety is high High unit costs Implication High repeatability Specialization Systemization Capital intensive Low unit costs Well defined Routine Regular Low unit costs Stable Routine Predictable High utilization Low unit costs Time lag between production and consumption Standardized Low contact skills High staff utilization Centralization Low unit costs Implication
- 12. Operations Management and Strategy Input transformed resources Materials information customers Facilities staff Input transforming resources Input Output Goods and services Environment Environment Operations strategy The operation‘s competitive role and position The operation‘s strategic objectives Operations strategy Planning and control Design Improvement Operations strategy
- 13. The Three Roles of the Operations Function Operations as effector Being the „implementer“ of strategy Operations must „make strategy happen“ by trans- lating strategic decisions into operational reality Strategy OPS OPS OPS Operations as follower Being „appropriate“ for strategy Operations must support strategy by developing appropriate objectives and policies for the resources it manages Strategy OPS Operations as leader Being the „driver“ of strategy Operations must provide the means to achieve competitive advantage OPS Strategy
- 14. The Role and the Contribution of the Operations Function Stop holding the organisazion back Redefine the industry‘s expectations Be clearly the best in the industry Be as good as competitors Correct the worst problems Give an operations advantage Link strategy with operations Adopt best practise Internally neutral Externally supportive Internally supportive Externally neutral Increasing contribution of operations Stage 1 Stage 4 Stage 3 Stage 2 The ability to implement The ability to drive strategy The ability to be appropriate
- 15. External and Internal Effects on the Performance Objectives Internal effects of the five performance objective High total productivity Reliable operation Fast throughput Ability to change Error-free processes Cost Dependability Flexibility Quality Speed Dependable delivery On-specification products/ services Frequent new product/services Wide product/services range Volume and delivery adjustments Low price high margin, or both Short delivery lead time
- 16. The Influences on the Relative Importance of Performance Objectives The influence of the organization‘s customers What are order-winning, qualifying, and less important factors to them? The influence of the organization‘s competitors How does the operation react to changes in the way competitors behave? The stage of the organization‘s products and services in their life cycle Are products and services at their introduction, growth, maturity or decline stage? The relative importance of each performance objective to the operation
- 17. Different Competitive Factors and Performance Objectives Competitive factors If the customer value these... Low price The ability to change the timing or quantity of products and services High quality Fast delivery Reliable delivery Innovative products and services Wide range of products and services Performance objectives Then, the operation will need to exel at these... Cost Flexibility (volume and/or delivery) Quality Speed Dependability Flexibility (product/service) Flexibility (mix)
- 18. Order-winning and Qualifying Objectives Performance Competitive benefit Order-winnig factors Competitive benefit Performance Competitive benefit Qualifying factors Performance Less important factors
- 19. Competitor Activity and the Influence on Performance Objectives Alternative strategy 2 Order winners Faster delivery Qualifiers Range Price Performance objectives Speed Alternative strategy 1 Order winners Fast delivery Range Qualifiers Price Performance objectives Speed and flexibility Competitor‘s strategy Order winners Fast delivery Range Qualifiers Price Performance objectives Speed and flexibility Alternative strategy 3 Order winners Price Qualifiers Fast delivery Range Performance objectives Cost Original strategy Order winner Fast delivery Qualifiers Range Price Performance objectives Speed
- 20. Effects of the Product/Service Life Cycle Cost Cost Dependability Speed Dependability Quality Flexibility Quality Dominant operations performance objectives Dependable supply Range Quality Prince Range Quality Range Likely qualifiers Low price Low price dependable supply Availability of quality products/ services Product/ service characteristics performance or novelty Likely order winners Possible move to commodity standardization Emerging dominant types Increasingly standardized Possible high customization or frequent design changes Variety of product/service designs Declining number Stable number Increasingly number Few/ none Competitors Laggards Bulk of market Early adoptors Innovators Customers Sales decline Sales slow down and level off Rapid growth in sales volume Slow growth in sales Volume Market needs largely met Markets needs start to be fulfilled Product/ service gains market acceptance Product/ service first introduced to market Decline Maturity Growth Introduction
- 21. Design Activities in Operations Management The design of processes Network design Layout and flow Process technology Job design The general principles of design in operations Concept generation Prototyping and final design Evaluation and improvement Preliminary design Screening The design of products and services
- 22. Design Screening Large number of design options Choice and evaluation screens Time Concept Final design specification Uncertainty regarding the final design Certainty regarding the final design
- 23. Process Types in Manufacturing Operations Project Jobbing Volume Low High Variety Low High Batch Mass Continous
- 24. Process Types in Service Operations Professional services Volume Low High Variety Low High Service shops Mass services
- 25. Line of Fit of Process to Volume/Variety Characteristics Volume Variety Project Mass Batch Jobbing Continuous Service shop Mass service Professional service None None Less process flexibility than is needed so high cost Less process flexibility than is needed so high cost The natural line of process to volume variety characteristics Manufacturing operations process types Service operations process types
- 26. The Customer-Marketing-Design Feedback Loop Marketing Product/service design Operations Customer Expectations Interpretation of expectation Product/ service specification Product/ service
- 27. Stages of Product/Service Design Concept generation Screening Preliminary design Evaluation and improvement Prototyping and final design The package The process The concept
- 28. Concept Generation from Internal and External Sources Concept generation Marketing department Internal sources External sources Market surveys Analysis of customer needs Suggestion from customer contact staff Ideas from research & development Suggestion from customers Actions of competitors
- 30. Concept Screening Many concepts Acceptable concepts Marketing screen Operations screen Financial screen
- 31. Effect of a Delay in Time to Market Cash Time Delay in time to market Delay in financial breakeven Development costs Development costs of delayed project Delayed cash flow Delayed sales revenue Cash flow Sales revenue
- 32. Organization Structures for Design Activity P.M. P.M. P.M. P.M. F.M. F.M. F.M. F.M. F.M. F.M. F.M. F.M. P.M. P.M. P.M. P.M. P.M. P.M. P.M. P.M. F.M. F.M. F.M. F.M. P.M. P.M. P.M. P.M. F.M. F.M. F.M. F.M. P.M. P.M. P.M. P.M. F.M. F.M. F.M. F.M. F.M. = Functional Manager P.M. = Project Manager Pure functional organization Pure project organization Increasing project orientation
- 33. Total and Immediate Supply Networks The Operation Second-tier suppliers First-tier suppliers First-tier customers Second-tier customers The immediate supply network Supply side of the network Demand side of the network The total supply network
- 34. Vertical Integration for an Assembly Operation Raw materials supplier Component maker Assembly operation Wholesaler Retailer Raw materials supplier Component maker Assembly operation Wholesaler Retailer Downstream vertical integration Upstream vertical integration Stages owned by the organization
- 35. The Extent of Process Span of Vertical Integration Raw materials supplier Component maker Assembly operation Wholesaler Retailer Raw materials supplier Component maker Assembly operation Wholesaler Retailer Stages owned by the organization Wide process span Narrow process span
- 36. The Balance of Internal/External Trade Raw materials supplier Component maker Assembly operation Wholesaler Retailer Raw materials supplier Component maker Assembly operation Wholesaler Retailer Stages owned by the organization Vertically integrated stages also sell to/buy from other companies Vertically integrated stages deal only with each other
- 38. Capacity-Leading and Capacity-Lagging Strategies Volume (units/week) Time Capacity leads demand Capacity lags demand Demand
- 39. Relationship Between Process and Basic Layout Types Manufacturing process types Service process types Basic layout types Fixed-position layout Process layout Cell layout Product layout Project processes Jobbing processes Batch processes Mass processes Continous processes Professional services Service shop Mass service
- 40. Volume Variety and Layout Type Fixed-position layout Process layout Volume Low High Variety Low High Cell layout Product layout Regular flow more important Regular flow more feasible Flow is intermittet Flow becomes continuous
- 41. Types of Cell e.g. Specialist process manufacturing cell Internal audit group in a bank e.g. Plant-within-a-plant manufacturing operation Maternity unit in a hospital e.g. Small multi-machine manufacturing cell Joint reference and copying room in a library e.g. Complete component- manufacturing cell Lunch and snack produce area in supermarket Amount of indirect resources included in the cell High Low Proportion of the direct resources needed to complete the transformation included in the cell Low High
- 42. Relative Rates of Innovation for Product and Process Technology High Low Introduction Growth Maturity Rate of innovation Stage of development Unco-ordinated Performance maximizing Product cost minimizing Systemic Process technology Product technology Product technology Process technology
- 43. Volume and Variety Characteristics Volume Low High Variety Low High Stand-alone NC machine tool NC machining centres Flexible manufacturing systems Flexible trans- fer lines Dedicated systems
- 44. Increasing Integration of Manufacturing Technologies Designing Controlling Handling Managing Computer-aided manufacturing (CAM) INTEGRATED INTEGRATED CAD/ CAM FMS CIE CIM The computer-based systems of other functions, suppliers and customers Computer-aided design (CAD) Automated guided vehicles (AGVs) Robotics Loading Scheduling monitoring INTEGRATED INTEGRATED
- 45. The Growth in Telecommunication Services Telegraphie Telegram Telephony TV Telex Radio Colour TV Stereo radio 999 service Private circuit Cable TV Paging Teletext Multimedia Mobile telephony EDI CCTV Satelite services Voice messaging Image transmission Remote computing Voice conference Video conference Star services Alphanumeric paging Mobile telephony Colour fax Telemetry ISDN LinklineDDSN Satelite TV Network services Home shopping Cashless services Video games Home banking Video conference Multimedia database Interactive video Telewriting Smart card comms Personal numbering Videotext Mobile videotext Telenewspaper Intelligent network Translation Artificial reality Virtual reality Hi-Fi telephony Teleworking Mobile videophone ATM Frame relay Speech fax Archiving Centrex SDH X400 Telepresence 1850 1880 1930 1970 1980 1990 2000
- 46. The Elements of Job Design What tasks? Who else? How to interface with the facilities? What sequence? What environmental conditions How much autonomy What skills Where to locate
- 47. The Chronology of the Differente Approaches to Job Design Time Operations job design before 1900 1900 1950 1970 1980 Division of labour Scientific management Ergonomics Behavioural approach Empowerment
- 48. Differente Approaches to Job Design Emphasis on managerial control Emphasis on commitment and engagement of staff Division of labour Scientific management Ergonomics Behavioural approaches Empowerment Self-managed method study Staff treated as a cost Staff treated as a resource
- 50. Capacity Planning and Control Actual demand and actual capacity Outcome How much capacity next period? Decision Actual demand and actual capacity Outcome How much capacity next period? Decision Capacity level Capacity level Capacity level Current capacity estimates Current capacity estimates Updated forecasts Updated forecasts Costs Revenues Working capital Customer satisfaction etc. Costs Revenues Working capital Customer satisfaction etc. Shortages Queues inventory Shortages Queues inventory Periode t-1 Periode t Periode t+1
- 51. Dynamics of Capacity Planning POOR Outlook < 1 NORMAL Outlook = 1 GOOD Outlook > 1 Lay-off staff Short-time Idle time Make for inventory Short time Delay any action Do nothing Hire and make for inventory Start to recruit Overtime Hire temporary staff Overtime Hire temporary staff Hire staff POOR Outlook < 1 NORMAL Outlook = 1 GOOD Outlook > 1 Long-term outlook Outlook = Forecast demand / Forecast capacity Short-term outlook
- 52. The Position of Inventory I Suppliers Stock Sales operations e.g Local retail store (a) single-stage inventory system
- 53. The Position of Inventory II Suppliers Central depot Distribution e.g. Automotive parts distributor (b) Two-stage inventory system Local dis- tribution point Sales operations
- 54. The Position of Inventory III Suppliers Input stocks Stage 1 e.g. Television manufacturer (c) Multi-stage inventory system WIP Stage 2 WIP Stage 3 Finished goods stock
- 55. The Position of Inventory IV (d) Multi-echelon inventory system Yarn producers Cloth producers Garment producers Regional warehouses Retail stores
- 56. Inventory Profile Order quantity Q Time Inventory level Steady and predictable demand (D) Slope = demand rate Average inventory = Q / 2 Instantaneous deliveries at rate of D / Q per period Q / D
- 57. Economic Order Quantity Costs Order quantity Order costs Economic order quantity (EOQ) Total costs Holding costs
- 58. Pareto Curve for Items in a Warehouse Cumulative % of total value % of total number of items Class C items Class A items Class B items
- 59. Supply Chain Management The Operation Second-tier suppliers First-tier suppliers First-tier customers Second-tier customers Supply side Demand side Purchasing and supply management Physical distribution management Logistics Materials management Supply chain management
- 60. The Purchasing Function Suppliers The internal operation Purchasing function Suppliers Prepare quotations Prepare request for quotations Request for products and services Select the preferred supplier Prepare purchase order Produce goods/ services Receive goods/ services Quotations Discuss with the operations Laise with operations Order Inform purchasing function Delivery goods/ services Input to the operation
- 61. The Multi-Echelon Physical System I Garment manufacturer Regional warehouses Retail stores Process Inventory
- 62. Multi-Echelon Physical System II Customer Customer Customer Customer Customer Customer Factory Factory Factory 6 contracts 3 contracts 18 routes
- 63. Multi-Echelon Physical System III Customer Customer Customer Customer Customer Customer Factory Factory Factory 3 contracts 1 contracts 12 routes Warehouse Warehouse
- 64. Responsibilities of Supplier and Purchaser Purchaser‘s responsibility Supplier‘s responsibility Ex-works Free alongside (FAS) Free on board (FOB) Cost and freight (C & F) Cost, insurance & freight (CIF) Delivered Supplier Purchaser
- 65. Materials Management Cash out Inventory management Purchasing Materials processing Sub- assembly Assembly Physical distribution Cash in Inventory management Inventory management Inventory management Suppliers Customers Materials service flow Information flow Raw materials inventory In- process inventory Finished goods inventory Materials Management
- 66. Material Requirement Planning Customer orders Bills of materials Purchase orders Forecast demand Inventory records Works orders Master productions schedule Materials plans Materials requirements planning
- 67. Inputs into the Master Production Schedule Forecast demand Sister plant demand R&D demand Key capacity constraints Inventory level Spares demand Known orders Exhibition/ promotion requirements Master production schedule Safety stock requirements
- 68. Different Shapes of Product Structure A-shape product structure T-shape product structure V-shape product structure Hourglass or X-shape product structure
- 69. Closed-Loop MRP Production plan Master production plan Materials plan Resource requirements plan Rough-cut capacity plan Capacity requirements plan Realistic? Realistic? Realistic? Materials plan Capacity plan
- 70. Traditional Flow (a) Traditional approach – buffer separate stages Stage A Stage B Buffer In- ventory Buffer In- ventory Stage C
- 71. Just-in-time (JIT) Flow (b) JIT approach – deliveries are made on request Stage A Stage B Stage C Orders Orders Deliveries Deliveries
- 72. A Typology of Projects Complexity Low High Low High Uncertainty Individual Group Organization Multiorganization Nation Multi-nation
- 73. The Process of Project Planning Identify activities Estimate times and resources Identify relationships and dependencies Identify schedule constraints Fix the schedule Optimize
- 74. Effect of Higher Quality on Revenue and Cost Quality up Complaint and warranty costs down Inventory down Rework and scrap costs down Inspection and test costs down Processing time down Capital cost down Productivity up Scales economies up Sales volume up Operation costs down Revenue up Price competition down Service cost down Image up Profits up
- 75. The Customer‘s Views of Quality Customer‘s expectations concerning a product or service Customer‘s perception‘s concerning the product or service Gap Expectation > perceptions Perceived quality is poor Customer‘s expectations concerning a product or service Customer‘s perception‘s concerning the product or service Gap Expectation < perceptions Perceived quality is good Customer‘s expectations concerning a product or service Customer‘s perception‘s concerning the product or service Gap Expectation = perceptions Perceived quality is acceptable
- 76. Gap Analysis Between Customers‘ Perception and Expectation The customer‘s domain The operation‘s domain Previous experiences Word-of-mouth communications Image of product or service Management‘s concept of the product or service Organization‘s specification of quality Customer‘s own specification of quality Customer‘s expectations concerning a product or service Customer‘s perception‘s concerning the product or service The actual product or service Is there a gap? Gap 1 Gap 2 Gap 3 Gap 4
- 77. Change in Customers‘ Needs and the Operation‘s Performance over Time Speed Dependability Speed Cost Quality Flexibility Cost Dependability Quality Flexibility Time Performance of the market Performance of the operation
- 78. The Importance-Performance Matrix Urgent action Improve Appropriate Excess Lower bound of acceptability Bad Good Performance against competitors Better than Same as Worse than Low High Importance for customer Less important Qualifying Order winning
- 79. Breakthrough Improvement Performance Time Intended „breakthrough“ improvements Actual improvement pattern
- 80. The PDCA Cycle Performance Time Path of continous improvement Check Do Act Plan
- 81. The Business Process Re-engineering Approach Function 1 Function 2 Function 3 Function 4 Micro operations Customer needs fulfilled Business processes Customer needs Business processes Customer needs fulfilled Customer needs Micro operations Activity 1 Activity 2 Activity 3 Activity 4
- 82. Flow Chart for Customer Query Customer phones in with query Telefonist understands query Put trough to relevant engineer Answer query over phone Needs an engineer visit Arrange for engineer to visit Customer satisfied Engineer reports back to manager Important Query/ customer Request central engineer support Put trough to manager Manager understands query Yes Yes Yes Yes No Yes No No No No No
- 83. Cause-Effect Diagram Frequency Causes of unscheduled return Wrong prediction Wrong information Unrecorded modifications Wrong issue Out of stock Wrong equipment Other reasons
- 84. Pareto Diagram Time (seconds) Services performed Marketing photocopies Telefax services Carrying phone messages to meeting rooms Providing glasses for night drinks Providing extra linen Providing extra keys Providing extra stationery Locking and unlocking meeting rooms Providing ashtrays Providing night drinks Providing medication
- 85. Why-Why Analysis Not in budget No time available High turnover Product spec. document- ation complicated Many new products No analysis of failures No knowledge of system modifications No customer records available to engineers No analysis of failures Lack of training Lack of product knowledge Lack of customer knowledge Cause of failure wrongly predicted Why? Why? Why? Why? Problem
- 86. Failure Prevention and Recovery Failure detection and analysis Finding out what is going wrong and why Improving system reliability Stopping things going wrong Recovery Coping when things do go wrong
- 87. View of Maintenance Costs I Costs Amount of preventive maintenance Optimum level of preventive maintenance Cost of breakdowns Total cost Cost of providing preventive maintenance
- 88. View of Maintenance Costs II Costs Amount of preventive maintenance Cost of breakdowns Total cost Cost of providing preventive maintenance
- 89. Failure Curves for Two Machines Probability of failure Time x y Machine A Machine B
- 90. The Stages in Failure Planning Discover Act Learn Plan The fact – What? Possible consequences – Who? Inform – Tell Contain – Stopp Follow up - Check Find – The root cause? Prevention – Engineer out Failure analysis – Possibilities Recovery planning - Procedures
- 92. The Cost of Errors in Different Development Stages Costs to rectify error Stage in development and launch process Concept Design Prototype Pilot production Market use
- 93. The TQM Quality Cost Model Costs of quality Time Prevention Appraisal Internal failure External failure Total cost of quality
- 94. Group-based Improvement Improvement task selection Membership of group Management direction Urgent of improvement task Established by management Assigned by management Total High Group Voluntary Little/ None Low Quality circle Quality improvement team Task force
- 95. The Effectiveness of the TQM Initiative Effectiveness of the TQM initiative Time Introduction Disillusionment Leveling off Growth Repackaging Learning and understanding Increasing enthusiasm Starting to hit the more difficult problems Waning enthusiasm Attempts to revitalize the programme
- 96. The European Quality Award Model Processes 14 % Business results 15 % People management 9 % Policy and strategy 8 % Resources 9 % People satisfaction 9 % Customer satisfaction 20 % Impact on society 6 % Leadership 10 % Enablers 50 % Results 50 %
- 98. International Operations Network Configurations 1. Home country operations 2. Regional operations 4. Combined regional and global co-ordinated operations 3. Global co-ordinated operations
- 99. The Performance Objective Trade-Off Performance objective 1 Performance objective 2 In the short term one performance objective can be traded off with another Performance objective 1 Performance objective 2 So one aspect of performance can be improved at the expense of others
- 101. Trend-, Seasonality and Random Variation Analysis Demand Time Demand Time Demand Time
- 102. The Standard Time Approach Relaxtion Working Light job Relaxtion Working Medium job Relaxtion Working Heavy job One standard minute or hour of work
- 103. Drawpack Diagrams Drawpack.com offers premium Business Diagrams for students and professionals around the globe for their personal use. Please enjoy these Business Diagrams. You can send these slides to your personal contacts who might be interested in Business Diagrams. For further information about our service please contact us: [email_address] Please find our membership offer on www.drawpack.com
- 104. Usage rights 1. Drawpack.com allows the customer an unlimited but not exclusive right to use the provided services, products and diagrams. 2. The services, products and diagrams that the customer has received can be copied, edited, saved and used by the customer for their personal and commercial use. 3. The customer is prohibited from providing the service, products and diagrams on professional download levels in the area of audio, video and software transmission. This includes providing the services, products and diagrams via download against payment or free of charge. The customer is prohibited providing the services, products and diagrams on internet servers or on websites with public access. 4. The customer is prohibited providing identical or similar services to those provided on www.drawpack.com with the services, products and diagrams. 5. Any infringements against the above usage rights will lead to legal action. All rights are reserved to www.drawpack.com
Notas del editor
- Source: Operations Management; Slack, Chambers, Harland, Harrison, Johnston, 1998
- Source: Operations Management; Slack, Chambers, Harland, Harrison, Johnston, 1998
- Source: Operations Management; Slack, Chambers, Harland, Harrison, Johnston, 1998
- Source: Operations Management; Slack, Chambers, Harland, Harrison, Johnston, 1998
- Source: Operations Management; Slack, Chambers, Harland, Harrison, Johnston, 1998
- Source: Operations Management; Slack, Chambers, Harland, Harrison, Johnston, 1998
- Source: Operations Management; Slack, Chambers, Harland, Harrison, Johnston, 1998
- Source: Operations Management; Slack, Chambers, Harland, Harrison, Johnston, 1998
- Source: Operations Management; Slack, Chambers, Harland, Harrison, Johnston, 1998
- Source: Operations Management; Slack, Chambers, Harland, Harrison, Johnston, 1998
- Source: Operations Management; Slack, Chambers, Harland, Harrison, Johnston, 1998
- Source: Operations Management; Slack, Chambers, Harland, Harrison, Johnston, 1998
- Source: Operations Management; Slack, Chambers, Harland, Harrison, Johnston, 1998
- Source: Operations Management; Slack, Chambers, Harland, Harrison, Johnston, 1998
- Source: Operations Management; Slack, Chambers, Harland, Harrison, Johnston, 1998
- Source: Operations Management; Slack, Chambers, Harland, Harrison, Johnston, 1998
- Source: Operations Management; Slack, Chambers, Harland, Harrison, Johnston, 1998
- Source: Operations Management; Slack, Chambers, Harland, Harrison, Johnston, 1998
- Source: Operations Management; Slack, Chambers, Harland, Harrison, Johnston, 1998
- Source: Operations Management; Slack, Chambers, Harland, Harrison, Johnston, 1998
- Source: Operations Management; Slack, Chambers, Harland, Harrison, Johnston, 1998
- Source: Operations Management; Slack, Chambers, Harland, Harrison, Johnston, 1998
- Source: Harvard University; Hayes/Wheelwright, 1998
- Source: Operations Management; Slack, Chambers, Harland, Harrison, Johnston, 1998
- Source: Operations Management; Slack, Chambers, Harland, Harrison, Johnston, 1998
- Source: Operations Management; Slack, Chambers, Harland, Harrison, Johnston, 1998
- Source: Operations Management; Slack, Chambers, Harland, Harrison, Johnston, 1998
- Source: Operations Management; Slack, Chambers, Harland, Harrison, Johnston, 1998
- Source: Operations Management; Slack, Chambers, Harland, Harrison, Johnston, 1998
- Source: Operations Management; Slack, Chambers, Harland, Harrison, Johnston, 1998
- Source: Operations Management; Slack, Chambers, Harland, Harrison, Johnston, 1998
- Source: Operations Management; Slack, Chambers, Harland, Harrison, Johnston, 1998
- Source: Operations Management; Slack, Chambers, Harland, Harrison, Johnston, 1998
- Source: Operations Management; Slack, Chambers, Harland, Harrison, Johnston, 1998
- Source: Operations Management; Slack, Chambers, Harland, Harrison, Johnston, 1998
- Source: Operations Management; Slack, Chambers, Harland, Harrison, Johnston, 1998
- Source: Operations Management; Slack, Chambers, Harland, Harrison, Johnston, 1998
- Source: Operations Management; Slack, Chambers, Harland, Harrison, Johnston, 1998
- Source: Operations Management; Slack, Chambers, Harland, Harrison, Johnston, 1998
- Source: A Dynamic Model of Process and Product Innovation; Abernathy/Utterback, 1975
- Source: Operations Management; Slack, Chambers, Harland, Harrison, Johnston, 1998
- Source: Operations Management; Slack, Chambers, Harland, Harrison, Johnston, 1998
- Source: Operations Management; Slack, Chambers, Harland, Harrison, Johnston, 1998
- Source: Operations Management; Slack, Chambers, Harland, Harrison, Johnston, 1998
- Source: Operations Management; Slack, Chambers, Harland, Harrison, Johnston, 1998
- Source: Operations Management; Slack, Chambers, Harland, Harrison, Johnston, 1998
- Source: Operations Management; Slack, Chambers, Harland, Harrison, Johnston, 1998
- Source: Operations Management; Slack, Chambers, Harland, Harrison, Johnston, 1998
- Source: Operations Management; Slack, Chambers, Harland, Harrison, Johnston, 1998
- Source: Operations Management; Slack, Chambers, Harland, Harrison, Johnston, 1998
- Source: Operations Management; Slack, Chambers, Harland, Harrison, Johnston, 1998
- Source: Operations Management; Slack, Chambers, Harland, Harrison, Johnston, 1998
- Source: Operations Management; Slack, Chambers, Harland, Harrison, Johnston, 1998
- Source: Marketing Management, Kotler, 1994
- Source: Marketing Management, Kotler, 1994
- Source: Marketing Management, Kotler, 1994
- Source: Marketing Management, Kotler, 1994
- Source: Marketing Management, Kotler, 1994
- Source: Marketing Management, Kotler, 1994
- Source: Operations Management; Slack, Chambers, Harland, Harrison, Johnston, 1998
- Source: Operations Management; Slack, Chambers, Harland, Harrison, Johnston, 1998
- Source: Marketing Management, Kotler, 1994
- Source: Marketing Management, Kotler, 1994
- Source: Marketing Management, Kotler, 1994
- Source: Marketing Management, Kotler, 1994
- Source: Marketing Management, Kotler, 1994
- Source: Marketing Management, Kotler, 1994
- Source: Marketing Management, Kotler, 1994
- Source: Operations Management; Slack, Chambers, Harland, Harrison, Johnston, 1998
- Source: Managing Business and Engineering Projects; Nicholas, 1990
- Source: Marketing Management, Kotler, 1994
- Source: Service Productivity, Service Quality and Profitability; Gummesson, 1993
- Source: Marketing Management, Kotler, 1994
- Source: A Conceptual Model of Service Quality and Implications for Future Research, Parasuraman, 1985
- Source: Marketing Management, Kotler, 1994
- Source: Marketing Management, Kotler, 1994
- Source: Marketing Management, Kotler, 1994
- Source: Marketing Management, Kotler, 1994
- Source: Marketing Management, Kotler, 1994
- Source: Marketing Management, Kotler, 1994
- Source: Marketing Management, Kotler, 1994
- Source: Marketing Management, Kotler, 1994
- Source: Marketing Management, Kotler, 1994
- Source: Marketing Management, Kotler, 1994
- Source: Marketing Management, Kotler, 1994
- Source: Operations Management; Slack, Chambers, Harland, Harrison, Johnston, 1998
- Source: Operations Management; Slack, Chambers, Harland, Harrison, Johnston, 1998
- Source: Marketing Management, Kotler, 1994
- Source: Marketing Management, Kotler, 1994
- Source: Marketing Management, Kotler, 1994
- Source: Marketing Management, Kotler, 1994
- Source: Marketing Management, Kotler, 1994
- Source: Marketing Management, Kotler, 1994
- Source: Marketing Management, Kotler, 1994
- Source: Towards a Unified Theory of Manufactoring Management; Sweeney, 1991
- Source: Marketing Management, Kotler, 1994
- Source: Marketing Management, Kotler, 1994
- Source: Marketing Management, Kotler, 1994
- Source: Marketing Management, Kotler, 1994
- Source: Marketing Management, Kotler, 1994
- Source: Marketing Management, Kotler, 1994
- Source: Marketing Management, Kotler, 1994