Andy Tourin\'s Market Condition Report For Housing May, 2009
1. May-09
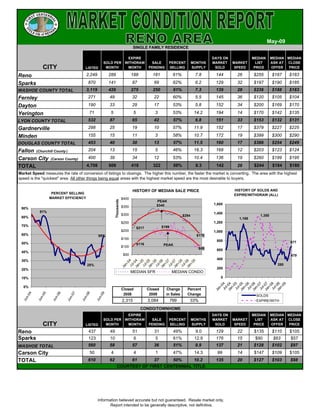
SINGLE FAMILY RESIDENCE
EXPIRE DAYS ON MEDIAN MEDIAN MEDIAN
SOLD PER WITHDRAW SALE PERCENT MONTHS MARKET MARKET LIST ASK AT CLOSE
CITY LISTED MONTH MONTH PENDING SELLING SUPPLY SOLD SPEED PRICE OFFER PRICE
Reno 2,249 289 188 181 61% 7.8 144 26 $255 $187 $183
Sparks 870 141 87 69 62% 6.2 129 32 $197 $190 $185
WASHOE COUNTY TOTAL 3,119 429 275 250 61% 7.3 139 28 $236 $188 $183
Fernley 271 49 32 22 60% 5.5 145 36 $120 $105 $104
Dayton 190 33 29 17 53% 5.8 152 34 $200 $169 $170
Yerington 71 5 5 3 53% 14.2 194 14 $170 $142 $135
LYON COUNTY TOTAL 532 87 65 42 57% 6.8 151 33 $153 $132 $131
Gardnerville 298 25 19 10 57% 11.9 152 17 $379 $227 $225
Minden 155 15 11 3 58% 10.7 172 19 $399 $300 $290
DOUGLAS COUNTY TOTAL 453 40 30 13 57% 11.5 160 17 $386 $254 $249
Fallon (Churchill County ) 204 13 15 5 46% 16.3 168 12 $203 $123 $124
Carson City (Carson County) 400 39 34 12 53% 10.4 136 19 $260 $199 $195
TOTAL 4,708 606 418 322 59% 8.3 142 26 $244 $184 $180
Market Speed measures the rate of conversion of listings to closings. The higher this number, the faster the market is converting. The area with the highest
speed is the "quickest" area. All other things being equal, areas with the highest market speed are the most desirable to buyers.
HISTORY OF MEDIAN SALE PRICE HISTORY OF SOLDS AND
PERCENT SELLING EXPIRE/WITHDRAW (ALL)
MARKET EFFICIENCY $400
Thousands
PEAK
$340 1,600
90% $350
81% 1,400
$300 $294 1,350
80% 1,168
$250 1,200
70% $199
$217
$200 1,000
60% 59% $170
$150
800 677
50% $116 PEAK
$100 $89 600
40%
$50 479
30% 400
25% 280
20% 200
MEDIAN SFR MEDIAN CONDO
10% 0
04 04 05 05 06 06 07 07 08 08 09
0% n- ul- n- ul- n- ul- n- ul- n- ul- n-
Closed Closed Change Percent Ja J Ja J Ja J Ja J Ja J Ja
4
5
6
7
8
9
2008 2009 in Sales Change
0
0
0
0
0
0
SOLDS
n-
n-
n-
n-
n-
n-
Ju
Ju
Ju
Ju
Ju
Ju
2,315 3,084 769 33% EXPIRE/WITH
CONDO/TOWNHOME
EXPIRE DAYS ON MEDIAN MEDIAN MEDIAN
SOLD PER WITHDRAW SALE PERCENT MONTHS MARKET MARKET LIST ASK AT CLOSE
CITY LISTED MONTH MONTH PENDING SELLING SUPPLY SOLD SPEED PRICE OFFER PRICE
Reno 437 49 51 31 49% 9.0 129 22 $135 $110 $105
Sparks 123 10 6 5 61% 12.9 176 15 $90 $63 $57
WASHOE TOTAL 560 58 57 36 51% 9.9 137 21 $128 $102 $97
Carson City 50 4 4 1 47% 14.3 99 14 $147 $109 $105
TOTAL 610 62 61 37 50% 10.2 135 20 $127 $103 $98
COURTESY OF FIRST CENTENNIAL TITLE
Information believed accurate but not guaranteed. Resale market only.
Report intended to be generally descriptive, not definitive.
2. MARKET CONDITION REPORT
May 2009
Welcome to the Reno-Sparks Market Condition Report (MCR) sponsored by First Centennial Title.
We appreciate and value your business.
These comments are designed to accompany the attached Market Condition Report.
THE BIG PICTURE
SUPPLY (LISTED): Supply for both types (Listed) holding very steady in the current range for the last
four months. This implies that as the market resolves current listings, they are being replaced with about the
same level of new activity. Slight negative propensity for both types.
DEMAND (SOLDS PER MONTH): Continuing moderate increases for both types over May. These types
of incremental increases seem very predictable at about 8-10% per month. Reno demand is somewhat lower
when compared to other surveyed markets. This is most likely due to relatively low counts of REO and
Short Sale properties that dominate competing markets. Interesting is the current count of Clark County
REO which is about 10 times that of Washoe County, while the population of Clark County is only about 5
times that of Washoe.
FAILURES: Both types showing a marginal reduction in the number of failures. Note the “failure” line (in
the graph provided) has fallen below the closing line (success) for the first time since mid 2005.
SALE PENDING (FUTURE CLOSINGS): SFR and Condo pending inventories up moderately implying
that future closing activity will increase but the gains will be steady and moderate.
PERCENT SELLING: Picking up nicely for both types. It is now clearly evident a property is more like
to close than fail (on average).
MONTHS SUPPLY: Continuing to decline (market tightening) over May. Current level of Months Supply
is still relatively high, especially for Condo. This usually points to a continuation of price weakness.
MARKET SPEED: Moved up from May by 2 points for both types. The pace of the Reno area market is
still increasing, but at a slow rate. The best performing Reno submarket remains Fernley, returning a
Market Speed of 36.
PRICES: Price indicators are erratic (especially list price) but signs of stabilization have now shifted to the
negative as was predicted. Expect this trend to continue as it is doing in most submarkets in CA, NV and
AZ.
MCR TIP
Initial list price is an educated guess on the part of the seller and agent. If the market does not react to the price
offering in a reasonable time (showings), change it. Dawdling about price reductions in a declining market
increases the probability of failure, costs the motivated seller equity, and reduces the probability of a
commission check for you.