Calibrating 3D seismic modeling to postsurvey results
•
0 likes•483 views

Overview of the merits of different seismic modeling packages for pre-survey planning and parameterization.

Recommended
Recommended
More Related Content
What's hot
What's hot (20)
Similar to Calibrating 3D seismic modeling to postsurvey results
Similar to Calibrating 3D seismic modeling to postsurvey results (20)
Recently uploaded
Recently uploaded (20)
Calibrating 3D seismic modeling to postsurvey results
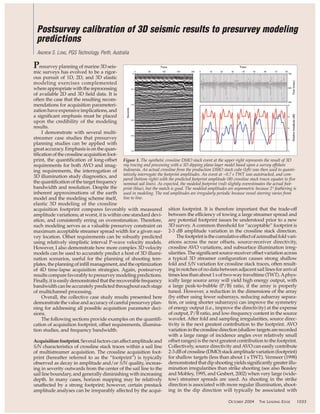
- 1. Postsurvey calibration of 3D seismic results to presurvey modeling predictions ANDREW S. LONG, PGS Technology, Perth, Australia P resurvey planning of marine 3D seis- mic surveys has evolved to be a rigor- ous pursuit of 1D, 2D, and 3D elastic modeling exercises complemented where appropriate with the reprocessing of available 2D and 3D field data. It is often the case that the resulting recom- mendations for acquisition parameteri- zation have expensive implications, and a significant emphasis must be placed upon the credibility of the modeling results. I demonstrate with several multi- streamer case studies that presurvey planning studies can be applied with great accuracy. Emphasis is on the quan- tification of the crossline acquisition foot- print, the quantification of long-offset Figure 1. The synthetic crossline DMO stack event at the upper right represents the result of 3D requirements for both AVO and imag- ray tracing and processing with a 3D dipping plane-layer model based upon a survey offshore ing requirements, the interrogation of Indonesia. An actual crossline from the production DMO stack cube (left) was then used to quanti- 3D illumination study diagnostics, and tatively interrogate the footprint amplitudes. An event at ~0.7 s TWT was autotracked, and com- pared (bottom right) with the predicted footprint amplitude (80 crossline stack traces equates to five the quantification of the target frequency nominal sail lines). As expected, the modeled footprint (red) slightly overestimates the actual foot- bandwidth and resolution. Despite the print (blue), but the match is good. The modeled amplitudes are asymmetric because 2° feathering is inherent approximations of the earth used in modeling. The real amplitudes are irregularly periodic because vessel steering varies from model and the modeling scheme itself, line to line. elastic 3D modeling of the crossline acquisition footprint compares favorably with measured sition footprint. It is therefore important that the trade-off amplitude variations; at worst, it is within one standard devi- between the efficiency of towing a large streamer spread and ation, and consistently erring on overestimation. Therefore, any potential footprint issues be understood prior to a new such modeling serves as a valuable presurvey constraint on 3D survey. A common threshold for “acceptable” footprint is maximum acceptable streamer spread width for a given sur- 2-3 dB amplitude variation in the crossline stack direction. vey location. Offset requirements can be robustly predicted The footprint is the cumulative effect of azimuthal fold vari- using relatively simplistic interval P-wave velocity models. ations across the near offsets, source-receiver directivity, However, I also demonstrate how more complex 3D velocity crossline AVO variations, and subsurface illumination irreg- models can be used to accurately predict a host of 3D illumi- ularities. The significant source-receiver offset variation across nation scenarios, useful for the planning of shooting tem- a typical 3D streamer configuration causes strong shallow plates, the planning of infill management, and the optimization fold and S/N variation for crossline stack traces, often result- of 4D time-lapse acquisition strategies. Again, postsurvey ing in notches of no data between adjacent sail lines for arrival results compare favorably to presurvey modeling predictions. times less than about 1 s of two-way traveltime (TWT). Aphys- Finally, it is easily demonstrated that the recoverable frequency ically large source array will yield high energy output, with bandwidth can be accurately predicted throughout each stage a large peak-to-bubble (P/B) ratio, if the array is properly of multichannel processing. tuned. However, a reduction in the dimensions of the array Overall, the collective case study results presented here (by either using fewer subarrays, reducing subarray separa- demonstrate the value and accuracy of careful presurvey plan- tion, or using shorter subarrays) can improve the symmetry ning for addressing all possible acquisition parameter deci- of energy output (i.e., improve the directivity) at the expense sions. of output, P/B ratio, and low-frequency content in the source The following sections provide examples on the quantifi- wavelet. After fold and sampling irregularities, source direc- cation of acquisition footprint, offset requirements, illumina- tivity is the next greatest contribution to the footprint. AVO tion studies, and frequency bandwidth. variation in the crossline direction (shallow targets are recorded with a large range of incidence angles over relatively small Acquisition footprint. Several factors can affect amplitude and offset ranges) is the next greatest contribution to the footprint. S/N characteristics of crossline stack traces within a sail line Collectively, source directivity and AVO can easily contribute of multistreamer acquisition. The crossline acquisition foot- 2-3 dB of crossline (DMO) stack amplitude variation (footprint) print (hereafter referred to as the “footprint”) is typically for shallow targets (less than about 1 s TWT). Vermeer (1998) observed as decay in amplitude and/or S/N quality, increas- demonstrated that dip shooting yields significantly greater illu- ing in severity outwards from the center of the sail line to the mination irregularities than strike shooting (see also Beasley sail line boundary, and generally diminishing with increasing and Mobley, 1995, and Gesbert, 2002) when very large (wide- depth. In many cases, horizon mapping may be relatively tow) streamer spreads are used. As shooting in the strike unaffected by a strong footprint; however, certain prestack direction is associated with more regular illumination, shoot- amplitude analyses can be irreparably affected by the acqui- ing in the dip direction will typically be associated with OCTOBER 2004 THE LEADING EDGE 1033
- 2. increased DMO instability and footprint problems (Long et al., 2004). In all cases, the footprint is exaggerated by decreas- ing depth, increasing target dip, increased source array directivity, increased AVO behavior at the target interface, and increased streamer spread width. Prestack time migration (PSTM) processing will typically generate fewer footprint effects than DMO processing. As part of a standard presurvey planning exercise in offshore Indonesia, several elastic 3D dipping plane-layer models were built to represent all the Figure 2. Simple example of 2D ray tracing to investigate incidence angle versus offset require- dominant target structural styles ments for the deepest interface in the model (left). To provide an incidence angle of at least 30° everywhere along the line, a streamer length of between 1.3 and 3.8 km is required. Obviously, at encountered throughout the 3D survey least 3.8 km would be recommended. area (several thousand km2). Particular effort was given to estimating VP/VS and VP versus density relationships based upon the analysis of AVO behavior on existing 2D CMP gathers in the survey area. Crossline DMO stacks were gen- erated for discrete, individual interfaces. Spherical divergence, attenuation, reflec- tion/transmission losses (AVO), and source-receiver directivity effects were incorporated into a 3D ray tracing scheme. Full DMO stack processing was then applied to the results so that full- fold 3D crossline DMO stacks were gen- erated for a swath of several adjacent sail Figure 3. Interrogation of 3D illumination results within a real 3D seismic data volume demon- strates the intimate link between modeled target coverage and reduced data reflectivity. Blue-to- lines. As a consequence of the analysis purple indicate high fold and green-to-yellow indicate low fold. (Modified from Hoffmann et al., of several 3D shooting and target sce- 2002). narios, the recommended streamer spread was 8 4050 m streamers, 100- of simplified template or 1D modeling to quickly estimate the m streamer separation, and 18.75 m dual-source shooting. basic offset requirements for each target depth. In contrast, the Once production 3D processing was completed, several use of 2D or 3D ray tracing provides a powerful ability to incor- target events were autotracked on representative crossline porate lateral structural, and velocity variations into analy- DMO stacks, and the amplitudes were extracted. The follow- ses. Note that because of its inherent high-frequency ing observations were made (Figure 1): assumptions (i.e., velocities are smoothly-varying), ray trac- ing cannot be used for detailed analyses of elastic amplitude • The footprint diminishes rapidly with increasing depth, issues. However, kinematic (geometry) analyses are quite and has an “acceptable” variation of less than 2-3 dB for robust for relatively simple models, and only require P-wave arrival times greater than ~1.5 s TWT—as predicted by velocity parameters (such as those extracted from available the original modeling. processing rms functions). • Shallow footprint at ~ 0.7 s TWT was 3-6 dB, as opposed Figure 2 shows an example of how a 2D model built from to the modeled 4-8 dB (for a range of modeling parame- (offshore) interpreted horizons and inverted (rms versus TWT ters). This validates the “worst case scenario” taken dur- to interval versus depth) velocity functions can establish AVO ing presurvey planning, where the shallowest and steepest offset requirements for a particular target interface. Likewise, possible dips are modeled. the analyses of kinematic ray tracing results can be used to • Within a standard deviation of the measured amplitude estimate parameters such as migration aperture and record variations, the modeled and real results were shown to length. In the case of Figure 2, a reasonable knowledge of the compare favorably, despite the inherent approximations earth model was available for presurvey planning, and the during modeling related to generalization of the earth modeling results for incidence angle versus TWT behavior model and modeling of the AVO behavior for the target were unsurprisingly validated during production processing. interfaces. However, it is quite commonly the case that 3D seismic acqui- sition is planned for virgin territory where little is known In conclusion, the rigorous attention given to presurvey about the subsurface elastic properties and structures. In such modeling of wide-tow streamer scenarios is justified accurate. cases, a suite of candidate 3D plane-layer models should be Worldwide experience, where similar postsurvey calibration built and used as described in the previous “footprint” sec- exercises have been completed, also confirms the robustness tion. Consequently, some kind of quantitative constraint can of the methods described here. be given to the range of acquisition options and their likely consequences upon the ability of processing to achieve all the Offset requirements. Longer offsets are required for optimal survey objectives. seismic imaging, reliable AVO analysis, and to allow suc- cessful multiple identification and removal during process- Illumination studies. In the preceding, only a relatively sim- ing. A common presurvey planning pitfall is to use some kind plistic knowledge of the earth model was required in order 1034 THE LEADING EDGE OCTOBER 2004
- 3. to extract quantitatively useful presur- vey planning information. In contrast, 3D illumination modeling requires a rea- sonably sophisticated knowledge of the 3D earth model if meaningful results are to be extracted. 3D illumination studies can be invaluable for understanding the implications of the source and receiver deployment for a myriad of applica- tions. Figure 3 shows an example from deepwater offshore Brunei where 3D Figure 4. Modeled frequency content versus TWT for two 3D surveys with different bin dimen- ray tracing analysis was pursued with sions. The red and blue curves represent the upper frequency limits (18 dB down) for two source and receiver depth combinations, incorporating anelastic attenuation. The other curves represent the a 550 km2 model built from an inter- Nyquist limits for different dips. Older 3D data acquired with 6/8 m source/streamer depth and pretation of the final migrated cube, and 26.66 m bin width (left) are severely penalized by aliasing (Nyquist) limits for a large TWT range, interval velocities inverted from the pro- resulting in an expected small frequency bandwidth and low-quality imaging of dipping events and duction processing velocities. It was diffraction energy. In contrast, new high-density 3D data acquired with 5/6 m source/streamer demonstrated that common reflection depth and 12.5 m bin width (right) should essentially only be constrained by earth attenuation, point (CRP) “hit density,” incidence resulting in a large frequency bandwidth and high-quality imaging. Refer to Figure 5 for a confir- mation of these predictions. angle ranges, and maximum source- receiver offset ranges were all degraded along the flanks of steep faults for shoot- ing in both the dip and strike directions. Examination of the 3D modeling results clearly demonstrated a remarkable spa- tial correlation between degraded migration amplitudes on very steep events and degraded illumination. The integrated use of 3D illumina- tion modeling results and visualization technology has found several powerful applications for presurvey planning, “near real time” management of acqui- sition infill, and postsurvey QC of data processing and analysis—notably for 4D time-lapse applications (e.g., Widmaier et al., 2001; Hoffmann et al., 2002; Kajl et al., 2002). Again, a detailed knowl- Figure 5. Comparison of the data and comparative frequency spectra (800 ms windows) for 3D data edge of the earth model must be avail- acquired with 13.33 26.66 m bin size (left: 95 000 traces/km2) versus high-density 3D data able, but these examples demonstrate acquired with 6.25 12.5 m bin size (right: 691 000 traces/km2). The new high-density 3D data frequency content versus TWT is essentially constrained by attenuation effects, whereas the older how the entire acquisition-processing- 3D data frequency content versus TWT is constrained by the Nyquist spatial sampling limits (refer interpretation process can be viewed also to Figure 4). and integrated as one entity. • nature of the (2D versus 3D) noise wavefields acquired Frequency bandwidth. Complete target illumination alone in the field, and the ability to suppress them during pro- will not guarantee high-resolution imaging. Once the tar- cessing get is uniformly illuminated, ideally with a full range of off- • accuracy of the 3D velocity model used for processing sets and azimuths (Vermeer, 1998), the upgoing wavefield • aperture size available for processing and imaging must be both temporally and spatially unaliased when • ability to preserve frequency bandwidth throughout the recorded. The wavefield sampling parameterization and entire processing flow, ability to minimize artifacts dur- the recoverable frequency bandwidth are intimately related, ing processing and imaging, and the S/N quality output and can be estimated reasonably accurately if appropriate from imaging consideration is given to all the issues involved in the seis- mic experiment. Of course, these “simple” considerations are distorted The frequency bandwidth recorded during a marine by the complexities of the earth, the logistics of field 3D seis- seismic experiment is a collective function of the source and mic acquisition, and the idiosyncrasies of seismic imaging receiver depths, the 3D directivity functions of the source algorithms. and receiver arrays, the recording instrumentation, and the PGS acquired a 1100 km2 high-density 3D survey offshore inescapable effects of anelastic attenuation within the earth. the Philippines during 2002. A structurally complex car- The ability to reconstruct a high-resolution image of the tar- bonate reservoir occurs at about 3.2 s TWT, below a very get geology is a function of several issues: rugose deep water bottom and an undercompacted, strati- graphically complex overburden. Previous 3D data had • quality of the target illumination failed to yield satisfactory images of the overburden, and • frequency bandwidth of the primary reflections recorded many structural ambiguities at the deep reservoir level com- on tape plicated the drilling and production development of • 3D spatial sampling quality of the upgoing seismic reserves. Presurvey planning recommended that antiparal- wavefield lel shooting in the strike direction would be used to improve OCTOBER 2004 THE LEADING EDGE 1035
- 4. the uniformity of subsurface target illumination coverage, explicit function of a priori information, such as kinematic and that 12.5-m crossline spatial sampling would be acquired analyses of illumination and offset statistics, then a rather to maximize the frequency bandwidth preserved through- predictable link exists between the accuracy of the result and out processing, as there was a strict requirement to achieve the accuracy of the input model. However, it is also shown 70-80 Hz frequencies at the target level. The new 3D data here that dynamic analyses of the acquisition footprint and had a trace density of 691 000 traces/km2, in comparison to the frequency bandwidth can also be quantitatively reliable 95 000 traces/km2 for the existing 3D data. even when the input model is reasonably simplistic and Figure 4 shows presurvey modeling of recoverable band- unconstrained by a detailed knowledge of the earth. width which is verified in Figure 5. Using a quality (Q) fac- Provided that appropriate modeling tools are available, that tor estimated from existing data, the modeled far-field sufficient diligence is given to building realistic elastic earth signature for both existing and proposed surveys was fil- models, and that the principles of elastic wave propagation tered to incorporate attenuation effects versus TWT. An and the seismic method are understood, then it is demon- arbitrary criteria of 18 dB down was used to establish the strated here that presurvey simulations of any 3D seismic “maximum” frequency being recorded. Figure 4 illustrates experiment are both quantitatively accurate and robust. that a slightly shallower source and streamer has somewhat higher recoverable frequencies, but note that caution must Suggested reading. “3D symmetric sampling” by Vermeer be given not to penalize the important lower frequency con- (GEOPHYSICS, 1998). “Spatial sampling characteristics of wide- tent (and thus bandwidth). The Nyquist frequency versus tow marine acquisition” by Beasley and Mobley (EAGE Extended TWT was then computed using a representative velocity pro- Abstracts, 1995). “From acquisition footprints to true ampli- file from this location for bin sizes of 12.5 and 26.66 m (the tude” by Gesbert (GEOPHYSICS, 2002). “On the issue of strike or actual crossline bin widths) and varying target dips. Overall, dip streamer shooting for 3D multistreamer acquisition” by it is clear on Figure 4 that a 12.5 m bin width will only alias Long et al. (Exploration Geophysics, 2004). Seismic Wave steeply-dipping energy for shallow arrival times below the Propagation in Stratified Media by Kennett (Cambridge, 1983). water bottom, and the dominant constraint upon recover- “The value of subsurface coverage modeling for seismic acqui- able frequency is anelastic attenuation in the earth. In con- sition analysis” by Hoffmann et al. (SEG 2002 Expanded trast, a 26.66 m bin width will alias most dipping energy Abstracts). “Using virtual reality for quality control and inter- down to the deep target, and the Nyquist (aliasing) limits pretation of 4D reservoir characterization and AVO analysis” are the outstanding constraint upon recoverable frequency. by Widmaier et al. (TLE, 2001). “High end visualization pro- As predicted, the new high-density 3D data provided a sig- vides new dimensions in survey design and acquisition qual- nificant improvement in high-frequency imaging of all ity control” by Kajl et al. (First Break, 2002). TLE events, notably the stratigraphically complex overburden. At 70 Hz, the new data are 15 dB stronger than the existing Acknowledgments: I thank PGS Marine Geophysical for permission to 3D data (reprocessed in 2001). publish this paper. Proprietary technology contributing to the results Postsurvey analysis of all acquisition parameters con- shown in this paper includes the Nucleus software package, the holoSeis tributing to frequency content indicated that the difference immersive visualization system, and the HD3D high-density 3D acqui- in crossline spatial sampling contributes about half the sition system. Nucleus, holoSeis, and HD3D are registered trademarks observed frequency bandwidth improvement. Other issues, of Petroleum Geo-Services. such as improved navigation positioning, a slightly shal- lower source and streamer depth, a better shooting template, Corresponding author: andrew.long@ pgs.com newer acquisition hardware, and different imaging algo- rithms, must also be acknowledged. Nevertheless, the key issue is that no data contamination from processing and migration noise has affected the new high-density 3D data. Such improvements are sometimes difficult to quantify in presurvey modeling, but the results speak for themselves. Conclusions. This paper only provides a superficial overview of all the possible issues addressed within a presur- vey planning exercise. However, the key outcome is that a systematic approach to modeling (and any applicable com- plementary real data reprocessing) will provide all the con- stituent parts required to understand the geophysical implications of any 3D acquisition parameterization. It is rea- sonably straightforward to constrain and optimize the basic streamer spread dimensions—(1) maximum acceptable streamer spread width; (2) minimum required streamer length, and (3) optimum CMP bin dimensions (incorporates source and frequency bandwidth modeling)—which are the key issues affecting survey cost and efficiency. The next level of planning effort should address different shooting strategies (such as shooting direction, degree of sail line overlap, multiazimuth, etc.), but that is beyond the scope of this discussion. In cases where modeling results are an 1036 THE LEADING EDGE OCTOBER 2004