

Recomendados
Recomendados
Más contenido relacionado
La actualidad más candente
La actualidad más candente (9)
Último
Último (20)
Marketing p4 the results
- 1. p4 marketing travel and tourism unit 10 level 2 Tuesday, 15 January 13
- 2. What do you think of the facilities? Survey results This shows what the question one people who very good good satisfactory terrible completed the survey think of the facilities 6% at Twycross Zoo. 22% 44% 44% think the facilities are very good but 6% 28% thought they were terrible. 50% were satisfied overall. Tuesday, 15 January 13
- 3. Did you enjoy the visit to Twycross Zoo? Question 2 yes no 17% 83% This shows whether people enjoyed the visit or not. 83% enjoyed the visit but 17% did not. Tuesday, 15 January 13
- 4. Would you come to Twycross Zoo again? question 3 This graph shows the survey yes no results of whether these people would come back or 24% not. 76% said they would return. 24% said they would not. 76% Tuesday, 15 January 13
- 5. question 4 Is it value for money? yes no This graph shows the high percentage of people who thought it was value for money. 22% 78% agreed it was while 22% thought it was not. 78% Tuesday, 15 January 13
- 6. question 5 Where is your home town? This graph shows that hometown most 15 visitors lived 11.25 in the Sheffield 7.5 area and not 3.75 too far from the zoo. 0 sheffield texas bangledesh sydney Tuesday, 15 January 13
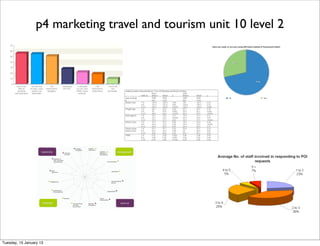
- 7. 6 How did you hear about Twycross Zoo? friend family member word of mouth 6% 6% 24% advertisement 6% tv 6% internet i didnt 6% 6% paper 6% 6% birthday present 12% 6% bilboard 12% website at the farm This graph shows the highest percentage (24%) of people heard about the zoo from a friend. 12 % had seen it advertised on TV and also on the internet. The rest were mixed with small percentages. Tuesday, 15 January 13
- 8. Question 7 If there were entrance gift vouchers available would you consider buying them for family and friends to save them money? yes no 35% 65% This graph shows 65% would buy gift vouchers for family and friends but 35% would not. Tuesday, 15 January 13
- 9. question 8 Tell us about you? male female 41% 59% More males were surveyed but this does not give a full indication that more males would visit the zoo. Tuesday, 15 January 13
- 10. Question 9 What age group are you? less than 18 19-30 31-50 51-60 60+ 12% 6% 6% 76% This graph shows the ages of the people surveyed are 18 or younger. Only 12% were aged 60 or over. Tuesday, 15 January 13
- 11. question 10 Do you feel we have met your needs today? yes no 12% 88% 12% disagree that their needs were met so it would be important to try and find out why. Tuesday, 15 January 13
- 12. To conclude this assignment you should know 18 people participated in this survey Tuesday, 15 January 13
- 13. The conclusion is most people like going to Twycross and that most people would do all the things highlighted in the powerpoint presentation. Tuesday, 15 January 13