
Recomendados
Más contenido relacionado
Último
Último (20)
Destacado
Destacado (20)
Housing census
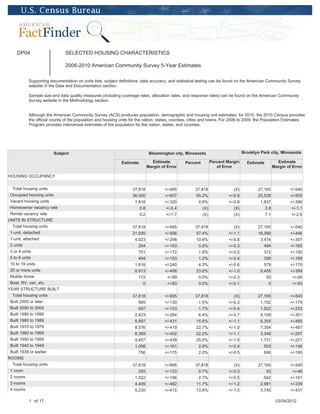
- 1. DP04 SELECTED HOUSING CHARACTERISTICS 2006-2010 American Community Survey 5-Year Estimates Supporting documentation on code lists, subject definitions, data accuracy, and statistical testing can be found on the American Community Survey website in the Data and Documentation section. Sample size and data quality measures (including coverage rates, allocation rates, and response rates) can be found on the American Community Survey website in the Methodology section. Although the American Community Survey (ACS) produces population, demographic and housing unit estimates, for 2010, the 2010 Census provides the official counts of the population and housing units for the nation, states, counties, cities and towns. For 2006 to 2009, the Population Estimates Program provides intercensal estimates of the population for the nation, states, and counties. Subject Bloomington city, Minnesota Brooklyn Park city, Minnesota Estimate Estimate Percent Percent Margin Estimate Estimate Margin of Error of Error Margin of Error HOUSING OCCUPANCY Total housing units 37,818 +/-695 37,818 (X) 27,165 +/-540 Occupied housing units 36,000 +/-607 95.2% +/-0.8 25,528 +/-505 Vacant housing units 1,818 +/-320 4.8% +/-0.8 1,637 +/-386 Homeowner vacancy rate 0.8 +/-0.4 (X) (X) 2.8 +/-1.1 Rental vacancy rate 5.2 +/-1.7 (X) (X) 7.1 +/-2.6 UNITS IN STRUCTURE Total housing units 37,818 +/-695 37,818 (X) 27,165 +/-540 1-unit, detached 21,695 +/-506 57.4% +/-1.1 16,390 +/-446 1-unit, attached 4,023 +/-298 10.6% +/-0.8 3,474 +/-307 2 units 204 +/-100 0.5% +/-0.3 484 +/-165 3 or 4 units 701 +/-172 1.9% +/-0.5 372 +/-150 5 to 9 units 494 +/-153 1.3% +/-0.4 356 +/-169 10 to 19 units 1,616 +/-240 4.3% +/-0.6 579 +/-170 20 or more units 8,913 +/-456 23.6% +/-1.0 5,455 +/-399 Mobile home 172 +/-99 0.5% +/-0.3 55 +/-56 Boat, RV, van, etc. 0 +/-93 0.0% +/-0.1 0 +/-93 YEAR STRUCTURE BUILT Total housing units 37,818 +/-695 37,818 (X) 27,165 +/-540 Built 2005 or later 565 +/-130 1.5% +/-0.3 1,152 +/-179 Built 2000 to 2004 657 +/-153 1.7% +/-0.4 1,922 +/-253 Built 1990 to 1999 2,423 +/-284 6.4% +/-0.7 4,109 +/-301 Built 1980 to 1989 5,897 +/-431 15.6% +/-1.1 6,355 +/-465 Built 1970 to 1979 8,576 +/-419 22.7% +/-1.0 7,354 +/-487 Built 1960 to 1969 8,389 +/-402 22.2% +/-1.1 3,349 +/-257 Built 1950 to 1959 9,457 +/-439 25.0% +/-1.0 1,731 +/-221 Built 1940 to 1949 1,098 +/-161 2.9% +/-0.4 503 +/-146 Built 1939 or earlier 756 +/-175 2.0% +/-0.5 690 +/-195 ROOMS Total housing units 37,818 +/-695 37,818 (X) 27,165 +/-540 1 room 255 +/-123 0.7% +/-0.3 53 +/-48 2 rooms 1,022 +/-196 2.7% +/-0.5 542 +/-161 3 rooms 4,409 +/-462 11.7% +/-1.2 2,991 +/-339 4 rooms 5,230 +/-415 13.8% +/-1.0 3,745 +/-431 1 of 17 03/04/2012
- 2. Subject Bloomington city, Minnesota Brooklyn Park city, Minnesota Estimate Estimate Percent Percent Margin Estimate Estimate Margin of Error of Error Margin of Error 5 rooms 5,692 +/-362 15.1% +/-0.9 3,669 +/-411 6 rooms 5,949 +/-506 15.7% +/-1.3 3,569 +/-378 7 rooms 4,903 +/-376 13.0% +/-1.0 3,604 +/-424 8 rooms 4,151 +/-362 11.0% +/-1.0 4,352 +/-362 9 rooms or more 6,207 +/-379 16.4% +/-1.0 4,640 +/-402 Median rooms 5.9 +/-0.1 (X) (X) 6.2 +/-0.2 BEDROOMS Total housing units 37,818 +/-695 37,818 (X) 27,165 +/-540 No bedroom 350 +/-132 0.9% +/-0.3 64 +/-51 1 bedroom 6,098 +/-437 16.1% +/-1.1 3,548 +/-363 2 bedrooms 10,433 +/-567 27.6% +/-1.4 6,958 +/-593 3 bedrooms 12,761 +/-596 33.7% +/-1.3 7,233 +/-508 4 bedrooms 6,668 +/-422 17.6% +/-1.2 7,327 +/-510 5 or more bedrooms 1,508 +/-218 4.0% +/-0.6 2,035 +/-295 HOUSING TENURE Occupied housing units 36,000 +/-607 36,000 (X) 25,528 +/-505 Owner-occupied 25,387 +/-582 70.5% +/-1.1 18,641 +/-476 Renter-occupied 10,613 +/-428 29.5% +/-1.1 6,887 +/-449 Average household size of owner-occupied unit 2.38 +/-0.03 (X) (X) 3.03 +/-0.06 Average household size of renter-occupied unit 2.00 +/-0.10 (X) (X) 2.47 +/-0.13 YEAR HOUSEHOLDER MOVED INTO UNIT Occupied housing units 36,000 +/-607 36,000 (X) 25,528 +/-505 Moved in 2005 or later 10,955 +/-566 30.4% +/-1.5 8,912 +/-471 Moved in 2000 to 2004 6,986 +/-484 19.4% +/-1.3 6,251 +/-377 Moved in 1990 to 1999 7,466 +/-562 20.7% +/-1.5 5,937 +/-378 Moved in 1980 to 1989 4,823 +/-387 13.4% +/-1.0 2,543 +/-307 Moved in 1970 to 1979 2,649 +/-266 7.4% +/-0.8 1,144 +/-168 Moved in 1969 or earlier 3,121 +/-249 8.7% +/-0.7 741 +/-148 VEHICLES AVAILABLE Occupied housing units 36,000 +/-607 36,000 (X) 25,528 +/-505 No vehicles available 2,369 +/-318 6.6% +/-0.8 1,934 +/-292 1 vehicle available 12,587 +/-565 35.0% +/-1.4 7,372 +/-586 2 vehicles available 15,108 +/-590 42.0% +/-1.5 11,029 +/-552 3 or more vehicles available 5,936 +/-383 16.5% +/-1.1 5,193 +/-396 HOUSE HEATING FUEL Occupied housing units 36,000 +/-607 36,000 (X) 25,528 +/-505 Utility gas 30,843 +/-710 85.7% +/-1.2 22,725 +/-489 Bottled, tank, or LP gas 336 +/-109 0.9% +/-0.3 285 +/-85 Electricity 3,931 +/-372 10.9% +/-1.1 2,269 +/-287 Fuel oil, kerosene, etc. 300 +/-103 0.8% +/-0.3 79 +/-49 Coal or coke 0 +/-93 0.0% +/-0.1 10 +/-15 Wood 46 +/-62 0.1% +/-0.2 10 +/-15 Solar energy 0 +/-93 0.0% +/-0.1 0 +/-93 Other fuel 230 +/-75 0.6% +/-0.2 98 +/-58 No fuel used 314 +/-87 0.9% +/-0.2 52 +/-35 SELECTED CHARACTERISTICS Occupied housing units 36,000 +/-607 36,000 (X) 25,528 +/-505 Lacking complete plumbing facilities 115 +/-74 0.3% +/-0.2 78 +/-83 Lacking complete kitchen facilities 135 +/-75 0.4% +/-0.2 115 +/-89 No telephone service available 792 +/-161 2.2% +/-0.4 406 +/-137 OCCUPANTS PER ROOM Occupied housing units 36,000 +/-607 36,000 (X) 25,528 +/-505 1.00 or less 35,404 +/-703 98.3% +/-0.5 24,218 +/-607 1.01 to 1.50 482 +/-168 1.3% +/-0.5 1,076 +/-239 1.51 or more 114 +/-82 0.3% +/-0.2 234 +/-91 VALUE Owner-occupied units 25,387 +/-582 25,387 (X) 18,641 +/-476 Less than $50,000 492 +/-126 1.9% +/-0.5 363 +/-127 2 of 17 03/04/2012
- 3. Subject Bloomington city, Minnesota Brooklyn Park city, Minnesota Estimate Estimate Percent Percent Margin Estimate Estimate Margin of Error of Error Margin of Error $50,000 to $99,999 368 +/-113 1.4% +/-0.4 455 +/-128 $100,000 to $149,999 1,374 +/-212 5.4% +/-0.8 1,616 +/-233 $150,000 to $199,999 4,621 +/-371 18.2% +/-1.3 4,199 +/-357 $200,000 to $299,999 11,577 +/-504 45.6% +/-1.7 8,108 +/-473 $300,000 to $499,999 5,552 +/-388 21.9% +/-1.5 3,405 +/-300 $500,000 to $999,999 1,299 +/-186 5.1% +/-0.7 448 +/-130 $1,000,000 or more 104 +/-53 0.4% +/-0.2 47 +/-35 Median (dollars) 239,800 +/-2,651 (X) (X) 225,600 +/-2,972 MORTGAGE STATUS Owner-occupied units 25,387 +/-582 25,387 (X) 18,641 +/-476 Housing units with a mortgage 17,098 +/-560 67.3% +/-1.6 15,413 +/-488 Housing units without a mortgage 8,289 +/-465 32.7% +/-1.6 3,228 +/-298 SELECTED MONTHLY OWNER COSTS (SMOC) Housing units with a mortgage 17,098 +/-560 17,098 (X) 15,413 +/-488 Less than $300 45 +/-35 0.3% +/-0.2 58 +/-42 $300 to $499 215 +/-75 1.3% +/-0.4 69 +/-46 $500 to $699 501 +/-118 2.9% +/-0.7 281 +/-114 $700 to $999 1,205 +/-196 7.0% +/-1.1 919 +/-184 $1,000 to $1,499 4,460 +/-381 26.1% +/-2.0 3,924 +/-348 $1,500 to $1,999 5,298 +/-422 31.0% +/-2.2 4,792 +/-406 $2,000 or more 5,374 +/-371 31.4% +/-2.1 5,370 +/-341 Median (dollars) 1,699 +/-34 (X) (X) 1,735 +/-34 Housing units without a mortgage 8,289 +/-465 8,289 (X) 3,228 +/-298 Less than $100 32 +/-24 0.4% +/-0.3 18 +/-26 $100 to $199 143 +/-81 1.7% +/-1.0 41 +/-50 $200 to $299 191 +/-69 2.3% +/-0.8 158 +/-88 $300 to $399 1,258 +/-193 15.2% +/-2.1 409 +/-120 $400 or more 6,665 +/-394 80.4% +/-2.3 2,602 +/-289 Median (dollars) 501 +/-11 (X) (X) 514 +/-23 SELECTED MONTHLY OWNER COSTS AS A PERCENTAGE OF HOUSEHOLD INCOME (SMOCAPI) Housing units with a mortgage (excluding units where 17,044 +/-554 17,044 (X) 15,395 +/-490 SMOCAPI cannot be computed) Less than 20.0 percent 5,528 +/-416 32.4% +/-2.1 4,468 +/-388 20.0 to 24.9 percent 3,018 +/-299 17.7% +/-1.6 2,522 +/-286 25.0 to 29.9 percent 2,335 +/-244 13.7% +/-1.5 2,244 +/-319 30.0 to 34.9 percent 1,814 +/-248 10.6% +/-1.4 1,669 +/-251 35.0 percent or more 4,349 +/-372 25.5% +/-2.0 4,492 +/-428 Not computed 54 +/-37 (X) (X) 18 +/-21 Housing unit without a mortgage (excluding units 8,248 +/-465 8,248 (X) 3,212 +/-300 where SMOCAPI cannot be computed) Less than 10.0 percent 3,557 +/-320 43.1% +/-3.2 1,336 +/-253 10.0 to 14.9 percent 1,641 +/-219 19.9% +/-2.4 732 +/-144 15.0 to 19.9 percent 1,081 +/-182 13.1% +/-2.0 364 +/-128 20.0 to 24.9 percent 624 +/-161 7.6% +/-1.9 280 +/-117 25.0 to 29.9 percent 280 +/-92 3.4% +/-1.1 214 +/-74 30.0 to 34.9 percent 281 +/-84 3.4% +/-1.0 24 +/-28 35.0 percent or more 784 +/-166 9.5% +/-1.9 262 +/-94 Not computed 41 +/-37 (X) (X) 16 +/-23 GROSS RENT Occupied units paying rent 10,293 +/-419 10,293 (X) 6,794 +/-442 Less than $200 161 +/-75 1.6% +/-0.7 190 +/-89 $200 to $299 230 +/-82 2.2% +/-0.8 236 +/-118 $300 to $499 383 +/-126 3.7% +/-1.2 103 +/-57 $500 to $749 1,843 +/-276 17.9% +/-2.5 2,338 +/-322 $750 to $999 4,185 +/-374 40.7% +/-3.4 2,193 +/-353 $1,000 to $1,499 2,751 +/-310 26.7% +/-2.9 1,200 +/-254 $1,500 or more 740 +/-161 7.2% +/-1.5 534 +/-184 Median (dollars) 895 +/-19 (X) (X) 806 +/-27 3 of 17 03/04/2012
- 4. Subject Bloomington city, Minnesota Brooklyn Park city, Minnesota Estimate Estimate Percent Percent Margin Estimate Estimate Margin of Error of Error Margin of Error No rent paid 320 +/-104 (X) (X) 93 +/-55 GROSS RENT AS A PERCENTAGE OF HOUSEHOLD INCOME (GRAPI) Occupied units paying rent (excluding units where 10,179 +/-428 10,179 (X) 6,653 +/-445 GRAPI cannot be computed) Less than 15.0 percent 998 +/-189 9.8% +/-1.8 472 +/-181 15.0 to 19.9 percent 1,261 +/-241 12.4% +/-2.3 703 +/-187 20.0 to 24.9 percent 1,410 +/-249 13.9% +/-2.4 947 +/-241 25.0 to 29.9 percent 1,501 +/-278 14.7% +/-2.6 742 +/-208 30.0 to 34.9 percent 1,134 +/-211 11.1% +/-2.0 549 +/-190 35.0 percent or more 3,875 +/-388 38.1% +/-3.6 3,240 +/-422 Not computed 434 +/-136 (X) (X) 234 +/-103 4 of 17 03/04/2012
- 5. Subject Brooklyn Park city, Minnesota Eden Prairie city, Minnesota Percent Percent Margin Estimate Estimate Percent Percent Margin of Error Margin of Error of Error HOUSING OCCUPANCY Total housing units 27,165 (X) 23,793 +/-444 23,793 (X) Occupied housing units 94.0% +/-1.4 22,836 +/-413 96.0% +/-1.0 Vacant housing units 6.0% +/-1.4 957 +/-246 4.0% +/-1.0 Homeowner vacancy rate (X) (X) 2.2 +/-0.9 (X) (X) Rental vacancy rate (X) (X) 3.9 +/-2.0 (X) (X) UNITS IN STRUCTURE Total housing units 27,165 (X) 23,793 +/-444 23,793 (X) 1-unit, detached 60.3% +/-1.5 12,221 +/-357 51.4% +/-1.2 1-unit, attached 12.8% +/-1.1 5,473 +/-330 23.0% +/-1.3 2 units 1.8% +/-0.6 245 +/-137 1.0% +/-0.6 3 or 4 units 1.4% +/-0.5 371 +/-160 1.6% +/-0.7 5 to 9 units 1.3% +/-0.6 617 +/-130 2.6% +/-0.5 10 to 19 units 2.1% +/-0.6 618 +/-153 2.6% +/-0.6 20 or more units 20.1% +/-1.4 4,248 +/-305 17.9% +/-1.2 Mobile home 0.2% +/-0.2 0 +/-93 0.0% +/-0.1 Boat, RV, van, etc. 0.0% +/-0.1 0 +/-93 0.0% +/-0.1 YEAR STRUCTURE BUILT Total housing units 27,165 (X) 23,793 +/-444 23,793 (X) Built 2005 or later 4.2% +/-0.7 814 +/-187 3.4% +/-0.8 Built 2000 to 2004 7.1% +/-0.9 2,831 +/-348 11.9% +/-1.5 Built 1990 to 1999 15.1% +/-1.1 6,063 +/-354 25.5% +/-1.5 Built 1980 to 1989 23.4% +/-1.7 7,926 +/-460 33.3% +/-1.8 Built 1970 to 1979 27.1% +/-1.7 4,301 +/-394 18.1% +/-1.6 Built 1960 to 1969 12.3% +/-0.9 1,009 +/-158 4.2% +/-0.7 Built 1950 to 1959 6.4% +/-0.8 452 +/-135 1.9% +/-0.6 Built 1940 to 1949 1.9% +/-0.5 67 +/-41 0.3% +/-0.2 Built 1939 or earlier 2.5% +/-0.7 330 +/-125 1.4% +/-0.5 ROOMS Total housing units 27,165 (X) 23,793 +/-444 23,793 (X) 1 room 0.2% +/-0.2 160 +/-99 0.7% +/-0.4 2 rooms 2.0% +/-0.6 474 +/-120 2.0% +/-0.5 3 rooms 11.0% +/-1.2 1,917 +/-287 8.1% +/-1.2 4 rooms 13.8% +/-1.6 3,445 +/-371 14.5% +/-1.6 5 rooms 13.5% +/-1.5 2,360 +/-325 9.9% +/-1.4 6 rooms 13.1% +/-1.4 2,812 +/-310 11.8% +/-1.3 7 rooms 13.3% +/-1.5 2,956 +/-324 12.4% +/-1.3 8 rooms 16.0% +/-1.4 2,682 +/-279 11.3% +/-1.2 9 rooms or more 17.1% +/-1.4 6,987 +/-375 29.4% +/-1.5 Median rooms (X) (X) 6.7 +/-0.2 (X) (X) BEDROOMS Total housing units 27,165 (X) 23,793 +/-444 23,793 (X) No bedroom 0.2% +/-0.2 181 +/-102 0.8% +/-0.4 1 bedroom 13.1% +/-1.3 2,265 +/-282 9.5% +/-1.1 2 bedrooms 25.6% +/-2.1 6,589 +/-401 27.7% +/-1.6 3 bedrooms 26.6% +/-1.8 6,264 +/-427 26.3% +/-1.7 4 bedrooms 27.0% +/-1.9 5,843 +/-398 24.6% +/-1.6 5 or more bedrooms 7.5% +/-1.1 2,651 +/-295 11.1% +/-1.3 HOUSING TENURE Occupied housing units 25,528 (X) 22,836 +/-413 22,836 (X) Owner-occupied 73.0% +/-1.6 16,915 +/-407 74.1% +/-1.3 Renter-occupied 27.0% +/-1.6 5,921 +/-316 25.9% +/-1.3 Average household size of owner-occupied unit (X) (X) 2.70 +/-0.05 (X) (X) Average household size of renter-occupied unit (X) (X) 2.26 +/-0.14 (X) (X) YEAR HOUSEHOLDER MOVED INTO UNIT Occupied housing units 25,528 (X) 22,836 +/-413 22,836 (X) Moved in 2005 or later 34.9% +/-1.7 7,865 +/-431 34.4% +/-1.7 5 of 17 03/04/2012
- 6. Subject Brooklyn Park city, Minnesota Eden Prairie city, Minnesota Percent Percent Margin Estimate Estimate Percent Percent Margin of Error Margin of Error of Error Moved in 2000 to 2004 24.5% +/-1.5 5,672 +/-361 24.8% +/-1.5 Moved in 1990 to 1999 23.3% +/-1.4 5,873 +/-403 25.7% +/-1.7 Moved in 1980 to 1989 10.0% +/-1.2 2,326 +/-258 10.2% +/-1.1 Moved in 1970 to 1979 4.5% +/-0.6 790 +/-141 3.5% +/-0.6 Moved in 1969 or earlier 2.9% +/-0.6 310 +/-84 1.4% +/-0.4 VEHICLES AVAILABLE Occupied housing units 25,528 (X) 22,836 +/-413 22,836 (X) No vehicles available 7.6% +/-1.1 755 +/-173 3.3% +/-0.8 1 vehicle available 28.9% +/-2.0 6,922 +/-412 30.3% +/-1.6 2 vehicles available 43.2% +/-2.0 10,630 +/-563 46.5% +/-2.2 3 or more vehicles available 20.3% +/-1.6 4,529 +/-327 19.8% +/-1.5 HOUSE HEATING FUEL Occupied housing units 25,528 (X) 22,836 +/-413 22,836 (X) Utility gas 89.0% +/-1.1 19,983 +/-504 87.5% +/-1.5 Bottled, tank, or LP gas 1.1% +/-0.3 305 +/-121 1.3% +/-0.5 Electricity 8.9% +/-1.1 2,380 +/-324 10.4% +/-1.4 Fuel oil, kerosene, etc. 0.3% +/-0.2 55 +/-40 0.2% +/-0.2 Coal or coke 0.0% +/-0.1 0 +/-93 0.0% +/-0.1 Wood 0.0% +/-0.1 46 +/-38 0.2% +/-0.2 Solar energy 0.0% +/-0.1 0 +/-93 0.0% +/-0.1 Other fuel 0.4% +/-0.2 34 +/-33 0.1% +/-0.1 No fuel used 0.2% +/-0.1 33 +/-31 0.1% +/-0.1 SELECTED CHARACTERISTICS Occupied housing units 25,528 (X) 22,836 +/-413 22,836 (X) Lacking complete plumbing facilities 0.3% +/-0.3 84 +/-55 0.4% +/-0.2 Lacking complete kitchen facilities 0.5% +/-0.3 88 +/-55 0.4% +/-0.2 No telephone service available 1.6% +/-0.5 496 +/-157 2.2% +/-0.7 OCCUPANTS PER ROOM Occupied housing units 25,528 (X) 22,836 +/-413 22,836 (X) 1.00 or less 94.9% +/-1.0 22,451 +/-473 98.3% +/-0.7 1.01 to 1.50 4.2% +/-1.0 324 +/-142 1.4% +/-0.6 1.51 or more 0.9% +/-0.4 61 +/-63 0.3% +/-0.3 VALUE Owner-occupied units 18,641 (X) 16,915 +/-407 16,915 (X) Less than $50,000 1.9% +/-0.7 113 +/-70 0.7% +/-0.4 $50,000 to $99,999 2.4% +/-0.7 149 +/-75 0.9% +/-0.4 $100,000 to $149,999 8.7% +/-1.2 565 +/-127 3.3% +/-0.7 $150,000 to $199,999 22.5% +/-1.9 1,824 +/-219 10.8% +/-1.2 $200,000 to $299,999 43.5% +/-2.4 4,596 +/-368 27.2% +/-2.1 $300,000 to $499,999 18.3% +/-1.5 6,101 +/-379 36.1% +/-2.1 $500,000 to $999,999 2.4% +/-0.7 2,961 +/-251 17.5% +/-1.5 $1,000,000 or more 0.3% +/-0.2 606 +/-127 3.6% +/-0.7 Median (dollars) (X) (X) 334,100 +/-9,039 (X) (X) MORTGAGE STATUS Owner-occupied units 18,641 (X) 16,915 +/-407 16,915 (X) Housing units with a mortgage 82.7% +/-1.5 13,958 +/-470 82.5% +/-1.8 Housing units without a mortgage 17.3% +/-1.5 2,957 +/-312 17.5% +/-1.8 SELECTED MONTHLY OWNER COSTS (SMOC) Housing units with a mortgage 15,413 (X) 13,958 +/-470 13,958 (X) Less than $300 0.4% +/-0.3 0 +/-93 0.0% +/-0.1 $300 to $499 0.4% +/-0.3 86 +/-69 0.6% +/-0.5 $500 to $699 1.8% +/-0.8 171 +/-89 1.2% +/-0.6 $700 to $999 6.0% +/-1.2 592 +/-139 4.2% +/-1.0 $1,000 to $1,499 25.5% +/-2.0 2,439 +/-306 17.5% +/-2.1 $1,500 to $1,999 31.1% +/-2.3 3,086 +/-282 22.1% +/-1.9 $2,000 or more 34.8% +/-2.0 7,584 +/-410 54.3% +/-2.5 Median (dollars) (X) (X) 2,111 +/-57 (X) (X) Housing units without a mortgage 3,228 (X) 2,957 +/-312 2,957 (X) 6 of 17 03/04/2012
- 7. Subject Brooklyn Park city, Minnesota Eden Prairie city, Minnesota Percent Percent Margin Estimate Estimate Percent Percent Margin of Error Margin of Error of Error Less than $100 0.6% +/-0.8 10 +/-16 0.3% +/-0.5 $100 to $199 1.3% +/-1.5 18 +/-17 0.6% +/-0.6 $200 to $299 4.9% +/-2.7 130 +/-60 4.4% +/-2.0 $300 to $399 12.7% +/-3.6 270 +/-97 9.1% +/-3.0 $400 or more 80.6% +/-4.9 2,529 +/-284 85.5% +/-3.8 Median (dollars) (X) (X) 630 +/-29 (X) (X) SELECTED MONTHLY OWNER COSTS AS A PERCENTAGE OF HOUSEHOLD INCOME (SMOCAPI) Housing units with a mortgage (excluding units where 15,395 (X) 13,919 +/-471 13,919 (X) SMOCAPI cannot be computed) Less than 20.0 percent 29.0% +/-2.5 5,726 +/-394 41.1% +/-2.6 20.0 to 24.9 percent 16.4% +/-1.9 2,365 +/-295 17.0% +/-2.0 25.0 to 29.9 percent 14.6% +/-2.0 1,928 +/-248 13.9% +/-1.7 30.0 to 34.9 percent 10.8% +/-1.6 1,157 +/-212 8.3% +/-1.5 35.0 percent or more 29.2% +/-2.4 2,743 +/-338 19.7% +/-2.3 Not computed (X) (X) 39 +/-60 (X) (X) Housing unit without a mortgage (excluding units 3,212 (X) 2,898 +/-311 2,898 (X) where SMOCAPI cannot be computed) Less than 10.0 percent 41.6% +/-6.3 1,493 +/-211 51.5% +/-4.8 10.0 to 14.9 percent 22.8% +/-4.3 487 +/-128 16.8% +/-3.9 15.0 to 19.9 percent 11.3% +/-3.9 224 +/-84 7.7% +/-2.8 20.0 to 24.9 percent 8.7% +/-3.6 216 +/-85 7.5% +/-2.7 25.0 to 29.9 percent 6.7% +/-2.2 136 +/-60 4.7% +/-2.0 30.0 to 34.9 percent 0.7% +/-0.9 53 +/-41 1.8% +/-1.5 35.0 percent or more 8.2% +/-3.0 289 +/-91 10.0% +/-2.9 Not computed (X) (X) 59 +/-62 (X) (X) GROSS RENT Occupied units paying rent 6,794 (X) 5,921 +/-316 5,921 (X) Less than $200 2.8% +/-1.3 35 +/-32 0.6% +/-0.5 $200 to $299 3.5% +/-1.7 56 +/-34 0.9% +/-0.6 $300 to $499 1.5% +/-0.9 169 +/-106 2.9% +/-1.8 $500 to $749 34.4% +/-4.5 171 +/-87 2.9% +/-1.4 $750 to $999 32.3% +/-4.6 2,335 +/-284 39.4% +/-4.2 $1,000 to $1,499 17.7% +/-3.5 2,499 +/-279 42.2% +/-4.6 $1,500 or more 7.9% +/-2.6 656 +/-174 11.1% +/-2.8 Median (dollars) (X) (X) 1,031 +/-41 (X) (X) No rent paid (X) (X) 0 +/-93 (X) (X) GROSS RENT AS A PERCENTAGE OF HOUSEHOLD INCOME (GRAPI) Occupied units paying rent (excluding units where 6,653 (X) 5,887 +/-314 5,887 (X) GRAPI cannot be computed) Less than 15.0 percent 7.1% +/-2.7 927 +/-214 15.7% +/-3.6 15.0 to 19.9 percent 10.6% +/-2.7 978 +/-220 16.6% +/-3.7 20.0 to 24.9 percent 14.2% +/-3.5 1,064 +/-230 18.1% +/-3.7 25.0 to 29.9 percent 11.2% +/-3.0 756 +/-188 12.8% +/-3.1 30.0 to 34.9 percent 8.3% +/-2.9 413 +/-166 7.0% +/-2.7 35.0 percent or more 48.7% +/-5.2 1,749 +/-259 29.7% +/-4.2 Not computed (X) (X) 34 +/-55 (X) (X) 7 of 17 03/04/2012
- 8. Subject Maple Grove city, Minnesota Minnetonka city, Minnesota Estimate Estimate Percent Percent Margin Estimate Estimate Margin of Error of Error Margin of Error HOUSING OCCUPANCY Total housing units 22,949 +/-444 22,949 (X) 22,963 +/-518 Occupied housing units 21,787 +/-401 94.9% +/-1.1 21,607 +/-442 Vacant housing units 1,162 +/-273 5.1% +/-1.1 1,356 +/-306 Homeowner vacancy rate 1.6 +/-0.8 (X) (X) 0.7 +/-0.5 Rental vacancy rate 9.8 +/-5.0 (X) (X) 8.0 +/-2.9 UNITS IN STRUCTURE Total housing units 22,949 +/-444 22,949 (X) 22,963 +/-518 1-unit, detached 14,868 +/-378 64.8% +/-1.6 13,173 +/-429 1-unit, attached 5,409 +/-413 23.6% +/-1.6 2,878 +/-275 2 units 123 +/-75 0.5% +/-0.3 132 +/-81 3 or 4 units 611 +/-192 2.7% +/-0.8 222 +/-101 5 to 9 units 430 +/-137 1.9% +/-0.6 230 +/-83 10 to 19 units 333 +/-129 1.5% +/-0.6 310 +/-125 20 or more units 1,144 +/-178 5.0% +/-0.7 6,018 +/-371 Mobile home 18 +/-34 0.1% +/-0.1 0 +/-93 Boat, RV, van, etc. 13 +/-20 0.1% +/-0.1 0 +/-93 YEAR STRUCTURE BUILT Total housing units 22,949 +/-444 22,949 (X) 22,963 +/-518 Built 2005 or later 1,392 +/-196 6.1% +/-0.9 392 +/-142 Built 2000 to 2004 3,951 +/-311 17.2% +/-1.3 814 +/-170 Built 1990 to 1999 5,126 +/-369 22.3% +/-1.6 2,809 +/-332 Built 1980 to 1989 5,563 +/-389 24.2% +/-1.6 6,186 +/-410 Built 1970 to 1979 4,985 +/-299 21.7% +/-1.3 4,645 +/-375 Built 1960 to 1969 1,017 +/-166 4.4% +/-0.7 3,236 +/-319 Built 1950 to 1959 405 +/-126 1.8% +/-0.6 3,287 +/-281 Built 1940 to 1949 91 +/-72 0.4% +/-0.3 683 +/-164 Built 1939 or earlier 419 +/-151 1.8% +/-0.7 911 +/-177 ROOMS Total housing units 22,949 +/-444 22,949 (X) 22,963 +/-518 1 room 36 +/-36 0.2% +/-0.2 98 +/-67 2 rooms 82 +/-62 0.4% +/-0.3 480 +/-142 3 rooms 767 +/-183 3.3% +/-0.8 2,492 +/-308 4 rooms 1,988 +/-291 8.7% +/-1.3 2,947 +/-352 5 rooms 2,824 +/-337 12.3% +/-1.4 3,095 +/-304 6 rooms 3,484 +/-311 15.2% +/-1.3 2,924 +/-332 7 rooms 3,317 +/-319 14.5% +/-1.4 2,381 +/-217 8 rooms 3,766 +/-340 16.4% +/-1.4 3,107 +/-310 9 rooms or more 6,685 +/-383 29.1% +/-1.7 5,439 +/-327 Median rooms 7.2 +/-0.1 (X) (X) 6.3 +/-0.1 BEDROOMS Total housing units 22,949 +/-444 22,949 (X) 22,963 +/-518 No bedroom 36 +/-36 0.2% +/-0.2 116 +/-69 1 bedroom 656 +/-165 2.9% +/-0.7 3,203 +/-362 2 bedrooms 5,466 +/-379 23.8% +/-1.5 5,951 +/-449 3 bedrooms 7,353 +/-501 32.0% +/-2.1 7,304 +/-415 4 bedrooms 7,248 +/-440 31.6% +/-1.9 4,776 +/-297 5 or more bedrooms 2,190 +/-259 9.5% +/-1.1 1,613 +/-196 HOUSING TENURE Occupied housing units 21,787 +/-401 21,787 (X) 21,607 +/-442 Owner-occupied 19,543 +/-440 89.7% +/-1.1 15,844 +/-400 Renter-occupied 2,244 +/-246 10.3% +/-1.1 5,763 +/-357 Average household size of owner-occupied unit 2.74 +/-0.05 (X) (X) 2.44 +/-0.05 Average household size of renter-occupied unit 2.40 +/-0.27 (X) (X) 1.81 +/-0.11 YEAR HOUSEHOLDER MOVED INTO UNIT Occupied housing units 21,787 +/-401 21,787 (X) 21,607 +/-442 Moved in 2005 or later 5,870 +/-415 26.9% +/-1.8 6,618 +/-448 8 of 17 03/04/2012
- 9. Subject Maple Grove city, Minnesota Minnetonka city, Minnesota Estimate Estimate Percent Percent Margin Estimate Estimate Margin of Error of Error Margin of Error Moved in 2000 to 2004 5,834 +/-445 26.8% +/-1.8 4,629 +/-341 Moved in 1990 to 1999 5,951 +/-377 27.3% +/-1.8 5,091 +/-370 Moved in 1980 to 1989 2,707 +/-268 12.4% +/-1.2 2,716 +/-298 Moved in 1970 to 1979 1,188 +/-175 5.5% +/-0.8 1,371 +/-192 Moved in 1969 or earlier 237 +/-73 1.1% +/-0.3 1,182 +/-147 VEHICLES AVAILABLE Occupied housing units 21,787 +/-401 21,787 (X) 21,607 +/-442 No vehicles available 391 +/-128 1.8% +/-0.6 756 +/-178 1 vehicle available 5,247 +/-425 24.1% +/-1.7 7,078 +/-465 2 vehicles available 11,287 +/-506 51.8% +/-2.2 9,971 +/-457 3 or more vehicles available 4,862 +/-354 22.3% +/-1.7 3,802 +/-332 HOUSE HEATING FUEL Occupied housing units 21,787 +/-401 21,787 (X) 21,607 +/-442 Utility gas 20,181 +/-397 92.6% +/-0.8 18,208 +/-502 Bottled, tank, or LP gas 310 +/-133 1.4% +/-0.6 238 +/-94 Electricity 1,130 +/-154 5.2% +/-0.7 2,618 +/-345 Fuel oil, kerosene, etc. 108 +/-80 0.5% +/-0.4 287 +/-109 Coal or coke 0 +/-93 0.0% +/-0.1 0 +/-93 Wood 8 +/-14 0.0% +/-0.1 29 +/-27 Solar energy 0 +/-93 0.0% +/-0.1 0 +/-93 Other fuel 43 +/-31 0.2% +/-0.1 147 +/-81 No fuel used 7 +/-11 0.0% +/-0.1 80 +/-52 SELECTED CHARACTERISTICS Occupied housing units 21,787 +/-401 21,787 (X) 21,607 +/-442 Lacking complete plumbing facilities 15 +/-18 0.1% +/-0.1 28 +/-29 Lacking complete kitchen facilities 33 +/-30 0.2% +/-0.1 41 +/-27 No telephone service available 272 +/-85 1.2% +/-0.4 281 +/-91 OCCUPANTS PER ROOM Occupied housing units 21,787 +/-401 21,787 (X) 21,607 +/-442 1.00 or less 21,696 +/-425 99.6% +/-0.3 21,500 +/-463 1.01 to 1.50 52 +/-59 0.2% +/-0.3 107 +/-73 1.51 or more 39 +/-37 0.2% +/-0.2 0 +/-93 VALUE Owner-occupied units 19,543 +/-440 19,543 (X) 15,844 +/-400 Less than $50,000 156 +/-70 0.8% +/-0.4 90 +/-45 $50,000 to $99,999 98 +/-52 0.5% +/-0.3 114 +/-78 $100,000 to $149,999 537 +/-123 2.7% +/-0.6 673 +/-138 $150,000 to $199,999 3,592 +/-304 18.4% +/-1.4 1,432 +/-210 $200,000 to $299,999 7,403 +/-408 37.9% +/-1.9 4,688 +/-284 $300,000 to $499,999 5,459 +/-332 27.9% +/-1.6 5,939 +/-368 $500,000 to $999,999 2,156 +/-242 11.0% +/-1.2 2,528 +/-296 $1,000,000 or more 142 +/-74 0.7% +/-0.4 380 +/-130 Median (dollars) 264,900 +/-5,203 (X) (X) 323,700 +/-7,405 MORTGAGE STATUS Owner-occupied units 19,543 +/-440 19,543 (X) 15,844 +/-400 Housing units with a mortgage 16,761 +/-479 85.8% +/-1.4 11,547 +/-430 Housing units without a mortgage 2,782 +/-280 14.2% +/-1.4 4,297 +/-314 SELECTED MONTHLY OWNER COSTS (SMOC) Housing units with a mortgage 16,761 +/-479 16,761 (X) 11,547 +/-430 Less than $300 54 +/-43 0.3% +/-0.3 10 +/-16 $300 to $499 103 +/-72 0.6% +/-0.4 81 +/-60 $500 to $699 299 +/-99 1.8% +/-0.6 104 +/-48 $700 to $999 740 +/-147 4.4% +/-0.9 564 +/-156 $1,000 to $1,499 4,119 +/-380 24.6% +/-2.0 2,220 +/-241 $1,500 to $1,999 4,984 +/-398 29.7% +/-2.2 3,073 +/-272 $2,000 or more 6,462 +/-356 38.6% +/-2.1 5,495 +/-379 Median (dollars) 1,782 +/-36 (X) (X) 1,949 +/-50 Housing units without a mortgage 2,782 +/-280 2,782 (X) 4,297 +/-314 9 of 17 03/04/2012
- 10. Subject Maple Grove city, Minnesota Minnetonka city, Minnesota Estimate Estimate Percent Percent Margin Estimate Estimate Margin of Error of Error Margin of Error Less than $100 0 +/-93 0.0% +/-0.7 12 +/-19 $100 to $199 10 +/-16 0.4% +/-0.6 23 +/-19 $200 to $299 101 +/-50 3.6% +/-1.8 79 +/-43 $300 to $399 340 +/-105 12.2% +/-3.6 347 +/-106 $400 or more 2,331 +/-270 83.8% +/-3.7 3,836 +/-302 Median (dollars) 535 +/-17 (X) (X) 627 +/-22 SELECTED MONTHLY OWNER COSTS AS A PERCENTAGE OF HOUSEHOLD INCOME (SMOCAPI) Housing units with a mortgage (excluding units where 16,706 +/-471 16,706 (X) 11,522 +/-431 SMOCAPI cannot be computed) Less than 20.0 percent 6,846 +/-455 41.0% +/-2.5 4,667 +/-332 20.0 to 24.9 percent 3,262 +/-285 19.5% +/-1.6 1,722 +/-236 25.0 to 29.9 percent 2,293 +/-230 13.7% +/-1.4 1,340 +/-209 30.0 to 34.9 percent 1,403 +/-246 8.4% +/-1.4 1,109 +/-187 35.0 percent or more 2,902 +/-299 17.4% +/-1.7 2,684 +/-356 Not computed 55 +/-66 (X) (X) 25 +/-25 Housing unit without a mortgage (excluding units 2,782 +/-280 2,782 (X) 4,297 +/-314 where SMOCAPI cannot be computed) Less than 10.0 percent 1,571 +/-211 56.5% +/-5.2 1,823 +/-212 10.0 to 14.9 percent 467 +/-111 16.8% +/-3.8 882 +/-134 15.0 to 19.9 percent 243 +/-83 8.7% +/-2.7 550 +/-135 20.0 to 24.9 percent 190 +/-73 6.8% +/-2.7 308 +/-97 25.0 to 29.9 percent 116 +/-65 4.2% +/-2.2 227 +/-73 30.0 to 34.9 percent 40 +/-38 1.4% +/-1.3 110 +/-56 35.0 percent or more 155 +/-76 5.6% +/-2.6 397 +/-133 Not computed 0 +/-93 (X) (X) 0 +/-93 GROSS RENT Occupied units paying rent 2,214 +/-249 2,214 (X) 5,499 +/-339 Less than $200 13 +/-20 0.6% +/-0.9 77 +/-50 $200 to $299 46 +/-45 2.1% +/-2.0 72 +/-56 $300 to $499 36 +/-35 1.6% +/-1.5 240 +/-120 $500 to $749 247 +/-112 11.2% +/-5.0 297 +/-114 $750 to $999 377 +/-108 17.0% +/-4.7 1,966 +/-245 $1,000 to $1,499 1,056 +/-192 47.7% +/-6.7 2,031 +/-234 $1,500 or more 439 +/-122 19.8% +/-4.9 816 +/-177 Median (dollars) 1,164 +/-61 (X) (X) 1,018 +/-41 No rent paid 30 +/-33 (X) (X) 264 +/-128 GROSS RENT AS A PERCENTAGE OF HOUSEHOLD INCOME (GRAPI) Occupied units paying rent (excluding units where 2,173 +/-253 2,173 (X) 5,488 +/-339 GRAPI cannot be computed) Less than 15.0 percent 189 +/-86 8.7% +/-3.9 1,038 +/-224 15.0 to 19.9 percent 259 +/-110 11.9% +/-4.8 825 +/-194 20.0 to 24.9 percent 466 +/-154 21.4% +/-6.4 871 +/-221 25.0 to 29.9 percent 317 +/-117 14.6% +/-5.3 656 +/-195 30.0 to 34.9 percent 251 +/-127 11.6% +/-5.5 527 +/-140 35.0 percent or more 691 +/-174 31.8% +/-7.8 1,571 +/-236 Not computed 71 +/-51 (X) (X) 275 +/-129 10 of 17 03/04/2012
- 11. Subject Minnetonka city, Minnesota Osseo city, Minnesota Percent Percent Margin Estimate Estimate Percent Percent Margin of Error Margin of Error of Error HOUSING OCCUPANCY Total housing units 22,963 (X) 1,267 +/-55 1,267 (X) Occupied housing units 94.1% +/-1.3 1,148 +/-65 90.6% +/-4.7 Vacant housing units 5.9% +/-1.3 119 +/-62 9.4% +/-4.7 Homeowner vacancy rate (X) (X) 0.0 +/-3.0 (X) (X) Rental vacancy rate (X) (X) 8.7 +/-7.6 (X) (X) UNITS IN STRUCTURE Total housing units 22,963 (X) 1,267 +/-55 1,267 (X) 1-unit, detached 57.4% +/-1.4 613 +/-64 48.4% +/-4.7 1-unit, attached 12.5% +/-1.2 17 +/-13 1.3% +/-1.0 2 units 0.6% +/-0.3 0 +/-93 0.0% +/-1.6 3 or 4 units 1.0% +/-0.4 24 +/-29 1.9% +/-2.3 5 to 9 units 1.0% +/-0.4 17 +/-17 1.3% +/-1.3 10 to 19 units 1.3% +/-0.5 249 +/-69 19.7% +/-5.5 20 or more units 26.2% +/-1.3 347 +/-68 27.4% +/-5.2 Mobile home 0.0% +/-0.1 0 +/-93 0.0% +/-1.6 Boat, RV, van, etc. 0.0% +/-0.1 0 +/-93 0.0% +/-1.6 YEAR STRUCTURE BUILT Total housing units 22,963 (X) 1,267 +/-55 1,267 (X) Built 2005 or later 1.7% +/-0.6 7 +/-10 0.6% +/-0.8 Built 2000 to 2004 3.5% +/-0.7 116 +/-36 9.2% +/-2.7 Built 1990 to 1999 12.2% +/-1.4 84 +/-35 6.6% +/-2.7 Built 1980 to 1989 26.9% +/-1.6 75 +/-46 5.9% +/-3.5 Built 1970 to 1979 20.2% +/-1.6 170 +/-54 13.4% +/-4.3 Built 1960 to 1969 14.1% +/-1.4 285 +/-70 22.5% +/-5.5 Built 1950 to 1959 14.3% +/-1.2 258 +/-65 20.4% +/-5.0 Built 1940 to 1949 3.0% +/-0.7 165 +/-50 13.0% +/-3.9 Built 1939 or earlier 4.0% +/-0.8 107 +/-40 8.4% +/-3.1 ROOMS Total housing units 22,963 (X) 1,267 +/-55 1,267 (X) 1 room 0.4% +/-0.3 59 +/-43 4.7% +/-3.4 2 rooms 2.1% +/-0.6 50 +/-34 3.9% +/-2.6 3 rooms 10.9% +/-1.3 181 +/-71 14.3% +/-5.6 4 rooms 12.8% +/-1.5 315 +/-66 24.9% +/-5.0 5 rooms 13.5% +/-1.3 164 +/-56 12.9% +/-4.3 6 rooms 12.7% +/-1.4 192 +/-56 15.2% +/-4.5 7 rooms 10.4% +/-1.0 81 +/-31 6.4% +/-2.5 8 rooms 13.5% +/-1.3 115 +/-40 9.1% +/-3.2 9 rooms or more 23.7% +/-1.4 110 +/-39 8.7% +/-3.0 Median rooms (X) (X) 4.7 +/-0.4 (X) (X) BEDROOMS Total housing units 22,963 (X) 1,267 +/-55 1,267 (X) No bedroom 0.5% +/-0.3 59 +/-43 4.7% +/-3.4 1 bedroom 13.9% +/-1.4 270 +/-76 21.3% +/-5.9 2 bedrooms 25.9% +/-1.9 474 +/-71 37.4% +/-5.6 3 bedrooms 31.8% +/-1.7 298 +/-57 23.5% +/-4.4 4 bedrooms 20.8% +/-1.3 136 +/-46 10.7% +/-3.6 5 or more bedrooms 7.0% +/-0.9 30 +/-25 2.4% +/-1.9 HOUSING TENURE Occupied housing units 21,607 (X) 1,148 +/-65 1,148 (X) Owner-occupied 73.3% +/-1.4 612 +/-71 53.3% +/-5.7 Renter-occupied 26.7% +/-1.4 536 +/-75 46.7% +/-5.7 Average household size of owner-occupied unit (X) (X) 2.15 +/-0.16 (X) (X) Average household size of renter-occupied unit (X) (X) 1.61 +/-0.19 (X) (X) YEAR HOUSEHOLDER MOVED INTO UNIT Occupied housing units 21,607 (X) 1,148 +/-65 1,148 (X) Moved in 2005 or later 30.6% +/-1.9 479 +/-74 41.7% +/-6.0 11 of 17 03/04/2012
- 12. Subject Minnetonka city, Minnesota Osseo city, Minnesota Percent Percent Margin Estimate Estimate Percent Percent Margin of Error Margin of Error of Error Moved in 2000 to 2004 21.4% +/-1.6 255 +/-53 22.2% +/-4.4 Moved in 1990 to 1999 23.6% +/-1.7 134 +/-45 11.7% +/-3.9 Moved in 1980 to 1989 12.6% +/-1.3 61 +/-30 5.3% +/-2.5 Moved in 1970 to 1979 6.3% +/-0.9 71 +/-30 6.2% +/-2.5 Moved in 1969 or earlier 5.5% +/-0.6 148 +/-49 12.9% +/-4.2 VEHICLES AVAILABLE Occupied housing units 21,607 (X) 1,148 +/-65 1,148 (X) No vehicles available 3.5% +/-0.8 177 +/-50 15.4% +/-4.2 1 vehicle available 32.8% +/-1.8 486 +/-85 42.3% +/-6.9 2 vehicles available 46.1% +/-2.0 345 +/-72 30.1% +/-6.0 3 or more vehicles available 17.6% +/-1.6 140 +/-42 12.2% +/-3.6 HOUSE HEATING FUEL Occupied housing units 21,607 (X) 1,148 +/-65 1,148 (X) Utility gas 84.3% +/-1.7 947 +/-70 82.5% +/-4.4 Bottled, tank, or LP gas 1.1% +/-0.4 13 +/-13 1.1% +/-1.1 Electricity 12.1% +/-1.5 157 +/-48 13.7% +/-4.1 Fuel oil, kerosene, etc. 1.3% +/-0.5 13 +/-14 1.1% +/-1.2 Coal or coke 0.0% +/-0.1 0 +/-93 0.0% +/-1.7 Wood 0.1% +/-0.1 0 +/-93 0.0% +/-1.7 Solar energy 0.0% +/-0.1 0 +/-93 0.0% +/-1.7 Other fuel 0.7% +/-0.4 13 +/-15 1.1% +/-1.3 No fuel used 0.4% +/-0.2 5 +/-9 0.4% +/-0.8 SELECTED CHARACTERISTICS Occupied housing units 21,607 (X) 1,148 +/-65 1,148 (X) Lacking complete plumbing facilities 0.1% +/-0.1 21 +/-32 1.8% +/-2.7 Lacking complete kitchen facilities 0.2% +/-0.1 0 +/-93 0.0% +/-1.7 No telephone service available 1.3% +/-0.4 68 +/-41 5.9% +/-3.6 OCCUPANTS PER ROOM Occupied housing units 21,607 (X) 1,148 +/-65 1,148 (X) 1.00 or less 99.5% +/-0.3 1,133 +/-66 98.7% +/-1.5 1.01 to 1.50 0.5% +/-0.3 15 +/-18 1.3% +/-1.5 1.51 or more 0.0% +/-0.1 0 +/-93 0.0% +/-1.7 VALUE Owner-occupied units 15,844 (X) 612 +/-71 612 (X) Less than $50,000 0.6% +/-0.3 23 +/-15 3.8% +/-2.4 $50,000 to $99,999 0.7% +/-0.5 24 +/-16 3.9% +/-2.6 $100,000 to $149,999 4.2% +/-0.9 17 +/-15 2.8% +/-2.5 $150,000 to $199,999 9.0% +/-1.3 169 +/-58 27.6% +/-8.4 $200,000 to $299,999 29.6% +/-1.6 339 +/-56 55.4% +/-7.9 $300,000 to $499,999 37.5% +/-2.0 32 +/-24 5.2% +/-4.0 $500,000 to $999,999 16.0% +/-1.8 0 +/-93 0.0% +/-3.2 $1,000,000 or more 2.4% +/-0.8 8 +/-11 1.3% +/-1.8 Median (dollars) (X) (X) 213,700 +/-7,658 (X) (X) MORTGAGE STATUS Owner-occupied units 15,844 (X) 612 +/-71 612 (X) Housing units with a mortgage 72.9% +/-1.9 366 +/-61 59.8% +/-8.1 Housing units without a mortgage 27.1% +/-1.9 246 +/-60 40.2% +/-8.1 SELECTED MONTHLY OWNER COSTS (SMOC) Housing units with a mortgage 11,547 (X) 366 +/-61 366 (X) Less than $300 0.1% +/-0.1 0 +/-93 0.0% +/-5.3 $300 to $499 0.7% +/-0.5 0 +/-93 0.0% +/-5.3 $500 to $699 0.9% +/-0.4 6 +/-8 1.6% +/-2.3 $700 to $999 4.9% +/-1.3 12 +/-13 3.3% +/-3.4 $1,000 to $1,499 19.2% +/-2.0 73 +/-34 19.9% +/-8.5 $1,500 to $1,999 26.6% +/-2.2 165 +/-43 45.1% +/-10.5 $2,000 or more 47.6% +/-2.5 110 +/-43 30.1% +/-10.3 Median (dollars) (X) (X) 1,740 +/-111 (X) (X) Housing units without a mortgage 4,297 (X) 246 +/-60 246 (X) 12 of 17 03/04/2012
- 13. Subject Minnetonka city, Minnesota Osseo city, Minnesota Percent Percent Margin Estimate Estimate Percent Percent Margin of Error Margin of Error of Error Less than $100 0.3% +/-0.4 0 +/-93 0.0% +/-7.8 $100 to $199 0.5% +/-0.4 12 +/-13 4.9% +/-5.3 $200 to $299 1.8% +/-1.0 0 +/-93 0.0% +/-7.8 $300 to $399 8.1% +/-2.4 42 +/-41 17.1% +/-14.4 $400 or more 89.3% +/-2.5 192 +/-42 78.0% +/-14.3 Median (dollars) (X) (X) 495 +/-51 (X) (X) SELECTED MONTHLY OWNER COSTS AS A PERCENTAGE OF HOUSEHOLD INCOME (SMOCAPI) Housing units with a mortgage (excluding units where 11,522 (X) 366 +/-61 366 (X) SMOCAPI cannot be computed) Less than 20.0 percent 40.5% +/-2.9 72 +/-36 19.7% +/-9.4 20.0 to 24.9 percent 14.9% +/-2.0 106 +/-44 29.0% +/-11.4 25.0 to 29.9 percent 11.6% +/-1.7 48 +/-28 13.1% +/-7.5 30.0 to 34.9 percent 9.6% +/-1.5 38 +/-27 10.4% +/-7.0 35.0 percent or more 23.3% +/-2.8 102 +/-37 27.9% +/-8.5 Not computed (X) (X) 0 +/-93 (X) (X) Housing unit without a mortgage (excluding units 4,297 (X) 246 +/-60 246 (X) where SMOCAPI cannot be computed) Less than 10.0 percent 42.4% +/-4.0 57 +/-31 23.2% +/-11.6 10.0 to 14.9 percent 20.5% +/-3.3 40 +/-24 16.3% +/-8.7 15.0 to 19.9 percent 12.8% +/-2.9 51 +/-36 20.7% +/-11.7 20.0 to 24.9 percent 7.2% +/-2.2 19 +/-14 7.7% +/-5.5 25.0 to 29.9 percent 5.3% +/-1.7 20 +/-18 8.1% +/-7.3 30.0 to 34.9 percent 2.6% +/-1.3 12 +/-15 4.9% +/-6.2 35.0 percent or more 9.2% +/-2.8 47 +/-24 19.1% +/-9.9 Not computed (X) (X) 0 +/-93 (X) (X) GROSS RENT Occupied units paying rent 5,499 (X) 536 +/-75 536 (X) Less than $200 1.4% +/-0.9 0 +/-93 0.0% +/-3.7 $200 to $299 1.3% +/-1.0 6 +/-9 1.1% +/-1.6 $300 to $499 4.4% +/-2.1 37 +/-33 6.9% +/-6.0 $500 to $749 5.4% +/-2.1 254 +/-70 47.4% +/-11.5 $750 to $999 35.8% +/-4.1 182 +/-64 34.0% +/-11.2 $1,000 to $1,499 36.9% +/-3.5 33 +/-26 6.2% +/-4.8 $1,500 or more 14.8% +/-3.1 24 +/-27 4.5% +/-4.8 Median (dollars) (X) (X) 732 +/-35 (X) (X) No rent paid (X) (X) 0 +/-93 (X) (X) GROSS RENT AS A PERCENTAGE OF HOUSEHOLD INCOME (GRAPI) Occupied units paying rent (excluding units where 5,488 (X) 529 +/-75 529 (X) GRAPI cannot be computed) Less than 15.0 percent 18.9% +/-3.9 37 +/-23 7.0% +/-4.3 15.0 to 19.9 percent 15.0% +/-3.6 66 +/-32 12.5% +/-6.1 20.0 to 24.9 percent 15.9% +/-3.9 99 +/-45 18.7% +/-7.9 25.0 to 29.9 percent 12.0% +/-3.4 38 +/-26 7.2% +/-4.8 30.0 to 34.9 percent 9.6% +/-2.5 111 +/-49 21.0% +/-8.1 35.0 percent or more 28.6% +/-4.0 178 +/-56 33.6% +/-9.2 Not computed (X) (X) 7 +/-11 (X) (X) 13 of 17 03/04/2012
- 14. Subject Plymouth city, Minnesota Estimate Estimate Percent Percent Margin Margin of Error of Error HOUSING OCCUPANCY Total housing units 29,451 +/-489 29,451 (X) Occupied housing units 27,917 +/-428 94.8% +/-1.0 Vacant housing units 1,534 +/-300 5.2% +/-1.0 Homeowner vacancy rate 1.1 +/-0.6 (X) (X) Rental vacancy rate 7.5 +/-2.5 (X) (X) UNITS IN STRUCTURE Total housing units 29,451 +/-489 29,451 (X) 1-unit, detached 15,901 +/-420 54.0% +/-1.2 1-unit, attached 5,118 +/-326 17.4% +/-1.0 2 units 217 +/-103 0.7% +/-0.3 3 or 4 units 529 +/-140 1.8% +/-0.5 5 to 9 units 483 +/-159 1.6% +/-0.5 10 to 19 units 501 +/-147 1.7% +/-0.5 20 or more units 6,672 +/-365 22.7% +/-1.2 Mobile home 30 +/-34 0.1% +/-0.1 Boat, RV, van, etc. 0 +/-93 0.0% +/-0.1 YEAR STRUCTURE BUILT Total housing units 29,451 +/-489 29,451 (X) Built 2005 or later 840 +/-162 2.9% +/-0.5 Built 2000 to 2004 3,789 +/-359 12.9% +/-1.2 Built 1990 to 1999 6,071 +/-398 20.6% +/-1.4 Built 1980 to 1989 8,222 +/-455 27.9% +/-1.5 Built 1970 to 1979 6,027 +/-403 20.5% +/-1.3 Built 1960 to 1969 2,323 +/-268 7.9% +/-0.9 Built 1950 to 1959 1,326 +/-224 4.5% +/-0.7 Built 1940 to 1949 382 +/-129 1.3% +/-0.4 Built 1939 or earlier 471 +/-147 1.6% +/-0.5 ROOMS Total housing units 29,451 +/-489 29,451 (X) 1 room 117 +/-78 0.4% +/-0.3 2 rooms 656 +/-161 2.2% +/-0.6 3 rooms 3,243 +/-385 11.0% +/-1.3 4 rooms 4,145 +/-422 14.1% +/-1.4 5 rooms 3,618 +/-389 12.3% +/-1.3 6 rooms 2,982 +/-321 10.1% +/-1.0 7 rooms 3,750 +/-321 12.7% +/-1.1 8 rooms 3,394 +/-345 11.5% +/-1.1 9 rooms or more 7,546 +/-423 25.6% +/-1.4 Median rooms 6.5 +/-0.2 (X) (X) BEDROOMS Total housing units 29,451 +/-489 29,451 (X) No bedroom 140 +/-81 0.5% +/-0.3 1 bedroom 3,263 +/-318 11.1% +/-1.1 2 bedrooms 8,890 +/-486 30.2% +/-1.5 3 bedrooms 7,565 +/-488 25.7% +/-1.6 4 bedrooms 6,909 +/-365 23.5% +/-1.2 5 or more bedrooms 2,684 +/-262 9.1% +/-0.9 HOUSING TENURE Occupied housing units 27,917 +/-428 27,917 (X) Owner-occupied 20,499 +/-473 73.4% +/-1.2 Renter-occupied 7,418 +/-345 26.6% +/-1.2 Average household size of owner-occupied unit 2.56 +/-0.04 (X) (X) Average household size of renter-occupied unit 2.06 +/-0.08 (X) (X) YEAR HOUSEHOLDER MOVED INTO UNIT Occupied housing units 27,917 +/-428 27,917 (X) Moved in 2005 or later 9,248 +/-403 33.1% +/-1.4 14 of 17 03/04/2012