1. 2010 V38 1: pp. 121–154
DOI: 10.1111/j.1540-6229.2009.00253.x
REAL ESTATE
ECONOMICS
Alternative Benchmarks for Evaluating
Mutual Fund Performance
Jay C. Hartzell,∗ Tobias Muhlhofer∗∗ and Sheridan D. Titman∗∗∗
¨
While real estate investment trusts (REITs) have experienced very high growth
rates over the past 15 years, the growth in mutual funds that invest in REITs has
been even more dramatic. REIT mutual fund returns are typically presented
relative to the return on a simple value-weighted REIT index. We ask whether
including additional factors when benchmarking funds’ returns can improve
the explanatory power of the models and offer more precise estimates of al-
pha. We investigate three sets of REIT-based benchmarks, plus an index of
returns derived from non-REIT real estate firms, namely homebuilders and real
estate operating companies. The REIT-based factors are a set of characteristic
factors, a set of property-type factors and a set of statistical factors. Using
traditional single-index benchmarks, we find that about 6% of the REIT funds
exhibit significant positive performance using traditional significance levels,
which is more than twice what random chance would predict. However, with
the multiple-index benchmarks that we prefer, this falls considerably to only
0.7%. In addition, we find that these sets of factors and the non-REIT indices
better explain the month-to-month returns of the REIT mutual funds. This sug-
gests that investors or researchers evaluating REIT mutual fund performance
may benefit from a multiple-benchmark approach.
Over the past several years, the total market value of publicly traded real estate
investment trusts (REITs) has grown rapidly. In 1990, prior to the Omnibus
Budget Reconciliation Act of 1993 that changed REIT ownership rules, there
were about 117 REITs with a total market capitalization of about $8.5 billion. In
1994, after the Act, there were 230 REITs with a combined market capitalization
of about $46 billion. By 2005, while the number of REITs had declined slightly
to 208, the total market capitalization had grown to $355 billion, representing
a compound annual growth rate of more than 20%.
Along with this growth in the REIT market has been an even greater growth
in mutual funds that specialize in REITs. Over the same period, the number
∗
McCombs School of Business, The University of Texas at Austin, Austin, TX 78712
or Jay.Hartzell@mccombs.utexas.edu.
∗∗
Kelley School of Business, Indiana University, Bloomington, IN 47405 or
tmuhlhof@indiana.edu.
∗∗∗
McCombs School of Business, The University of Texas at Austin, Austin, TX 78712
or titman@mail.utexas.edu.
C 2009 American Real Estate and Urban Economics Association
2. 122 Hartzell, Muhlhofer and Titman
¨
of REIT funds has grown from 27 to 235, or, more conservatively, the number
of unique funds (considering only one share class per fund) has grown from
16 to 132. Meanwhile, the total market capitalization of all REIT funds has
grown at a compound annual growth rate of nearly 40%, from $1.3 billion
in 1994 to $50 billion in 2005.1 This growth outpaced the overall growth in
sector funds, suggesting that real estate funds may be special among the set of
industry-specific investment vehicles.2
Because almost all of these mutual funds are actively managed, there is an
interest in evaluating how funds perform relative to more passive benchmarks.
Most REIT mutual funds present their performance relative to either the FTSE
NAREIT or the Dow Jones Wilshire indexes, which means that their goal is to
construct a portfolio that is highly correlated with, yet beats, the index. Hence,
at least as a starting point, it makes sense to evaluate how the mutual funds
perform relative to these value-weighted benchmarks. Our null hypothesis is
that the mutual funds do not perform better than these passive benchmarks,
which we test against the alternative that some of the mutual fund managers
have superior information or ability that enables them to generate superior
returns.
Since Roll (1978), researchers have been concerned about the choice of bench-
marks used to evaluate mutual funds. As Roll emphasizes, if inefficient bench-
marks are used, passive portfolios will exhibit evidence of abnormal perfor-
mance, which means that mutual fund managers with no special information
or abilities can exhibit what looks like positive performance using these same
passive strategies. Our analysis of passive REIT portfolios suggests that the
traditional benchmarks were in fact inefficient during our sample period. In
particular, REIT funds could have outperformed the FTSE NAREIT or the
Dow Jones Wilshire indexes by tilting their portfolios toward smaller capital-
ization REITs, REITs that had higher previous returns and retail REITs. Indeed,
a number of REIT mutual funds did follow one or more of these strategies and,
in addition, improved their portfolios by including stocks of homebuilders and
real estate operating companies (REOCs). Hence, to evaluate the extent to
which REIT mutual fund managers have superior selection skills, one needs to
consider alternative benchmarks that correctly account for the return patterns
of these passive portfolios.
1
Note that this total underestimates the total ownership of REITs by real estate–specific
asset managers. For example, mutual fund managers such as Cohen & Steers also
manage separate accounts where they purchase REITs for clients, such as pension funds
and endowments, but these do not enter the mutual fund database.
2
Tiwari and Vijh (2004) find 308 unique, non–real estate sector funds as of 1999, with
a total market value of $151 billion, and this was largely driven by 66 technology funds
that were worth $72 billion at that time.
3. Alternative Benchmarks for Evaluating REIT Mutual Fund Performance 123
Along these lines, we consider three multifactor benchmarks that are composed
of portfolios of REITs. The first benchmark consists of the returns to size,
book-to-market and momentum characteristic-based factor portfolios that are
constructed along the lines of the Fama and French (1993) and Carhart (1997)
factors, but where the factor returns are portfolios of REITs rather than common
stocks. The second benchmark consists of the returns of portfolios sorted by
property type. The third benchmark combines these two and consists of the
returns of a set of 13 statistical factor portfolios formed from a factor analysis
of a large number of REIT portfolios that are formed based on firm size,
book-to-market ratio and property type. In addition to these variables, because
REIT mutual funds sometimes invest in non-REIT real estate companies, we
consider whether an index of homebuilders’ stock returns and two different
REOC indices add explanatory power.
Our analysis indicates that a value-weighted portfolio of all REIT mutual funds
fails to outperform any of our alternative benchmarks net of fees. When we
add back fees, we find only weak evidence of abnormal performance, which
is generally not robust to our additional benchmarks. Although the R 2 of the
single-index model is quite high for this value-weighted mutual fund portfo-
lio, at 0.977, additional factors do add significantly more explanatory power.
Notably, the estimated coefficient on the non-REIT indices are statistically
significant in nearly all specifications, suggesting that controlling for the per-
formance of real estate firms other than REITs is important.
To evaluate the importance of the benchmark choice for individual mutual
funds, we consider two dimensions. We first estimate the R 2 of the regression
of the fund returns on the benchmark portfolios to measure the extent to which
the benchmarks explain the monthly returns of the funds. The general idea
is that benchmark returns that best explain the monthly returns of the mutual
funds probably also provide the most reliable indicator of abnormal return.
This regression is also useful for portfolio attribution because it determines
the extent to which the mutual fund returns can be explained by the different
benchmark portfolios. For each set of benchmark portfolios, we then evaluate
abnormal return as the intercept from the regression of the mutual funds’ excess
return (over the risk-free rate) on the excess returns of the benchmark portfolios.
Several interesting facts emerge from this analysis. First, consistent with the
results on the value-weighted portfolio of all funds, adding indices for returns
to homebuilders and REOCs to any set of benchmark returns increases the
explanatory power of the performance regression for a significant number of
mutual funds, especially those that exhibit low estimated R 2 with the single
REIT index model. The addition of the non-REIT factors generally reduces the
mutual funds’ estimated abnormal performance, suggesting that some funds
4. 124 Hartzell, Muhlhofer and Titman
¨
generate positive abnormal returns relative to the REIT-index benchmarks by
investing in non-REIT stocks.
We also note that the characteristic-based factors and statistical factors appear
to perform better than the property-type factors. The property-type factors
explain less of the variation in returns of the typical fund, are not quite as
good in explaining the left tail of the distribution and produce higher estimated
alphas. Our results suggest that the characteristic and statistical factors benefit
from the fact that they explain return differences between REITs that are due to
a REIT size effect and momentum, which are not accounted for by the single
index and the property-type benchmarks.
Although our analysis suggests that the benchmark choice has only a modest
effect on the measured performance of the value-weighted portfolio of REIT
mutual funds, the performance of individual mutual funds can be much more
sensitive to the benchmark choice. Based on the traditional single-index model,
we find that 6.16% of the mutual funds have a positive alpha net of fees with
p values less than .05 (based on a two-tailed test), versus the 2.5% one would
expect by chance. However, using a benchmark that includes characteristic
factors reduces this percentage by about half, to 3.42%, while using the non-
REIT indices with our characteristic factors, reduces this figure to 0.68%. When
we consider returns before fees, we find that 26.43% of the mutual funds have
positive alphas with p values less than .05, but this falls to 10.71% using the
benchmark that includes characteristic factors plus the non-REIT indices.
To better understand the extent to which different benchmarks generate different
alphas we examine pairwise rank correlations of the alphas from the alternative
benchmark models. We find that 19 of the 28 correlations are less than 0.80,
and the lowest is 0.43. These correlations indicate that the benchmark choice
can have an important effect on how one would rank the different mutual funds.
Indeed, there are examples of mutual funds that have positive and statistically
significant alphas measured relative to the single REIT index benchmark, but
which have negative alphas using a multiple index benchmark. For example,
the CGM Realty Fund has a single-index monthly alpha of 54 basis points
before fees but a monthly alpha based on the index plus characteristic factors
and our non-REIT indices of −35 basis points.
The final issue we examine relates to the predictability of mutual fund perfor-
mance. Specifically, we ask whether there is a relation between fund perfor-
mance and fund characteristics. Using Fama-MacBeth (1973) regressions of
returns on characteristics, we find little evidence that fund characteristics are
systematically related to performance. However, we do find some indication
that the more actively managed funds experienced better performance and that
5. Alternative Benchmarks for Evaluating REIT Mutual Fund Performance 125
expense ratios are negatively related to net-of-fees returns. This latter finding
is inconsistent with funds earning their fees back via superior stock-picking
performance.
Our study is most closely related to the analysis of Kallberg, Liu and Trzcinka
(2000), which studies the performance of 44 REIT mutual funds over the
1986–1998 period. In contrast to our results, they find evidence consistent with
significant average abnormal performance (net of fees), which they attribute
to better performance in down markets.3 The fact that there was abnormal
performance in this earlier period but not in our later time period suggests that
the increase in the number of mutual funds and other institutions investing
in REITs may have diluted average fund performance.4 They also evaluate
several single-index REIT benchmarks and four-factor benchmarks based on
the broader stock market. They find little difference across different REIT
indices and little explanatory power from the factors based on the overall stock
market. They conclude that, “a real estate index is the appropriate benchmark
for evaluating real estate mutual funds” (p. 298). Consistent with our results,
they find that more actively managed funds experienced better performance;
they also find that larger funds have significantly better performance.
Our study is also related to the large literature on mutual fund performance,
which we do not fully review here. The question of whether mutual funds
exhibit abnormal performance and the degree to which abnormal performance
persists has been studied by many, including Jensen (1968, 1969), Brown and
Goetzmann (1995), Gruber (1996) and Carhart (1997). The use of appropriate
benchmarking is central to this question. The broader mutual fund study that
is most directly relevant to ours is Grinblatt and Titman (1994), who conclude
that inference about fund performance can be strongly influenced by the choice
of benchmark.
3
Lin and Yung (2004) also study real estate fund performance, but they conclude that
there is no evidence of average abnormal performance over their 1993–2001 sample.
Like Kallberg, Liu and Trzcinka (2000) they consider broad stock market factors in
addition to a REIT index, and they conclude that the stock market factors do not
materially impact inference about real estate fund performance.
4
We obtain qualitatively similar results to Kallberg, Liu and Trzcinka (2000) when
we estimate the alpha on the value-weighted portfolios of all funds over their earlier
1986–1998 time period. Similar to their results, we find some evidence of a significant
positive abnormal return using the Dow Jones Wilshire REIT index (at the 0.10 level),
but that significance is reduced when we use the FTSE NAREIT All REIT Index. Of
note, our characteristic factors are still significant over that time period, beyond the
FTSE NAREIT index, suggesting that firm size, book-to-market and/or momentum
were important in that period as well and that using the FTSE NAREIT index does not
completely control for these effects.
6. 126 Hartzell, Muhlhofer and Titman
¨
The remainder of the article is organized as follows. The next section describes
our data, including estimates of performance of passive portfolios formed on
firm characteristics. In the subsequent section, we discuss the ways in which we
construct our various alternative benchmarks and present the empirical results
for alternative benchmark models. The next section discusses the relations
between performance and fund characteristics. The final section concludes.
Data
We construct our dataset using the Center for Research in Security Prices
(CRSP) Survivorship-Bias Free U.S. Mutual Fund database. We include all
funds that list their detailed objective as Equity USA Real Estate and collect
monthly returns and fund information for the 1994 through 2005 period. In
several of our tests, we present our results for “unique” funds only. For this
subset, we collapse multiple share classes into one fund.5 We also collect
monthly returns for all U.S. REITs, obtained from CRSP, using securities with
the second share class digit of eight.
Table 1 presents summary statistics for the mutual funds and REITs over our
sample period. The table documents the rapid growth in the REIT mutual fund
industry from 27 funds in 1994 (16 of which are unique) to 123 funds in 1999
(103 unique) to 235 in 2005 (132 unique). Over this period, the number of REITs
actually declines somewhat, from 230 to 208, but the market capitalization of
REITs grows to nearly eight times its starting level, from $45.9 billion in 1994
to $129.4 billion in 1999 to $355 billion in 2005. The market capitalization
of the mutual funds grows even more dramatically (almost 38 times), from
$1.3 billion in 1994 to $7.4 billion in 1999 to almost $50 billion in 2005. As a
result, the fraction of the REIT sector held by REIT-specific mutual funds has
grown over the 11-year period, from about 3% to over 14%.
Single-Index Benchmarks
Our starting point for benchmarking fund returns is the Dow Jones Wilshire
REIT index, which is a value-weighted index of REIT returns. We considered
both the FTSE NAREIT All REIT Index and the Dow Jones Wilshire REIT
index, which were the two most commonly cited benchmarks in a hand-checked
5
The algorithm we use for reducing the set of funds is as follows. We consider funds
of the same family to be duplicates if the R 2 of a regression of one return on the other
is greater than 0.999. If they are duplicates, we first select the class that is present at a
given date if there is only one. Next, we select the retail class based on the CRSP retail
indicator if there is one. Then, we select the lowest-fee fund if there is one. If the funds
are the same along all these dimensions, we randomly break the tie.
7. Alternative Benchmarks for Evaluating REIT Mutual Fund Performance 127
Table 1 Summary of the number and market Capitalization of mutual funds and
REITs.
Number
Number of Unique Fund Number REIT
Year of Funds Funds Market Cap of REITs Market Cap
1994 27 16 1,325 230 45,862
1995 37 37 2,019 231 60,175
1996 54 53 5,710 215 91,069
1997 72 64 11,964 226 138,868
1998 101 90 8,807 228 141,646
1999 123 103 7,436 221 129,404
2000 135 108 11,106 204 145,098
2001 144 107 12,072 197 159,644
2002 134 105 14,974 191 168,193
2003 162 125 25,888 187 235,617
2004 216 128 41,275 204 324,879
2005 235 132 49,967 208 355,046
All market capitalization figures are in millions of U.S. dollars.
Note: This table presents the number of mutual funds that specialize in Equity USA
Real Estate as well as their total market capitalizations at the end of each year of our
sample. Number of Unique Funds represents the number of mutual funds after we join
funds in the same family which seem to hold the same portfolio. As a comparison, we
also present for each year the number of publicly traded REITs and their total market
capitalizations.
subsample of our funds’ annual reports.6 We present results for the Dow Jones
Wilshire REIT index for our analysis because it has the highest explanatory
power with respect to the funds’ returns. We simply call this the “Index” for
expositional ease. To calculate excess returns on either our funds, benchmarks
or REITs, we subtract the 30-day Treasury Bill return, as reported by the St.
Louis Federal Reserve. We later consider multifactor benchmarks that consist of
6
As an example, consider the 2006 annual report for the Morgan Stanley
Real Estate Fund, available at http://sec.gov/Archives/edgar/data/1074111/000110
465907008604/a06-26022 1ncsr.htm. The report notes, “Morgan Stanley Real Estate
Fund outperformed both the FTSE NAREIT Equity REIT Index and the Lipper Real Es-
tate Funds Index for the 12 months ended November 30, 2006, assuming no deduction of
applicable sales charges. The Fund’s outperformance during the period was driven pri-
marily by bottom-up stock selection, and top-down sector allocation was also favorable.
The Fund’s stock selection was especially strong in the mall and office sectors. Within
the mall sector, the Fund benefited from its underweight to two of the weakest malls
stocks relative to the FTSE NAREIT Equity REIT Index, which had company-specific
issues.” As suggested by this quotation, we considered the FTSE NAREIT Equity REIT
Index, but we present results using the FTSE NAREIT All REIT Index. Many of the
funds we examine were allowed to invest in mortgage REITs as well as equity REITs,
so we use the broader benchmark.
8. 128 Hartzell, Muhlhofer and Titman
¨
portfolios that are formed based on property types, REIT size, book-to-market
and momentum characteristics.
The Performance of Passive Portfolios
Before examining REIT mutual funds we examine whether a variety of passive
REIT and non-REIT real estate firm portfolios generate abnormal performance
relative to the REIT Index.7 If so, then an active portfolio that has exposure to
the passive factors that generate excess returns will also generate alpha with
respect to a single-index model.
To assess the performance of these passive strategies, we estimate the perfor-
mance of REIT portfolios that are formed based on the market capitalization,
the book-to-market ratio, momentum and the property types of the REITs.
Specifically, we form five size and five book-to-market portfolios by sorting
the REITs into the appropriate quintiles. We form three momentum portfolios
by sorting REITs based on their prior 12-month return lagged 1 month. We
also construct passive property type portfolios based on the five main REIT
property types (Hotel, Industrial, Office, Residential and Retail). Finally, we
include portfolios of homebuilders and REOCs, where REOCs are split into
hotels and all other firms. This is motivated by the observation that the average
fund in our sample has almost 20% of its portfolio invested in non-REIT stocks,
based on CRSP share-class codes.8 For the homebuilder portfolio, we calculate
the value-weighted monthly returns for all firms on CRSP in SIC code 1531
(Operative Builders). The REOC portfolios consist of the SNL REOC-Hotel
and REOC-Other indices.
For each of these portfolios, we calculate the value-weighted monthly returns
in excess of the risk-free rate and regress these excess returns on the excess
returns on the Index. The results of these 21 regressions are reported in Table 2.
As the table shows, we find strong evidence of a size effect in our sample.
Relative to the Dow Jones Wilshire benchmark, the smallest quintile portfolio
has a significant positive alpha (of 82 basis points) while the largest quintile
portfolio has a significant negative alpha (of −13 basis points). This implies
that, by overweighting smaller REITs, a fund manager could have generated a
positive alpha with respect to a single-index benchmark over our 11-year period.
The estimated alphas of the momentum portfolios indicate that a fund manager
could also have outperformed the single-index benchmark by investing in the
7
The non-REIT real estate firm portfolios consist of homebuilders and REOCs.
8
The most common non-REIT investments, based on four-digit SIC codes, are operators
of nonresidential buildings (SIC code 6512), land subdividers and developers (6552),
operative builders (1531) and hotels and motels (7011).
9. Alternative Benchmarks for Evaluating REIT Mutual Fund Performance 129
Table 2 R 2 , alphas and t statistics for passive portfolios formed using individual
factors.
R2 alpha t statistic beta
Size.1 0.1692 0.0082 3.3331∗∗∗ 0.3059
Size.2 0.4850 0.0039 1.6155 0.6459
Size.3 0.7160 0.0018 0.9573 0.8168
Size.4 0.8672 0.0015 1.1639 0.8831
Size.5 0.9736 −0.0013 −2.2043∗ 1.0157
BE.ME.1 0.8862 −0.0002 −0.1255 0.9587
BE.ME.2 0.9252 −0.0007 −0.6836 0.9866
BE.ME.3 0.8810 0.0001 0.0966 0.9024
BE.ME.4 0.6528 −0.0007 −0.2888 0.8851
BE.ME.5 0.4806 0.0039 1.3282 0.7873
Momentum.1 0.7444 −0.0027 −1.4508 0.8903
Momentum.2 0.9404 0.0008 0.9658 0.9041
Momentum.3 0.8706 0.0022 1.6841◦ 0.9331
Homebuilders 0.2186 0.0145 2.7079∗∗ 0.7806
REOC.Hotel 0.2042 −0.0015 −0.2815 0.7600
REOC.Other 0.3705 0.0060 1.8748◦ 0.6868
Hotel 0.4636 −0.0041 −0.9139 1.1441
Industrial 0.8447 0.0022 1.4554 0.9590
Office 0.8751 0.0006 0.4104 1.0058
Residential 0.8601 0.0008 0.5903 0.8929
Retail 0.8332 0.0026 1.8049◦ 0.9020
◦
p < 10%; ∗ p < 5%; ∗∗ p < 1%; ∗∗∗ p < 0.1%.
Note: This table presents R 2 , alphas, t statistics of alphas and betas from a set of
univariate regressions of each individual factor on the index. The factors used are size
quintile portfolios of REITs (numbered from smallest to largest), book-to-market ratio
quintile portfolios of REITs (numbered the same way), momentum tercile portfolios of
REITs (numbered analogously), the portfolio of homebuilders, the SNL REOC Hotel
index, the SNL REOC Other index and the individual property-type portfolios.
REITs that exhibited the strongest previous performance, although the effect is
economically and statistically weaker than the size effect.9
In addition, we find positive abnormal returns for three types of real estate firms.
Within the REIT sector, retail REITs outperformed the Index, with an alpha
of 26 basis points per month but weaker statistical significance. Our index of
homebuilders also exhibited strong, significant performance, at 145 basis points
per month, while our REOC Other portfolio exhibited monthly outperformance
of 60 basis points with a weaker significance level. Both of these portfolios
9
Overall, the momentum pattern appears consistent with the finding of intra-industry
momentum in REITs, documented by Chui, Titman and Wei (2003).
10. 130 Hartzell, Muhlhofer and Titman
¨
have a low R 2 with respect to the index at 0.22 and 0.37, respectively (the only
lower one among this set is the smallest set of REITs, at 0.17).
Evaluating REIT Mutual Fund Benchmarks
The message from Table 2 is that simple passive investment strategies exhibit
significant abnormal returns with respect to the single-index benchmark over
our sample period. This calls for investigating multidimensional benchmarks,
which we do in our subsequent tests.
Characteristic Factors
Our first set of candidate benchmarks consists of REIT-based versions of the
size and book-to-market factors of Fama and French (1993) and the momentum
factor as in Carhart (1997). To construct these, we sort firms into terciles based
on both size (market capitalization) and book-to-market ratio. We then compute
BE/ME as the value-weighted return to the high book-to-market tercile, less the
value-weighted return to the low book-to-market tercile. Size and Momentum
are defined analogously, as the value-weighted returns to the smallest or highest-
return firms’ tercile, respectively, less the value-weighted returns to the largest-
or lowest-return firms’ tercile.
We believe that using REITs to construct characteristic-based factors rather
than factors from the broader stock market has advantages. To the extent that
the returns on passive REIT-specific portfolios do not move with the returns
of similar portfolios from the broader market, then our REIT-based charac-
teristic factors will provide better benchmarks that control for returns to such
passive strategies. In addition, if the correlation between the REIT market
and the broader stock market is time varying, using the broad market port-
folios is likely to result in less precise estimates of abnormal performance.
Consistent with potentially important industry effects, Chui, Titman and Wei
(2003) find empirical evidence that the REIT market exhibits intra-industry
momentum. It is worth noting that our approach differs from that used previ-
ously in studies examining real estate funds’ returns, such as Kallberg, Liu and
Trzcinka (2000) and Lin and Yung (2004), which use the standard Fama-French
factors for the overall U.S. stock market (which are constructed excluding
REITs).10
10
We also examined using Fama-French factors (including momentum) from the overall
stock market instead of our REIT-based factors, but they do not improve the explanatory
power of our tests.
11. Alternative Benchmarks for Evaluating REIT Mutual Fund Performance 131
Property-Type Factors
Our next set of candidate benchmark returns consists of returns to property-type
portfolios. To construct these, we use the SNL classification of each REIT’s
type to form portfolios of five different property types: Hotel, Industrial, Office,
Residential and Retail. For each property type, we calculate monthly value-
weighted returns over the sample period and then subtract the REIT Index
return in each month.11
Statistical Factor Analysis Portfolios
In order to construct statistical factor analysis portfolios, we need a balanced
panel of REIT portfolio returns. To construct such a panel we form portfolios
based on REIT property types, their market capitalizations and their book-to-
market ratios. Specifically, we assign REITs into one of five property types:
Industrial, Office, Residential, Retail and Other (all other types) and split each
property type sample into terciles by market capitalization and by book-to-
market ratio. We then take the REITs in each of the 45 groups (five property
types, each divided into three size groups, then further divided into three book-
to-market groups) and form 45 value-weighted portfolios. From the returns of
these portfolios we subtract the return on the REIT Index and then estimate via
maximum likelihood a set of 13 statistical factors. This is the smallest number
of factors for which we cannot reject the null that the number of factors is
sufficient to explain the variation in the data. Table 3 presents these results in
the form of factor loadings for each of the 45 portfolios for the nine factors. For
the remainder of the analysis, we use the returns to these 13 statistical factor
portfolios as candidate benchmark returns for REIT funds.
As the table shows, the first factor explains 7% of the variation in the data.
The cumulative fraction explained by the first five factors is 30.8%, and this
reaches 52% by the 13th factor. Thus, even starting with a set of 45 portfolios
rather than individual REITs, a relatively large number of factors is required
to explain most of the variation in REIT returns, consistent with differences in
returns due to firm size, property types and book-to-market, rather than simply
a common U.S. real estate factor. Unfortunately, the loadings themselves do
not reveal any obvious patterns.
11
While we use SNL’s classification of each REIT’s property focus, one could imagine
using data on specific property holdings to generate more precise estimates, as in
Geltner and Kluger (1998). We explored using a finer partition of REITs’ property
types based on 12 categories from the SNL REIT database: Diversified, Health Care,
Hotel, Industrial, Manufactured Housing, Multifamily, Office, Regional Mall, Shopping
Center, Retail (Other), Self Storage and Specialty. Using these more detailed categories
does not noticeably increase the explanatory power in our tests, so we present the more
parsimonious grouping.
13. Table 3 continued
Factor1 Factor2 Factor3 Factor4 Factor5 Factor6 Factor7 Factor8 Factor9 Factor10 Factor11 Factor12 Factor13
Residential.big.high −0.0484 −0.0555 0.1771 −0.0551 0.0766 −0.0162 −0.5937 0.0254 −0.0286 −0.0306 −0.0463 0.0389 0.0256
Residential.big.low −0.1288 0.0360 0.1834 −0.1788 −0.4637 0.0081 −0.2380 −0.1650 0.0390 −0.0370 −0.0545 −0.0151 0.1222
Residential.big.med −0.2953 0.1056 0.0351 −0.0620 −0.1862 0.3052 −0.5318 −0.0959 0.0609 −0.0774 0.1779 −0.0749 −0.1182
Residential.mid.high 0.1993 0.0350 0.6330 0.0542 −0.0589 −0.0068 −0.1743 0.1397 −0.0744 −0.0020 −0.0757 0.1524 −0.0383
Residential.mid.low 0.0582 −0.0322 0.3132 −0.0711 −0.0388 0.0904 −0.0468 0.3259 0.0825 −0.0981 0.1760 −0.0693 0.3262
Residential.mid.med 0.2452 0.0257 0.3729 0.0691 −0.1507 −0.1119 −0.1062 0.3087 0.1729 −0.0522 0.0135 0.2191 0.3441
Residential.small.high 0.2448 0.0127 0.2550 0.2813 0.0304 −0.0177 0.0175 −0.0214 0.0817 0.0445 0.7742 0.1348 0.0326
Residential.small.low 0.1227 0.0925 0.4686 0.1100 0.0455 −0.0299 0.1282 0.2714 0.0496 −0.0345 0.0553 0.2680 0.3083
Residential.small.med 0.2318 0.0367 0.5617 0.1138 −0.0227 −0.0652 0.1248 −0.1036 −0.0313 0.0754 0.1864 −0.1414 −0.0521
Retail.big.high 0.4253 0.0199 −0.0198 −0.0634 0.0484 0.0027 0.1420 −0.0323 0.4893 −0.1846 0.0917 0.0695 0.0129
Retail.big.low 0.2868 −0.1328 −0.0406 −0.0386 0.2944 −0.1666 0.2229 −0.1423 0.4228 −0.0410 −0.1271 0.1031 −0.2370
Retail.big.med 0.0827 −0.0600 −0.0487 −0.2729 0.4991 0.1046 0.2077 −0.2471 0.3504 −0.1684 −0.0630 −0.3010 0.0067
Retail.mid.high 0.5077 0.0436 0.2364 0.0787 0.1603 0.0164 0.0433 −0.0008 0.0083 −0.1653 −0.0171 −0.1281 0.0614
Retail.mid.low 0.7085 0.0736 −0.0646 0.1615 −0.0203 0.1220 0.0700 0.0746 0.0053 0.0850 0.0102 −0.0149 −0.2297
Retail.mid.med 0.2976 −0.0781 0.1797 0.1261 0.4320 0.1235 0.2533 0.0548 0.1356 −0.1509 0.0590 −0.0076 −0.0214
Retail.small.high 0.3181 −0.0054 0.1828 0.1636 0.0635 0.1212 −0.0734 0.1648 0.0518 −0.0090 0.0464 0.0129 0.0816
Retail.small.low 0.5188 0.0883 0.1898 0.2221 0.0125 0.0535 0.0377 0.0335 0.1911 0.0417 0.0079 0.0852 0.1611
Retail.small.med 0.5902 0.1129 0.1311 −0.0344 0.0162 −0.0860 0.0490 −0.0072 −0.1359 −0.0266 0.2259 0.0303 0.0064
Cumulative Fraction of 0.070 0.133 0.183 0.226 0.268 0.308 0.349 0.386 0.417 0.445 0.471 0.496 0.520
Variance
χ 2 statistic that 13 factors are sufficient: 506.85 on 483 degrees of freedom. The p-value is 0.219. Number of time-series observations: 144.
Note: This table presents factor loadings for statistical factors computed on portfolios of REITs, sorted simultaneously by property
type, size and book-to-market ratio. The first part of each portfolio name refers to property type, the second to size and the third to
book-to-market. At the bottom of the table, we indicate for each factor N the cumulative proportion of the variance explained by all factors
n ≤ N , as well as the value of a χ 2 test statistic that the 13 factors presented here are sufficient in explaining the systematic variance of the system.
Alternative Benchmarks for Evaluating REIT Mutual Fund Performance 133
14. 134 Hartzell, Muhlhofer and Titman
¨
Non-REIT Real Estate Firm Factors
For our final set of candidate benchmark returns, we use a portfolio of home-
builder stocks as well as the SNL REOC-Hotel and REOC-Other indices. For
the homebuilder factor, we calculate the value-weighted monthly returns for all
firms on CRSP in SIC code 1531 (Operative Builders) and subtract the REIT
Index return, which we then label Homebuilders. We similarly construct excess
returns on the two SNL REOC indices. We consider multifactor benchmarks
that include these non-REIT real estate firm factor portfolios along with the
other benchmark portfolios described above.
Using Alternative Benchmarks to Explain Individual REIT Returns
We begin by investigating the degree to which our alternative benchmarks
can explain the returns to individual REITs. Table 4 reports regressions of
monthly excess returns for individual REITs on the excess returns of the REIT
Index, and various factor models. In this table, and in subsequent tables with
individual mutual fund returns, we require a minimum of 24 months of returns
for a REIT (or fund) to be included. The results are consistent with the factor
analysis in the sense that individual REITs exhibit a large degree of idiosyncratic
variation. For the mean (median) firm, the Index alone explains only 20% (16%)
of the variation. Among the alternative additional benchmarks, the statistical
factors appear to add the most explanatory power; the mean and median R 2
for these factors is about 0.31. Even though our focus is not on the alphas of
individual REITs, it is interesting to note that the typical alphas generated by
the single-index models are larger than those calculated by the other models.
As we show further, this difference in estimated alphas also appears at the
mutual fund level. It is also worth noting that the addition of the non-REIT
factors to any particular model has a very small effect. This implies that any
significant correlation between the funds’ returns and the non-REIT factors
is likely to be due to funds investing beyond the REIT universe, rather than
non-REIT factors that are capturing some portion of returns within the REIT
universe.
Using Alternative Benchmarks to Explain Returns to the REIT Fund Sector
We now turn to the question of how well our alternative benchmarks explain
the returns of REIT mutual funds. To do this, we run regressions of the monthly
excess return on a value-weighted portfolio of all funds on our various single-
index and multiple-factor benchmarks. In Table 5 we calculate the average
return using the actual returns investors in the funds experienced (i.e., net of
fees), while in Table 6 we use returns before fees (i.e., we add them back to the
net returns).
15. Alternative Benchmarks for Evaluating REIT Mutual Fund Performance 135
Table 4 Adjusted R 2 , alphas and t statistics of alphas for REITs.
Figure Mean 10% 25% Median 75% 90%
Index Only
Adj. R 2 0.205286 −0.009296 0.025764 0.163032 0.354748 0.508471
Alpha 0.003892 −0.005596 0.000099 0.003679 0.007853 0.013519
t-stats. 0.605821 −0.630753 0.007579 0.656272 1.226306 1.796753
σα = 0.01318 % of positive (negative) alphas with p-values ≤ 0.05: 5.99% (0.63%)
Index + Non-REITs
Adj. R 2 0.219372 −0.007952 0.055655 0.184169 0.380193 0.529596
Alpha 0.003042 −0.008570 −0.001240 0.003587 0.007330 0.018238
t-stats. 0.459048 −0.826161 −0.199398 0.546418 1.114478 1.616308
σα = 0.01863 % of positive (negative) alphas with p-values ≤ 0.05: 4.73% (1.89%)
Index + Characteristic Factors
Adj. R 2 0.255519 0.012140 0.088473 0.245762 0.397426 0.525401
Alpha 0.000733 −0.009547 −0.002505 0.001885 0.005466 0.010083
t stats. 0.272260 −1.013447 −0.313914 0.302344 0.935435 1.497886
σα = 0.01415 % of positive (negative) alphas with p-values ≤ 0.05: 3.79% (1.26%)
Index + Characteristic Factors + Non-REITs
Adj. R 2 0.264575 0.004568 0.090946 0.259260 0.425224 0.551070
Alpha 0.000428 −0.010889 −0.003340 0.002087 0.006173 0.010353
t-stats. 0.236111 −1.025679 −0.378285 0.318496 0.907758 1.404608
σα = 0.03054 % of positive (negative) alphas with p-values ≤ 0.05: 2.52% (2.52%)
Index + Property Type Factors
Adj. R 2 0.247604 −0.030007 0.056630 0.204076 0.417073 0.573246
Alpha 0.003438 −0.008460 −0.001448 0.002158 0.006847 0.014118
t-stats. 0.371435 −0.737833 −0.297614 0.331761 1.001710 1.681147
σα = 0.01790 % of positive (negative) alphas with p-values ≤ 0.05: 4.10% (2.21%)
Index + Property Type Factors + Non-REITs
Adj. R 2 0.259766 −0.027602 0.087067 0.227497 0.440277 0.600271
Alpha 0.001300 −0.010275 −0.002881 0.002163 0.007695 0.017625
t-stats. 0.273139 −0.980853 −0.354278 0.282841 0.976070 1.607282
σα = 0.02521 % of positive (negative) alphas with p-values ≤ 0.05: 4.42% (2.52%)
Index + Statistical Factors
Adj. R 2 0.308226 −0.006205 0.144116 0.311309 0.495487 0.609606
Alpha 0.002145 −0.007906 −0.001820 0.002226 0.006482 0.013542
t-stats. 0.377583 −0.827453 −0.258906 0.371270 0.991320 1.615394
σα = 0.01356 % of positive (negative) alphas with p-values ≤ 0.05: 3.47% (0.63%)
Index + Statistical Factors + Non-REITs
Adj. R 2 0.322178 0.010614 0.152056 0.333381 0.527623 0.644440
Alpha −0.000294 −0.012021 −0.003354 0.001835 0.006761 0.017270
t-stats. 0.263723 −1.049106 −0.345796 0.312508 0.961192 1.457640
σα = 0.07967 % of positive (negative) alphas with p-values ≤ 0.05: 8.83% (6.94%)
Number of firms: 317.
Note: This table presents means, 10th percentiles, 25th percentiles, medians, 75th percentiles and 90th
percentiles of the distributions of adjusted R 2 , alphas and t statistics of alphas, for excess returns to
individual REITs with respect to a variety of explanatory variables, as well as the standard deviation of
the alphas and the percentage of firms that realize alphas that are significant at the 5% level (two-tailed
test). The explanatory variables consist of the excess returns to the Dow-Jones Wilshire index, a
four-factor model of the index plus three firm-characteristic factors, namely a book-to-market factor, a
size factor and a momentum factor, all computed using only REITs, a six-factor model of the index and
five property-type portfolios and a 14-factor model of the index augmented by the 13 statistical factors
from the triple-sorted portfolios presented in Table 3. Each model in turn is also augmented by the index
of homebuilders plus the two SNL REOC Indices. We term these three additional factors Non-REITs.
16. Table 5 Results from value-weighted portfolio regressions, net of fees.
Model 1 Model 2 Model 3 Model 4 Model 5 Model 6 Model 7 Model 8 Model 9
(Intercept) −0.00009 0.00029 −0.00083 −0.00048 −0.00113 0.00007 −0.00071 −0.00011 −0.00111
(−0.18773) (0.46882) (−2.01994)∗ (−0.96626) (−2.76863)∗∗ (0.14290) (−1.64983) (−0.22381) (−2.79102)∗∗
Index 0.92594 0.96374 0.85533 0.95045 0.86626 0.91432 0.84751 0.92787 0.86889
(77.53735)∗∗∗ (59.35927)∗∗∗ (68.22403)∗∗∗ (64.16109)∗∗∗ (54.58236)∗∗∗ (68.06812)∗∗∗ (54.99726)∗∗∗ (51.34514)∗∗∗ (53.68413)∗∗∗
¨
BE/ME 0.03866 −0.02678
◦
(1.78618) (−1.38045)
Size 0.03646 0.04161
(1.77314)◦ (2.55524)∗
Momentum 0.01266 0.04010
(0.73179) (2.75716)∗∗
Hotel 0.03777 −0.00314
(3.61800)∗∗∗ (−0.20251)
136 Hartzell, Muhlhofer and Titman
Industrial 0.00457 0.02223
(0.17268) (0.92721)
Office 0.04793 0.02693
(1.25929) (0.75884)
Residential −0.03566 −0.06369
(−0.86161) (−1.74794)◦
Retail −0.03656 −0.04038
(−0.80362) (−1.00665)
Factor1 0.00056 0.00083
(1.00941) (1.72232)◦
Factor2 −0.00027 −0.00123
(−0.56554) (−1.35668)
Factor3 −0.00024 0.00088
(−0.33332) (1.51331)
Factor4 0.00143 −0.00049
(2.62636)∗∗ (−0.97733)
Factor5 −0.00065 −0.00010
(−1.26575) (−0.14899)
Factor6 0.00035 −0.00046
(0.70340) (−0.77194)
Factor7 0.00054 0.00078
(1.01074) (1.70876)◦
17. Table 5 continued
Model 1 Model 2 Model 3 Model 4 Model 5 Model 6 Model 7 Model 8 Model 9
Factor8 0.00083 0.00179
(1.57909) (3.49804)∗∗∗
Factor9 −0.00118 −0.00066
(−2.14878)∗ (−1.37078)
Factor10 0.00022 0.00052
(0.46910) (1.36065)
Factor11 0.00012 0.00046
(0.22063) (0.92652)
Factor12 0.00071 0.00225
(1.27930) (3.86619)∗∗∗
Factor13 0.00081 0.00037
(1.46212) (0.60916)
Homebuilders 0.02809 0.02802 0.02781 0.03010
(4.09104)∗∗∗ (4.14567)∗∗∗ (4.04054)∗∗∗ (4.41363)∗∗∗
REOC Hotel 0.02785 0.03849 0.03010 0.03487
(4.04277)∗∗∗ (5.02630)∗∗∗ (2.47742)∗ (4.34051)∗∗∗
REOC Other 0.04155 0.03349 0.03585 0.03445
(3.72475)∗∗∗ (2.98070)∗∗ (3.19457)∗∗ (3.11310)∗∗
R2 0.9768 0.9610 0.9866 0.9779 0.9876 0.9799 0.9872 0.9786 0.9888
Total Model F 6012 3524 2419 1582 1486 1163 1121 467.3 678.9
F 3.4004∗ 4.1290∗∗ 5.4354∗∗∗ 2.0548◦ 1.9170∗ 2.846∗∗
◦
p < 10%; ∗ p < 5%; ∗∗ p < 1%; ∗∗∗ p < 0.1%. Time-series observations: 144.
Note: This table presents results from regressions of excess returns to a value-weighted portfolio of all REIT mutual funds on a variety of
factor models. These are the excess returns to the Dow-Jones Wilshire index, a four-factor model of the index plus three firm-characteristic
factors (namely a book-to-market factor, a size factor and a momentum factor, all computed using only REITs), a six-factor model
of the index and five property-type portfolios and a 14-factor model of the index augmented by the 13 statistical factors from the
triple-sorted portfolios presented in Table 3. Each model in turn is also augmented by the three non-REIT indices. For Model 2 only, the
index used is the FTSE NAREIT All REIT Index; all other models use the Dow Jones Wilshire REIT Index. All mutual fund returns
are net of expenses. The second F-statistic at the bottom of the table is the result of a joint hypothesis test that all coefficients included
in a model, outside of the intercept, the index and (if included) the coefficients for the non-REIT indices are equal to 0. (t-statistics in parentheses).
Alternative Benchmarks for Evaluating REIT Mutual Fund Performance 137
19. Table 6 continued
Model 1 Model 2 Model 3 Model 4 Model 5 Model 6 Model 7 Model 8 Model 9
Factor8 −0.00028 0.00174
(−0.46824) (3.11835)∗∗
Factor9 −0.00154 −0.00068
(−2.52845)∗ (−1.28930)
Factor10 −0.00044 0.00042
(−0.84246) (1.01143)
Factor11 0.00027 0.00055
(0.42980) (1.01211)
Factor12 0.00034 0.00302
(0.54275) (4.76725)∗∗∗
Factor13 0.00093 0.00035
(1.49732) (0.52528)
Homebuilders 0.02778 0.02856 0.02784 0.03211
(3.60307)∗∗∗ (3.77472)∗∗∗ (3.58736)∗∗∗ (4.31889)∗∗∗
REOC Hotel 0.02128 0.03399 0.01902 0.02816
(2.75064)∗∗ (3.96607)∗∗∗ (1.38856) (3.21559)∗∗
REOC Other 0.03907 0.03045 0.03268 0.03192
(3.11885)∗∗ (2.42117)∗ (2.58338)∗∗ (2.64555)∗∗
R2 0.9740 0.9498 0.9832 0.9742 0.9845 0.9759 0.9838 0.9742 0.9867
Total Model F 5349 2708 1922 1353 1189 964.5 883.7 386.7 573.1
F 1.506 4.4229∗∗ 3.242∗∗ 1.8471 1.1039 3.5528∗∗∗
◦
p < 10%; ∗ p < 5%; ∗∗ p < 1%; ∗∗∗ p < 0.1%. Time-series observations: 144.
Note: This table presents results from regressions of excess returns to a value-weighted portfolio of all REIT mutual funds on a variety of
factor models. These are the excess returns to the Dow-Jones Wilshire index, a four-factor model of the index plus three firm-characteristic
factors (namely a book-to-market factor, a size factor and a momentum factor, all computed using only REITs), a six-factor model
of the index and five property-type portfolios and a 14-factor model of the index augmented by the 13 statistical factors from the
triple-sorted portfolios presented in Table 3. Each model in turn is also augmented by the three non-REIT indices. For Model 2 only, the
index used is the FTSE NAREIT All REIT Index; all other models use the Dow Jones Wilshire REIT Index. All mutual fund returns
are before expenses. The second F-statistic at the bottom of the table is the result of a joint hypothesis test that all coefficients included
in a model, outside of the intercept, the index and (if included) the coefficients for the non-REIT indices are equal to 0. (t-statistics in parentheses).
Alternative Benchmarks for Evaluating REIT Mutual Fund Performance 139
20. 140 Hartzell, Muhlhofer and Titman
¨
Model 1 in Table 5 presents the results for a regression using only the Dow
Jones Wilshire REIT Index. These results indicate that the single-factor REIT
Index model explains a great deal of the variation in the value-weighted funds’
returns; the R 2 in the regression is 0.977. By way of comparison, Model 2
presents the results for a similar regression using the FTSE NAREIT index
as the single index. This model has a slightly lower R 2 of about 0.961, so
we focus on the Dow Jones Wilshire REIT Index for the remainder of the
analysis. The point estimate of the alpha in this single-index model is very
small at −0.9 basis points per month (for the Dow Jones Wilshire Index) and
is insignificantly different from zero.12 This is in contrast to the results of
Kallberg, Liu and Trzcinka (2000) who find positive abnormal returns for the
average REIT fund in their sample.13 This appears to be sample specific; if
we run this same regression over their sample period (1986–1998), we find
some evidence of abnormal performance (at the .10 level using two-tailed
tests) consistent with their results.14 Kallberg, Liu and Trzcinka (2000) argue
that the positive abnormal performance may be due to an informational ad-
vantage possessed by REIT fund managers. The insignificant results in the
recent time period after the explosive growth in funds is consistent with this
advantage being reduced over time and with the dilution of the average advan-
tage due to the entry of new managers who may be less skilled in evaluating
REITs.
In Model 3, we add our non-REIT factors (Homebuilders, REOC Hotel and
REOC Other) to our base model. As the results indicate, returns to non-REIT
real estate firms have significant incremental explanatory power. The adjusted
12
This is inconsistent with the results of Lin and Yung (2004), who find a significant
alpha of −46 basis points using a value-weighted average of real estate mutual funds
over the 1997–2001 period. They use the FTSE NAREIT index and find a lower R 2 than
ours, at 0.90 versus our 0.98. They also find no additional explanatory power beyond
the FTSE NAREIT index for broad stock-market based Fama-French and momentum
factors. This suggests that their results may be sample- or benchmark-specific.
13
Our work is also related to previous studies of the performance of institutionally
managed real estate investments other than mutual funds, such as commingled real estate
funds (CREFs). For recent evidence of positive abnormal performance in a sample of
CREFs, see Gallo, Lockwood and Rodriguez (2006). They use a single-index model to
explain CREF returns, where the index is based on property-level returns, but they also
investigate the addition of regional or property-type indexes and find similar results. For
prior evidence on CREF performance, see Myer, Webb and He (1997) and Myer and
Webb (1993).
14
Consistent with Kallberg, Liu and Trzcinka (2000), we find lower, insignificant alphas
when we use the FTSE NAREIT index instead of the Dow Jones Wilshire Index. It is
worth noting, however, that our characteristic factors are still statistically significant in
their time period using FTSE NAREIT as the market index, even though FTSE NAREIT
includes smaller REITs than the Dow Jones Wilshire Index.
21. Alternative Benchmarks for Evaluating REIT Mutual Fund Performance 141
R 2 in the regression increases to 0.987, and the t statistics on the three non-
REIT factors are very significant at 4.09, 4.04 and 3.72, respectively, which is
consistent with REIT fund managers investing in some non-REIT real estate
stocks. This is a consistent theme throughout the table—no matter what set of
REIT-based benchmarks is used, the non-REIT factors are still significant and
their inclusion increases the model’s adjusted R 2 .
In Models 4, 6 and 8 we successively consider adding our characteristic factors,
property-type factors and statistical factors to the single index. Models 5, 7 and
9 present identical specifications, respectively, except for the addition of the
non-REIT factors. The property-type regressions offer the highest adjusted R 2
(0.980 without the non-REITs), although all of the alternatives improve the
explanatory power relative to the single-index model (adjusted R 2 of 0.978 for
the characteristic factors and 0.979 for the statistical factors, respectively). F
statistics for tests of the joint hypothesis that all of the coefficients except for
that on the Index (and those of non-REITs, if included) are zero, are also the
highest for the property type factors, although they are also significant in the
statistical-factor and characteristic-factor regressions. Across models, there is
no evidence of significant positive abnormal performance. The only significant
alphas are in Models 3, 5 and 9, and their estimates are −8, −11 and −11 basis
points per month, respectively.
In Table 6, we present results from identical specifications, except we use the
value-weighted excess return on all of the funds before fees (i.e., we add back
fees to the CRSP returns by adding one-twelfth of the annual expense ratio
to each month’s return). As one would expect, the explanatory power of the
various models is virtually unchanged. Of more interest is the estimated abnor-
mal performance across different specifications. We find weakly significantly
positive abnormal performance in specifications using the single indexes (Dow
Jones Wilshire or FTSE NAREIT), statistical factors and property-type factors.
The magnitude of this performance is plausible, at around 10 basis points per
month (about 1.2% per year), for all these models. However, the estimated
abnormal performance is reduced in every alternative by the addition of the
non-REIT factors; the estimated alpha is not signficant in any model where they
are included. In addition, the alpha is insignificant in the characteristic-factor
model, although the point estimate is not very different from the single-index
model (6 basis points versus 10 basis points per month). Taken together, the
results suggest that the average REIT fund exhibits some abnormal perfor-
mance but that the performance is offset by expenses. They are also consistent
with the results of Table 2, which suggest that fund managers add alpha in this
sample by overweighting smaller REITs, betting on momentum and/or buying
non-REIT stocks.
22. 142 Hartzell, Muhlhofer and Titman
¨
Using Alternative Benchmarks to Explain Individual REIT Fund Returns
While these results suggest that additional factors beyond a single index can
more precisely estimate abnormal performance for the group of REIT funds
as a whole, our ultimate question is whether these alternative benchmarks
provide better assessments of the performance of individual funds. To address
this, we run separate time-series regressions of each fund’s excess monthly
returns on the same alternatives as before (the single index, plus characteristic
factors, property-type factors and statistical factors, with and without non-REIT
factors). In Table 7, for each of these alternatives, we summarize the distribution
of three key statistics across the sample of funds: the adjusted R 2 , alpha and
the t statistic for the alpha. We also present additional statistics regarding
the distribution of alphas: the cross-sectional standard deviation of estimated
alphas and the percentage of alphas that are significantly positive and negative.
For these significance calculations, we tabulate the fraction of alphas with
p values that are less than or equal to .05, separated by whether they are positive
or negative. Note that because these p values are based on two-sided tests,
random chance would predict that 2.5% of alphas are significantly positive,
with another 2.5% significantly negative.
First, as one can see from the table, the benchmarks do a very good job of
explaining the variation in returns of the typical fund. The single-index model
produces a mean (median) R 2 of 0.903 (0.955). By way of comparison, in their
1986–1998 sample, Kallberg, Liu and Trzcinka (2000) find a mean (median)
R 2 of 0.851 (0.91) with respect to the Wilshire REIT index. This suggests that
typical REIT funds more closely track this index than they did previously.
Benchmarks that more accurately explain monthly returns produce more pre-
cise estimates of fund performance. In addition to considering the improved
explanatory power for a typical fund, we also consider whether the additional
factors increase the R 2 of the funds for which the single-index model performs
most poorly. In the middle of the distribution, the results are consistent with
what we found for the value-weighted index of all funds. We find that all of
the multiple-factor models improve explanatory power beyond the single in-
dex; median and mean R 2 are higher in all of these alternatives. Based solely
on this criterion, the statistical factors with non-REITs offer the highest mean
and median adjusted R 2 (0.942 and 0.968, respectively). The addition of non-
REITs also improves explanatory power for the typical fund. For explaining
the left-tail outliers, the statistical factor model with non-REITs again offers
the biggest improvement, with a 10th-percentile adjusted R 2 of 0.855 versus
0.745 for the single-index model.
In addition to improvements in R 2 , we also care about estimated alphas and
their statistical significance. The mean (median) monthly alpha using the
23. Alternative Benchmarks for Evaluating REIT Mutual Fund Performance 143
Table 7 Adjusted R 2 , alphas and t statistics of alphas for REIT mutual funds, net of
fees.
Figure Mean 10% 25% Median 75% 90%
Index Only
Adj. R 2 0.902632 0.744769 0.900920 0.955183 0.975847 0.986345
alpha −0.000012 −0.001773 −0.001190 −0.000001 0.000919 0.002078
t-stats. −0.125239 −1.973508 −1.043690 −0.001036 0.850925 1.522797
σα = 0.00182 % of positive (negative) alphas with p-values ≤ 0.05: 6.16% (10.27%)
Index + Non-REITs
Adj. R 2 0.923187 0.801115 0.911647 0.961110 0.977601 0.988957
alpha −0.000938 −0.002736 −0.001675 −0.000765 0.000149 0.000992
t-stats. −0.746104 −2.285342 −1.603998 −0.785300 0.153755 1.053756
σα = 0.00186 % of positive (negative) alphas with p-values ≤ 0.05: 2.05% (17.81%)
Index + Characteristic Factors
Adj. R 2 0.921101 0.812081 0.919287 0.957900 0.978707 0.988341
alpha −0.000678 −0.002470 −0.001619 −0.000609 0.000361 0.001260
t-stats. −0.613470 −2.544744 −1.355562 −0.586654 0.391480 1.124304
σα = 0.00174 % of positive (negative) alphas with p-values ≤ 0.05: 3.42% (13.7%)
Index + Characteristic Factors + Non-REITs
Adj. R 2 0.935528 0.840042 0.926273 0.963473 0.981448 0.990525
alpha −0.001456 −0.003231 −0.002188 −0.001230 −0.000397 0.000770
t-stats. −1.154601 −3.030093 −1.853099 −1.111217 −0.365155 0.672472
σα = 0.00206 % of positive (negative) alphas with p-values ≤ 0.05: 0.68% (22.6%)
Index + Property Type Factors
Adj. R 2 0.918186 0.774156 0.908595 0.962672 0.978111 0.990082
alpha −0.000025 −0.002089 −0.001245 0.000025 0.001021 0.001956
t-stats. −0.141473 −2.211532 −1.167726 0.008985 0.928812 1.787704
σα = 0.00199 % of positive (negative) alphas with p-values ≤ 0.05: 7.53% (10.96%)
Index + Property Type Factors + Non-REITs
Adj. R 2 0.930456 0.817307 0.927798 0.965368 0.981084 0.991128
alpha −0.001076 −0.003515 −0.002017 −0.000943 0.000132 0.001010
t-stats. −0.805899 −2.357918 −1.810602 −0.810803 0.133927 0.914468
σα = 0.00201 % of positive (negative) alphas with p-values ≤ 0.05: 2.74% (19.18%)
Index + Statistical Factors
Adj. R 2 0.927135 0.831071 0.935677 0.962484 0.980552 0.989259
alpha −0.000045 −0.002262 −0.001231 −0.000052 0.000964 0.001960
t-stats. −0.116190 −1.863425 −1.207681 −0.050681 0.811080 1.641077
σα = 0.00201 % of positive (negative) alphas with p-values ≤ 0.05: 6.85% (8.9%)
Index + Statistical Factors + Non-REITs
Adj. R 2 0.942055 0.855017 0.944427 0.968425 0.981819 0.990078
alpha −0.001117 −0.003374 −0.001800 −0.000955 0.000136 0.001108
t-stats. −0.775349 −2.217761 −1.613814 −0.866076 0.134938 1.011632
σα = 0.00207 % of positive (negative) alphas with p-values ≤ 0.05: 3.42% (12.33%)
Number of funds: 146.
Note: This table presents means, 10th percentiles, 25th percentiles, medians, 75th percentiles and 90th
percentiles of the distributions of adjusted R 2 , alphas and t-statistics of alphas, for excess returns to
individual REIT mutual funds with respect to a variety of explanatory variables, as well as the standard
deviation of the alphas and the percentage of funds that realize alphas that are significant at the 5%
level. The variables consist of the excess returns to the Dow-Jones Wilshire index, a four-factor model
of the index plus three firm-characteristic factors, namely a book-to-market factor, a size factor and a
momentum factor, all computed using only REITs, a six-factor model of the index and five property-type
portfolios and a 14-factor model of the index augmented by the 13 statistical factors from the triple-sorted
portfolios presented in Table 3. Each model in turn is also augmented by the index of homebuilders
plus the two SNL REOC Indices. We term these three additional factors Non-REITs. For our sample of
funds, we combine funds within the same family which seem to hold the same portfolio. All returns are
net of expenses.
24. 144 Hartzell, Muhlhofer and Titman
¨
single index is only about −0.1 (−0.01) basis points. In contrast, the mean (me-
dian) alpha using the same benchmark reported in Kallberg, Liu and Trzcinka
(2000) for their earlier time period is 18 basis points (nine basis points) per
month. This difference across samples is not surprising given our results on the
alpha of the value-weighted portfolio of all funds.
Based on the standard deviations of alphas across different benchmarks, the
multiple-index models do not appear to reduce the variation in alphas across
funds. While the characteristic-factors model has the lowest standard devia-
tion (0.00178), the single-index model’s standard deviation is the next lowest
(0.00182). However, if one looks at reductions in the right tail of estimated
alphas and also at the extreme t statistics, the models using statistical factors
and characteristic factors with non-REITs appear to work well. The 90th per-
centile of the alpha distribution is reduced from 21 basis points per month in the
single-index model to 11 basis points for the model using statistical factors with
non-REITs and to 8 basis points in the model using characteristic factors with
non-REITs. The t statistic drops from 1.52 to 1.01 or to 0.67, respectively, at the
same point in the distribution. At the middle of the distribution, the estimated
alphas from these two alternatives also appear to be more conservative than the
single index. Compared to the average and median alphas based on the single-
index model that were basically zero, when one adds the statistical factors and
non-REITs, the mean (median) alpha is −11 basis points (−10 basis points).
Similarly, for the models using the characteristic factors and non-REITs, the
mean (median) alpha is −15 basis points (−12 basis points). Typical alphas
using the property-type factors are higher than those based on the characteris-
tic or statistical factors when non-REITs are not included, consistent with an
important firm size or momentum component of returns over this sample.
These reductions in right-tail (positive) alphas can also be seen by examining
the fraction of significant positive alphas across models. For the single-index
model, 6.16% of alphas are positive and significant at the .05 level (using
two-tailed tests), which is more than twice what would be expected based on
random chance. Four alternative models reduce this proportion considerably:
the single-index model with non-REITs to 2.05%, the statistical factors with
non-REITs to 3.42%, the property factors with non-REITs to 2.74% and the
characteristic factors with non-REITs to 0.68%. In the left tail of the alpha
distribution, the models using characteristic factors with non-REITs produces
the largest fractions with estimated significant negative alphas, at 22.6%, versus
10.27% for the single-index model.
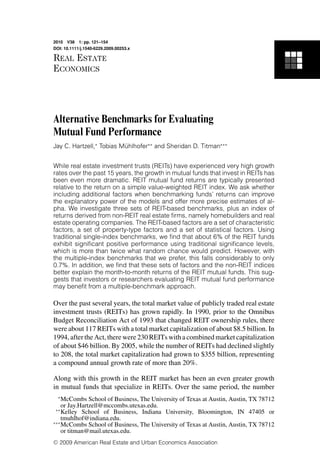
Figure 1 presents box-and-whisker plots of the alphas of the single-index model,
as well as each alternative model including non-REITs. In the figure, the solid
middle line represents the median alpha, while the upper and lower edges
25. Alternative Benchmarks for Evaluating REIT Mutual Fund Performance 145
Figure 1 Box and whisker diagrams of the distrbutions of alphas generated by the
single-index model and four different models including non-REITs.
Distributions of alphas
0.005
0.000
–0.005
–0.010
Index Index.NR Char.NR Prop.NR Stat.NR
Note: The heavy line in the middle of each box indicates the median, the lower and upper edges
indicate the first- and third quartiles, respectively, while the whiskers extend 1.5 times the in-
terquartile range outward from the edge of the box. Any outliers that lie beyond this distance are
indicated individually by a circle. Index represents the alphas from a model of the Dow Jones
Wilshire REIT Index only. Char, Prop and Stat denote models using the single index, plus the
chracteristic factors, property factors and statistical factors, respectively. The suffix NR indicates
models that include the non-REITs index. All returns are net of fees.
of each box represent the first and third quartiles, respectively. The dashed
vertical lines (the whiskers) extend 1.5 times the interquartile range (the length
of the box) from the edges, while any remaining outliers beyond this distance
are plotted individually as circles. As the figure shows, the Index-only model
generates alphas that are noticeably higher than any of the alternative models
that include the non-REIT indices, both in terms of the medians and the left tail
of the distribution. Among the models that include non-REITs, median alphas
are slightly smaller using the characteristic or statistical factors. In addition,
these two models result in tighter distributions than the other alternatives. The
characteristic-factor model with non-REITs appears the most conservative,
displaying the lowest median, the tightest distribution and more low-alpha
outliers.
26. 146 Hartzell, Muhlhofer and Titman
¨
Table 8 presents the same information as Table 7, but using returns to funds
1
before fees (i.e., with 12 of the annual expense ratio added to each fund’s
monthly return). Because fees do not vary much with the factors, we find little
difference in explanatory power. Of more interest are the estimated alphas. Here,
again, the combination of the characteristic factors and non-REITs appears to
offer the most conservative approach. For example, using the single index, the
75th percentile of the alpha distribution is 20 basis points per month, while
the t-statistic at that percentile is 2.03. In contrast, using characteristic factors
plus non-REITs, the 75th-percentile alpha and t statistic are 10 basis points
and 1.09, respectively. For the statistical factors plus non-REITs, we also see a
reduction in estimated abnormal performance, albeit a smaller one in terms of
the point estimate. The estimated alpha and t statistic at those same cutoffs are
15 basis points and 1.25, respectively. Looking at the percentage of funds with
significantly positive alphas, the characteristic factors (plus non-REITs) is the
again the most conservative. While 26.43% of funds have positive alphas with
p values of less than or equal to .05, this drops to 10.71% for the characteristic
factors model with non-REITs (compared to 13.57% for the statistical factors
with non-REITs). The property-type factors plus non-REITs offers the smallest
reduction in alphas, with a 75th-percentile estimated alpha and t statistic of 14
basis points and 1.45, respectively.
In summary, the results of Tables 7 and 8 are consistent with a fairly large
percentage of REIT fund managers producing significant alpha before fees.
The estimates using our most conservative model indicate that 10.7% of funds
had positive significant alphas, much more than the 2.5% level one would expect
by chance. However, after fees, depending on the benchmark, less than 3% of
the funds realize abnormal performance. In contrast, the incidence of negative
abnormal performance before fees is in line with random chance (around 3%,
depending on the model used), but after fees this becomes as high as 19.18%.
One exception to this is specification with characteristic factors and non-REITs;
using this model, the incidence of significant negative abnormal performance
is 8.57% before fees.
To illustrate how the different benchmarks affect estimated alphas for dif-
ferent funds, Table 9 reports how the top-ten funds in terms of performance
using the single-index model faired with our multiple-benchmark models. In
all cases, the multiple benchmarks produce lower estimates of performance.
For example, for the top fund, the Third Avenue Real Estate Fund, the esti-
mated alpha is 71 basis points per month for the single-index model but is
only 20 basis points using the characteristic factors with non-REITs. For half
of these 10 funds, including Third Avenue, the benchmark choice does not
matter much, but for the other half it matters a lot. For 5 of the 10 funds, the
estimated alphas are consistently positive and of similar magnitude. But, for the
27. Alternative Benchmarks for Evaluating REIT Mutual Fund Performance 147
Table 8 Adjusted R 2 , alphas and t-statistics of alphas for REIT mutual funds, before
fees.
Figure Mean 10% 25% Median 75% 90%
Index Only
Adj. R 2 0.899541 0.702734 0.886946 0.954243 0.975152 0.986280
alpha 0.001354 −0.000631 0.000262 0.001457 0.002043 0.003289
t-stats. 1.186317 −0.685829 0.291970 1.239449 2.031819 3.032670
σα = 0.00182 % of positive (negative) alphas with p-values ≤ 0.05: 26.43% (2.86%)
Index + Non-REITs
Adj. R 2 0.920983 0.783650 0.909314 0.960429 0.977071 0.989465
alpha 0.000414 −0.001079 −0.000333 0.000462 0.001331 0.002329
t-stats. 0.566112 −0.928546 −0.276713 0.457571 1.475181 2.285556
σα = 0.00178 % of positive (negative) alphas with p-values ≤ 0.05: 12.86% (2.86%)
Index + Characteristic Factors
Adj. R 2 0.918770 0.801180 0.898182 0.956152 0.977771 0.988416
alpha 0.000696 −0.000980 −0.000185 0.000749 0.001614 0.002480
t-stats. 0.713656 −1.141403 −0.148031 0.544250 1.752722 2.634092
σα = 0.00169 % of positive (negative) alphas with p-values ≤ 0.05: 17.14% (5%)
Index + Characteristic Factors + Non-REITs
Adj. R 2 0.933854 0.839600 0.922126 0.963290 0.980988 0.990670
alpha −0.000084 −0.001665 −0.000701 0.000038 0.000964 0.001895
t-stats. 0.175017 −1.493635 −0.573825 0.035649 1.090286 2.072142
σα = 0.00197 % of positive (negative) alphas with p-values ≤ 0.05: 10.71% (8.57%)
Index + Property Type Factors
Adj. R 2 0.915650 0.734656 0.902323 0.961733 0.977490 0.989721
alpha 0.001382 −0.000746 0.000140 0.001292 0.002426 0.003100
t-stats. 1.209916 −0.680398 0.126693 1.243153 2.205727 3.422720
σα = 0.00198 % of positive (negative) alphas with p-values ≤ 0.05: 30% (2.86%)
Index + Property Type Factors + Non-REITs
Adj. R 2 0.928428 0.802065 0.916560 0.963855 0.980935 0.991729
alpha 0.000301 −0.001964 −0.000559 0.000278 0.001465 0.002286
t-stats. 0.435520 −1.222540 −0.564869 0.192494 1.449491 2.399426
σα = 0.00191 % of positive (negative) alphas with p-values ≤ 0.05: 14.29% (2.86%)
Index + Statistical Factors
Adj. R 2 0.924881 0.800631 0.930724 0.958522 0.979722 0.989585
alpha 0.001319 −0.000739 0.000033 0.001366 0.002302 0.003346
t-stats. 1.123287 −0.780240 0.033099 1.074476 2.208032 3.041706
σα = 0.00199 % of positive (negative) alphas with p-values ≤ 0.05: 29.29% (2.86%)
Index + Statistical Factors + Non-REITs
Adj. R 2 0.940538 0.840993 0.943850 0.967666 0.981277 0.992801
alpha 0.000203 −0.002039 −0.000417 0.000408 0.001502 0.002175
t-stats. 0.402994 −1.145986 −0.443582 0.336317 1.258371 2.101046
σα = 0.00193 % of positive (negative) alphas with p-values ≤ 0.05: 13.57% (2.14%)
Number of funds: 146.
Note: This table presents means, 10th percentiles, 25th percentiles, medians, 75th percentiles and 90th
percentiles of the distributions of adjusted R 2 , alphas and t statistics of alphas, for excess returns to
individual REIT mutual funds with respect to a variety of explanatory variables, as well as the standard
deviation of the alphas and the percentage of firms that realize alphas that are significant at the 5%
level. The variables consist of the excess returns to the Dow-Jones Wilshire index, a four-factor model
of the index plus three firm-characteristic factors, namely a book-to-market factor, a size factor and a
momentum factor, all computed using only REITs, a six-factor model of the index and five property-type
portfolios and a fourteen-factor model of the index augmented by the 13 statistical factors from the
triple-sorted portfolios presented in Table 3. Each model in turn is also augmented by the index of
homebuilders plus the two SNL REOC Indices. We term these three additional factors Non-REITs. For
our sample of funds, we combine funds within the same family which seem to hold the same portfolio.
All returns are before expenses.