SlideShare una empresa de Scribd logo
1 de 7
Descargar para leer sin conexión
The Myth of Diversification: Risk
    Factors vs. Asset Classes
                                                               Sébastien Page, CFA

                                                         Executive Vice President

                                                                                April 2011


PIMCO Canada will retain PIMCO LLC as a subadvisor.
PIMCO Canada Corp., 120 Adelaide Street West, Suite 1901, Toronto, ON MSH 1T1, 416-368-3350, 866-341-3350


Asset Allocation Solutions for the New Normal


              Traditional Asset Allocation                                                        New Normal Asset Allocation
                      Approaches                                                                          Approach

                                                                                                  Forward looking and driven by
              Backward looking and statistically driven
                                                                                                  macroeconomics


              Focus on asset class diversification                                                Focuses on risk factor diversification


              Underestimate the dynamic nature of the                                             Focuses on the secular and the cyclical
              market                                                                              investment horizon


              Use volatility as sole risk measure, thus
                                                                                                  Seeks to explicitly hedge “fat tail” risk
              ignoring “fat tails”

                 Refer to Appendix for additional investment strategy and risk information.


                                                                                              1                   asset_allocation_phil_05
Viewing Risk Through a Different Lens


                                                                                  Stocks

      Equity                                          Value /                                                                                                       Equity
                                     Size                                   Momentum                  Volatility               Liquidity              …
    (Developed)                                       Growth                                                                                                       Industry


                                                                                   Bonds

                                                     Yield                    Fixed
     Nominal                      Real                                                                                                                             Equity
                                                     Curve                   Income                   Volatility               Liquidity
     Duration                    Duration                                                                                                             …         (Developed)
                                                    Duration                 Spreads


                                                                                  2                                      2cs_FE_Risk_Factor_Short


Risk Factor vs. Asset Class Correlations


                                                         Average Cross Correlations
                                                     (March 31, 1997 - January 31, 2011)
                               70%

                                                                                                                              59%
                               60%
                                                 Full Sample
                               50%               Quiet
                                                 Turbulent*
                                                                                                    40%
                 Percent (%)


                               40%

                                                                                                                 30%
                               30%


                               20%


                               10%
                                              4%         3%           4%

                               0%
                                            Risk Factor Correlations                             Asset Class Correlations


        Hypothetical example for illustrative purposes only.
        SOURCE: Windham Portfolio Advisors; PIMCO DataStream; Size, Value, and Momentum from Barra.
        Risk Factors: Equity, Size, Value, Momentum, Duration, 2-10 Slope, 10-30 Slope, EM Spread, Mortgage Spread, Corp Spread, Swap Spread, Real Estate, Commodity.
        Asset class correlations calculated using the following indices: MSCI US Small Cap 1750, MSCI US Large Cap 300, MSCI Emerging Markets, MSCI World ex-US, BarCap U.S.
        Aggregate Index, Dow-Jones U.S. Select REIT Index, S&P GSCI Index
      * To calculate turbulence, we measured the multivariate distance between N return observations scaled by the corresponding risk factor covariance matrix. The 15% most turbulent
        months were considered turbulent. All other months were labeled as “quiet.”
        Refer to Appendix for additional correlation, hypothetical example, and index information.


                                                                                  3
Asset Class Diversification Does Not Equate To
Risk Diversification

              As of December 31, 2010


                      Market Value Allocation
                                                                                                                        Risk Allocation
                (NACUBO >$1 billon portfolio)


                                              Cash
                Distressed                            Domestic
                                               3%                                                                      Commodity            Other
        Natural    Debt                                Equities
                                                                                                                          7%                 1%
       Resources 3%                                     14%                                                      Currency
          7%
                                                                                                                   3%
                                                                   Int'l Equities
   Venture
                                                                         8%
   Capital                                                                                                Corporate
     5%                                                                                                    Spread
                                                                       EM Equities                          10%
                                                                          4%
   Private
   Equity                                                              Domestic
    13%                                                                 Bonds
                                                                         9%

                                                                Int'l Bonds                                                                               Equity
        Hedge Funds                                                  1%                                                                                    79%
           24%                                         Real Estate
                                                           8%

             SOURCE: 2009 NACUBO-Commonfund Study of Endowments, PIMCO.
             Hypothetical example for illustrative purposes only.
             Refer to Appendix for additional hypothetical example and portfolio analysis information.


                                                                                          4                                  asset_allocation_review_19


Left Tail Events Tend to Occur More Frequently
than “Normal” Distributions Predict


                                                                                                                      Normal Distribution
                                                                                                                      “Fat-Tail” Distribution
                        Frequency of Events


                                                       Higher
                                                     Probability
                                                       Of Big
                                                      Losses


                                                                           Losses                        Gains


       SOURCE: PIMCO, Benoit Mandelbrot.
       Sample for illustrative purposes only.


                                                                                          6                                  asset_allocation_review_12
One “Bad Year” Can Erase the Gains From Many
“Good Years”


                                                                                                             10 Year Annual Returns
                                                                                                          Factoring in a 10th “Bad Year”

                                                                                                              -15%                              -20%              -25%

                                                                                           8%                 5.4%*                             4.8%              4.1%

                                                                                          10%                 7.2%                              6.5%              5.9%
                                         Average Returns for
                                           9 “Good Years”
                                                                                          12%                 8.9%                              8.2%              7.6%

                                                                                          14%                 10.7%                             10.0%             9.3%


                             SOURCE: PIMCO
                             Hypothetical example with hypothetical returns for illustrative purposes only
                           * Sample calculation can be applied to all examples: 5.44% = ((1+8%)^9*(1-15%))^0.1 – 1. If calculated using the formula given this would be the annual return of a portfolio   that
                           generates 8% /year for 9 years and followed by a -15% drawdown in the 10th year.
                             Refer to Appendix for additional hypothetical example information.


                                                                                                          7                                                    asset_allocation_review_17


Explicit Hedging of Tail Risk


                                                                                                                                               Return Distribution Based on Portfolio Factor Exposures
                                                                                                                                                 + 100 bps spent on 1 year S&P 500 Put with 25%
                         Return Distribution Based on Portfolio Factor Exposures                                                                                   Implied Volatility


                             NAC UBO Portfolio                                                                                                   NAC UBO Hedged
                             Normal Distribution                                                                                                 Normal Distribution
   Probability Density


                                                                                                                     Probability Density


                 -50% -40% -30% -20% -10%                   0%      10%      20%     30%      40%      50%                                 -50% -40% -30% -20% -10%         0%    10%       20%   30%   40%   50%

                                                        Annual Return                                                                                                  Annual Return


                         Assumptions: S&P 500 put option with 1 year maturity, 25% S&P 500 index implied volatility, risk free rate of zero. Solve for the price that is equal to the tail risk
                                   budget (1%) and simulate the returns. If the value of the index falls below strike, then put option value rises and adds to portfolio returns


                             SOURCE: 2009 NACUBO-Commonfund Study of Endowments, PIMCO.
                             Using NACUBO portfolio as of December 31, 2010
                             Hypothetical example for illustrative purposes only.
                             Refer to Appendix for additional hypothetical example, index, investment strategy, risk, and portfolio analysis information.


                                                                                                          8                                                    asset_allocation_review_24
Regime Specific Correlations


                                                             AUD-Equity and JPY-Equity Correlations as a Function of Equity Returns
                     100%

                      80%                                                      AUD


                      60%

                      40%

                      20%
     Correlation


                        0%

                     -20%
                                                                               JPY
                     -40%

                     -60%

                     -80%

                    -100%
                              -10%                                -5%                                0%                      5%                        10%
                                                                                  Equity Return Threshold
                                                                     (Equities Returning x Percent or Less in a Month)


                   SOURCE: Equity returns from Barra’s equity factor, AUD and JPY returns from Windham Portfolio Advisor
                   Hypothetical example for illustrative purposes only.
                   Using monthly data from March 1994 to December 2009
                   Different time periods will produce different results.
                   Refer to the Appendix for additional correlation, hypothetical example and risk information.


                                                                                           9


Asset Allocation Solutions for the New Normal


               Traditional Asset Allocation                                                                New Normal Asset Allocation
                       Approaches                                                                                  Approach

                                                                                                              Forward looking and driven by
               Backward looking and statistically driven
                                                                                                              macroeconomics


               Focus on asset class diversification                                                           Focuses on risk factor diversification


               Underestimate the dynamic nature of the                                                        Focuses on the secular and the cyclical
               market                                                                                         investment horizon


               Use volatility as sole risk measure, thus
                                                                                                              Seeks to explicitly hedge “fat tail” risk
               ignoring “fat tails”


              Refer to Appendix for additional investment strategy and risk information.


                                                                                           10                               asset_allocation_phil_05
Appendix


     Past performance is not a guarantee or a reliable indicator of future results.

     Correlation
     The correlation of various indices or securities against one another or against inflation is based upon data over a certain time period. These correlations may vary
     substantially in the future or over different time periods that can result in greater volatility.

     Endowment Style Portfolio Index Sources
     US Equities are represented by the S&P 500, International Equities are represented by the MSCI EAFE Net Dividend Index in USD, EM Equities is represented by
     the MSCI Emerging Markets Index, US Bonds are represented by the Barclays Capital US Aggregate Index, Global Bonds are represented by the Barclays Global
     Aggregate (USD Hedged) Index, Commodities are represented by the Dow Jones UBS Commodity TR Index, REITs are represented by NCREIF Property Index,
     Absolute Return is represented by the HFRI Fund Weighted Composite Index, Private Equity is represented by the Cambridge Associates LLC U.S. Private Equity
     Index®, Venture Capital is represented by the Cambridge Associates LLC U.S. Venture Capital Index®

     Hypothetical Example
     No representation is being made that any account, product, or strategy will or is likely to achieve profits, losses, or results similar to those shown. Hypothetical or
     simulated performance results have several inherent limitations. Unlike an actual performance record, simulated results do not represent actual performance and
     are generally prepared with the benefit of hindsight. There are frequently sharp differences between simulated performance results and the actual results
     subsequently achieved by any particular account, product, or strategy. In addition, since trades have not actually been executed, simulated results cannot account
     for the impact of certain market risks such as lack of liquidity. There are numerous other factors related to the markets in general or the implementation of any
     specific investment strategy, which cannot be fully accounted for in the preparation of simulated results and all of which can adversely affect actual results.

     Investment Strategy
     There is no guarantee that these investment strategies will work under all market conditions and each investor should evaluate their ability to invest for a long-term
     especially during periods of downturn in the market. No representation is being made that any account, product, or strategy will or is likely to achieve profits, losses,
     or results similar to those shown.


                                                                          11                                          asset_allocation_app_01


Appendix


     Portfolio Analysis
     The portfolio analysis is based on the 2009 NACUBO-Commonfund Study of Endowments Average Endowment Style Portfolio and no representation is being made
     that the structure of the average portfolio or any account will remain the same or that similar returns will be achieved. Results shown may not be attained and
     should not be construed as the only possibilities that exist. Actual results will vary and are subject to change with market conditions. There is no guarantee that
     results will be achieved. No fees or expenses were included in the estimated results and distribution. The scenarios assume a set of assumptions that may,
     individually or collectively, not develop over time. The analysis reflected in this information is based upon data at time of analysis. Forecasts, estimates, and certain
     information contained herein are based upon proprietary research and should not be considered as investment advice or a recommendation of any particular
     security, strategy or investment product.

     Risk
     Derivatives may involve certain costs and risks such as liquidity, interest rate, market, credit, management and the risk that a position could not be closed when
     most advantageous. Investing in derivatives could lose more than the amount invested. The strategy seeks to hedge against tail events and achieve its investment
     objective by entering into financial derivatives (including, options, swaps and other derivative instruments) that are expected to increase in value during the
     occurrence of tail events. If a tail event occurs, the strategy may lose any delivery of instruments or other collateral pledged as security due to the potential systemic
     import of the tail event adversely affecting the portfolio positions. The strategy risks the loss of all or a portion of the value of the tail event instruments it may
     purchase or the derivative contracts it may enter into, even if a period of severe market stress occurs during the term of such securities. A tail event is
     unpredictable; therefore, investments in instruments tied to the occurrence of a tail event are speculative. Suitable derivative transactions may not be available in all
     circumstances. The use of these strategies involves certain special risks, including a possible imperfect correlation, or even no correlation, between price
     movements of derivative instruments and price movements of related investments. The strategy may suffer losses due to the possible inability of the strategy to
     purchase or sell the security at a time that otherwise would be favorable or the possible need to sell the security at a disadvantageous time because the strategy is
     required to maintain collateral or offsetting positions in connection with transactions in derivative instruments, and the possible inability of the strategy to close out or
     to liquidate its derivatives positions. In addition, the strategy’s use of such instruments may cause the strategy to realize higher amounts of short-term capital gains
     (generally taxed at ordinary income tax rates) than if it had not used such instruments. If the strategy gains exposure to an asset class using derivative instruments
     backed by a collateral portfolio of fixed income instruments, changes in the value of the fixed income instruments may result in greater or lesser exposure to that
     asset class than would have resulted from a direct investment in securities comprising that asset class. Derivatives are currently the subject of regulatory and
     statutory proposals, both in the U.S. and internationally. There can be no assurance that the enactment of rules or regulations in the future will not have an adverse
     effect on the strategy’s ability to carry out its investment strategy or to do so at a reasonable cost.

     This material contains the current opinions of the manager and such opinions are subject to change without notice. This material has been distributed for
     informational purposes only and should not be considered as investment advice or a recommendation of any particular security, strategy or investment product.
     Information contained herein has been obtained from sources believed to be reliable, but not guaranteed. No part of this material may be reproduced in any form, or
     referred to in any other publication, without express written permission. ©2011, PIMCO.

     The products and services provided by PIMCO Canada Corp. may only be available in certain provinces or territories of Canada and only through dealers
     authorized for that purpose.

     PIMCO Canada Corp., 120 Adelaide Street West, Suite 1901, Toronto, ON MSH 1T1, 416-368-3350, 866-341-3350.


                                                                          12                                          asset_allocation_app_01
Appendix


     Index Description
     Barclays Capital Global Aggregate (USD Hedged) Index provides a broad-based measure of the global investment-grade fixed income markets. The three major
     components of this index are the U.S. Aggregate, the Pan-European Aggregate, and the Asian-Pacific Aggregate Indices. The index also includes Eurodollar and
     Euro-Yen corporate bonds, Canadian Government securities, and USD investment grade 144A securities.

     Barclays Capital U.S. Aggregate Index represents securities that are SEC-registered, taxable, and dollar denominated. The index covers the U.S. investment
     grade fixed rate bond market, with index components for government and corporate securities, mortgage pass-through securities, and asset-backed securities.
     These major sectors are subdivided into more specific indices that are calculated and reported on a regular basis.

     Barclays Capital U.S. TIPS Index is an unmanaged market index comprised of all U.S. Treasury Inflation Protected Securities rated investment grade (Baa3 or
     better), have at least one year to final maturity, and at least $250 million par amount outstanding. Performance data for this index prior to 10/97 represents returns
     of the Barclays Capital Inflation Notes Index.

     The Cambridge Associates U.S. Private Equity Index is based on returns data representing nearly two-thirds of leveraged buyout, subordinated debt, and special-
     situations partnerships since 1986.

     The Cambridge Associates LLC U.S. Venture Capital Index is based on returns data compiled on funds representing over 80% of the total dollars raised by U.S.
     venture capital managers between 1981 and 2001. Cambridge Associates LLC calculates the pooled net time-weighted return by quarter from March 31, 1981
     through the most recent quarter. The pooled means represent the time-weighted rates of return calculated on the aggregate of all cash flows and market values
     as reported by the General Partners to Cambridge Associates LLC in their quarterly and annual audited financial reports. Net returns exclude all management
     fees, expenses and performance fees that take the form of a carried interest.

     The Dow Jones Industrial Average (DJIA) is a price-weighted average of 30 actively traded “blue chip” stocks, primarily industrials, but including financials and
     other service-oriented companies as well. The components, which change from time to time, represent between 15% and 20% of the market value of NYSE
     stocks.

     The Dow Jones UBS Commodity Total Return Index is an unmanaged index composed of futures contracts on 19 physical commodities. The index is designed to
     be a highly liquid and diversified benchmark for commodities as an asset class. Prior to May 7, 2009, this index was known as the Dow Jones AIG Commodity
     Total Return Index.


                                                                        13                                        asset_allocation_app_01


Appendix


     The HFRI Fund Weighted Composite Index is comprised of over 2000 domestic and offshore constituent funds. All funds report assets in USD and report net of
     fees returns on a monthly basis. There is no Fund of Funds included in the index and each has at least $50 million under management or have been actively
     trading for at least twelve months.

     JPMorgan GBI Global (Unhedged) is an unmanaged market index representative of the total return performance in U.S. dollars on an unhedged basis of major
     world bond markets.

     The MSCI EAFE (Morgan Stanley Capital International Europe, Australasia, Far East Index) is an unmanaged index of over 900 companies, and is a generally
     accepted benchmark for major overseas markets. Index weightings represent the relative capitalizations of the major overseas markets included in the index on
     a U.S. dollar adjusted basis.

     MSCI EAFE Net Dividend Index (USD Unhedged) is an unmanaged index of issuers in countries of Europe, Australia, and the Far East represented in U.S.
     Dollars on an unhedged basis. The index does not reflect deductions for fees, expenses or taxes.

     The Morgan Stanley Capital International Emerging Markets Index is an unmanaged index that measures equity market performance in the global emerging
     markets. As of May 2005, the Emerging Markets Index (float-adjusted market capitalization index) consisted of indices in 26 emerging countries: Argentina,
     Brazil, Chile, China, Colombia, Czech Republic, Egypt, Hungary, India, Indonesia, Israel, Jordan, Korea, Malaysia, Mexico, Morocco, Pakistan, Peru,
     Philippines, Poland, Russia, South Africa, Taiwan, Thailand, Turkey, and Venezuela.

     The Morgan Stanley Capital International World Index is an unmanaged market-weighted index that consists of over 1,200 securities traded in 22 of the world’s
     most developed countries. Securities are listed on exchanges in the US, Europe, Canada, Australia, New Zealand, and the Far East. The index is calculated
     separately; without dividends, with gross dividends reinvested and estimated tax withheld, and with gross dividends reinvested, in both U.S. Dollars and local
     currency.

     The NCREIF (National Council of Real Estate Investment Fiduciaries) Property Index is a quarterly time series composite total rate of return measure of
     performance of a very large pool of individual commercial real estate properties acquired in the private market for investment purposes only.

     The S&P 500 Index is an unmanaged market index generally considered representative of the stock market as a whole. The index focuses on the Large-Cap
     segment of the U.S. equities market.

     It is not possible to invest directly in an unmanaged index.


                                                                        14                                        asset_allocation_app_01

Más contenido relacionado

Destacado

Transaction cost expenditures and the relative performance of mutual funds(13)
Transaction cost expenditures and the relative performance of mutual funds(13)Transaction cost expenditures and the relative performance of mutual funds(13)
Transaction cost expenditures and the relative performance of mutual funds(13)bfmresearch
 
Performance emergingfixedincomemanagers joi
Performance emergingfixedincomemanagers joiPerformance emergingfixedincomemanagers joi
Performance emergingfixedincomemanagers joibfmresearch
 
Examination of hedged mutual funds agarwal
Examination of hedged mutual funds agarwalExamination of hedged mutual funds agarwal
Examination of hedged mutual funds agarwalbfmresearch
 
Morningstar fund investor_fees_predictor
Morningstar fund investor_fees_predictorMorningstar fund investor_fees_predictor
Morningstar fund investor_fees_predictorbfmresearch
 
Fund size, liquidity and org chen hong
Fund size, liquidity and org chen hongFund size, liquidity and org chen hong
Fund size, liquidity and org chen hongbfmresearch
 
Should investors avoid active managed funds baks
Should investors avoid active managed funds baksShould investors avoid active managed funds baks
Should investors avoid active managed funds baksbfmresearch
 
Do pastmutualfindw innersrepeat_snp
Do pastmutualfindw innersrepeat_snpDo pastmutualfindw innersrepeat_snp
Do pastmutualfindw innersrepeat_snpbfmresearch
 

Destacado (7)

Transaction cost expenditures and the relative performance of mutual funds(13)
Transaction cost expenditures and the relative performance of mutual funds(13)Transaction cost expenditures and the relative performance of mutual funds(13)
Transaction cost expenditures and the relative performance of mutual funds(13)
 
Performance emergingfixedincomemanagers joi
Performance emergingfixedincomemanagers joiPerformance emergingfixedincomemanagers joi
Performance emergingfixedincomemanagers joi
 
Examination of hedged mutual funds agarwal
Examination of hedged mutual funds agarwalExamination of hedged mutual funds agarwal
Examination of hedged mutual funds agarwal
 
Morningstar fund investor_fees_predictor
Morningstar fund investor_fees_predictorMorningstar fund investor_fees_predictor
Morningstar fund investor_fees_predictor
 
Fund size, liquidity and org chen hong
Fund size, liquidity and org chen hongFund size, liquidity and org chen hong
Fund size, liquidity and org chen hong
 
Should investors avoid active managed funds baks
Should investors avoid active managed funds baksShould investors avoid active managed funds baks
Should investors avoid active managed funds baks
 
Do pastmutualfindw innersrepeat_snp
Do pastmutualfindw innersrepeat_snpDo pastmutualfindw innersrepeat_snp
Do pastmutualfindw innersrepeat_snp
 

Similar a Sebastien page-pimco

курт котзеггер
курт котзеггеркурт котзеггер
курт котзеггерindrih
 
Presentation For Hku 21.10.2010
Presentation For Hku 21.10.2010Presentation For Hku 21.10.2010
Presentation For Hku 21.10.2010CF Yam
 
Risk Appetite: A new Menu under Basel 3? Pieter Klaassen (UBS) voor het Zande...
Risk Appetite: A new Menu under Basel 3? Pieter Klaassen (UBS) voor het Zande...Risk Appetite: A new Menu under Basel 3? Pieter Klaassen (UBS) voor het Zande...
Risk Appetite: A new Menu under Basel 3? Pieter Klaassen (UBS) voor het Zande...Zanders Treasury, Risk and Finance
 
Clarus' presentation on "Inside the Strategies" at the PensionSource Fund Man...
Clarus' presentation on "Inside the Strategies" at the PensionSource Fund Man...Clarus' presentation on "Inside the Strategies" at the PensionSource Fund Man...
Clarus' presentation on "Inside the Strategies" at the PensionSource Fund Man...PensionSource
 
Fulton Financial Advisors
Fulton Financial AdvisorsFulton Financial Advisors
Fulton Financial AdvisorsDonald Marano
 
The Lifestyle Funds Introductory Guide
The Lifestyle Funds Introductory GuideThe Lifestyle Funds Introductory Guide
The Lifestyle Funds Introductory Guidechrisdattrc
 
FMP Market Themes and Outlook January 2013
FMP Market Themes and Outlook January 2013FMP Market Themes and Outlook January 2013
FMP Market Themes and Outlook January 2013kmyoung1
 
Pinc excel mf pms
Pinc excel mf pmsPinc excel mf pms
Pinc excel mf pmsPINCMONEY
 
Pension Risk Transfer Index: November 2011-Dietrich & Associates
Pension Risk Transfer Index: November 2011-Dietrich & AssociatesPension Risk Transfer Index: November 2011-Dietrich & Associates
Pension Risk Transfer Index: November 2011-Dietrich & AssociatesJay Dinunzio
 
Va G Mx B Pricing 5 16 09
Va G Mx B Pricing 5 16 09Va G Mx B Pricing 5 16 09
Va G Mx B Pricing 5 16 09guest4823993
 
Va G Mx B Pricing 5 16 09
Va G Mx B Pricing 5 16 09Va G Mx B Pricing 5 16 09
Va G Mx B Pricing 5 16 09Frank Zhang
 
Ifc investor presentation_june_2011
Ifc investor presentation_june_2011Ifc investor presentation_june_2011
Ifc investor presentation_june_2011Intact
 
IFC Investor Presentation June 2011
IFC Investor Presentation June 2011IFC Investor Presentation June 2011
IFC Investor Presentation June 2011Intact
 
Investor presentation mar 2013
Investor presentation   mar 2013Investor presentation   mar 2013
Investor presentation mar 2013Intact
 
Risk profiles of venture capital
Risk profiles of venture capitalRisk profiles of venture capital
Risk profiles of venture capitalDan Rua
 
IFC Investor Presentation Q2 2011 August
IFC Investor Presentation Q2 2011 AugustIFC Investor Presentation Q2 2011 August
IFC Investor Presentation Q2 2011 AugustIntact
 

Similar a Sebastien page-pimco (20)

курт котзеггер
курт котзеггеркурт котзеггер
курт котзеггер
 
Presentation For Hku 21.10.2010
Presentation For Hku 21.10.2010Presentation For Hku 21.10.2010
Presentation For Hku 21.10.2010
 
Risk Appetite: A new Menu under Basel 3? Pieter Klaassen (UBS) voor het Zande...
Risk Appetite: A new Menu under Basel 3? Pieter Klaassen (UBS) voor het Zande...Risk Appetite: A new Menu under Basel 3? Pieter Klaassen (UBS) voor het Zande...
Risk Appetite: A new Menu under Basel 3? Pieter Klaassen (UBS) voor het Zande...
 
Clarus' presentation on "Inside the Strategies" at the PensionSource Fund Man...
Clarus' presentation on "Inside the Strategies" at the PensionSource Fund Man...Clarus' presentation on "Inside the Strategies" at the PensionSource Fund Man...
Clarus' presentation on "Inside the Strategies" at the PensionSource Fund Man...
 
Fulton Financial Advisors
Fulton Financial AdvisorsFulton Financial Advisors
Fulton Financial Advisors
 
HonorVise Overview
HonorVise OverviewHonorVise Overview
HonorVise Overview
 
The Lifestyle Funds Introductory Guide
The Lifestyle Funds Introductory GuideThe Lifestyle Funds Introductory Guide
The Lifestyle Funds Introductory Guide
 
FMP Market Themes and Outlook January 2013
FMP Market Themes and Outlook January 2013FMP Market Themes and Outlook January 2013
FMP Market Themes and Outlook January 2013
 
Risk Dashboard
Risk Dashboard Risk Dashboard
Risk Dashboard
 
Pinc excel mf pms
Pinc excel mf pmsPinc excel mf pms
Pinc excel mf pms
 
Smbp 2012
Smbp 2012Smbp 2012
Smbp 2012
 
Pension Risk Transfer Index: November 2011-Dietrich & Associates
Pension Risk Transfer Index: November 2011-Dietrich & AssociatesPension Risk Transfer Index: November 2011-Dietrich & Associates
Pension Risk Transfer Index: November 2011-Dietrich & Associates
 
Va G Mx B Pricing 5 16 09
Va G Mx B Pricing 5 16 09Va G Mx B Pricing 5 16 09
Va G Mx B Pricing 5 16 09
 
Va G Mx B Pricing 5 16 09
Va G Mx B Pricing 5 16 09Va G Mx B Pricing 5 16 09
Va G Mx B Pricing 5 16 09
 
Ifc investor presentation_june_2011
Ifc investor presentation_june_2011Ifc investor presentation_june_2011
Ifc investor presentation_june_2011
 
IFC Investor Presentation June 2011
IFC Investor Presentation June 2011IFC Investor Presentation June 2011
IFC Investor Presentation June 2011
 
Project Euler
Project EulerProject Euler
Project Euler
 
Investor presentation mar 2013
Investor presentation   mar 2013Investor presentation   mar 2013
Investor presentation mar 2013
 
Risk profiles of venture capital
Risk profiles of venture capitalRisk profiles of venture capital
Risk profiles of venture capital
 
IFC Investor Presentation Q2 2011 August
IFC Investor Presentation Q2 2011 AugustIFC Investor Presentation Q2 2011 August
IFC Investor Presentation Q2 2011 August
 

Más de bfmresearch

Impact ofmutualfundclosuresonfundmanagers
Impact ofmutualfundclosuresonfundmanagersImpact ofmutualfundclosuresonfundmanagers
Impact ofmutualfundclosuresonfundmanagersbfmresearch
 
Standard & poor's 16768282 fund-factors-2009 jan1
Standard & poor's 16768282 fund-factors-2009 jan1Standard & poor's 16768282 fund-factors-2009 jan1
Standard & poor's 16768282 fund-factors-2009 jan1bfmresearch
 
Performance emergingfixedincomemanagers joi_is age just a number
Performance emergingfixedincomemanagers joi_is age just a numberPerformance emergingfixedincomemanagers joi_is age just a number
Performance emergingfixedincomemanagers joi_is age just a numberbfmresearch
 
Portfolio turnover white paper
Portfolio turnover white paperPortfolio turnover white paper
Portfolio turnover white paperbfmresearch
 
Mauboussin skill manager
Mauboussin skill managerMauboussin skill manager
Mauboussin skill managerbfmresearch
 
Is alphadead researchnote
Is alphadead researchnoteIs alphadead researchnote
Is alphadead researchnotebfmresearch
 
Fis group study on emerging managers performance drivers 2007
Fis group   study on  emerging managers performance drivers 2007Fis group   study on  emerging managers performance drivers 2007
Fis group study on emerging managers performance drivers 2007bfmresearch
 
Barclays manager selection0312
Barclays   manager selection0312Barclays   manager selection0312
Barclays manager selection0312bfmresearch
 
Active managementmostlyefficientmarkets faj
Active managementmostlyefficientmarkets fajActive managementmostlyefficientmarkets faj
Active managementmostlyefficientmarkets fajbfmresearch
 
2012 0224 active share
2012 0224 active share2012 0224 active share
2012 0224 active sharebfmresearch
 
12 182-china webcast
12 182-china webcast12 182-china webcast
12 182-china webcastbfmresearch
 
Scoring For Returns-Stuart Investment
Scoring For Returns-Stuart InvestmentScoring For Returns-Stuart Investment
Scoring For Returns-Stuart Investmentbfmresearch
 
Performance persistence brown_goetzmann
Performance persistence brown_goetzmannPerformance persistence brown_goetzmann
Performance persistence brown_goetzmannbfmresearch
 
Persistence inmutualfundperformance carhart
Persistence inmutualfundperformance carhartPersistence inmutualfundperformance carhart
Persistence inmutualfundperformance carhartbfmresearch
 
Ownership and fund performance evans
Ownership and fund performance evansOwnership and fund performance evans
Ownership and fund performance evansbfmresearch
 
Information ratio mgrevaluation_bossert
Information ratio mgrevaluation_bossertInformation ratio mgrevaluation_bossert
Information ratio mgrevaluation_bossertbfmresearch
 

Más de bfmresearch (20)

Impact ofmutualfundclosuresonfundmanagers
Impact ofmutualfundclosuresonfundmanagersImpact ofmutualfundclosuresonfundmanagers
Impact ofmutualfundclosuresonfundmanagers
 
Standard & poor's 16768282 fund-factors-2009 jan1
Standard & poor's 16768282 fund-factors-2009 jan1Standard & poor's 16768282 fund-factors-2009 jan1
Standard & poor's 16768282 fund-factors-2009 jan1
 
Performance emergingfixedincomemanagers joi_is age just a number
Performance emergingfixedincomemanagers joi_is age just a numberPerformance emergingfixedincomemanagers joi_is age just a number
Performance emergingfixedincomemanagers joi_is age just a number
 
Ssrn id1685942
Ssrn id1685942Ssrn id1685942
Ssrn id1685942
 
Spiva mid2011
Spiva mid2011Spiva mid2011
Spiva mid2011
 
Portfolio turnover white paper
Portfolio turnover white paperPortfolio turnover white paper
Portfolio turnover white paper
 
Mauboussin skill manager
Mauboussin skill managerMauboussin skill manager
Mauboussin skill manager
 
Jp littlebook
Jp littlebookJp littlebook
Jp littlebook
 
Is alphadead researchnote
Is alphadead researchnoteIs alphadead researchnote
Is alphadead researchnote
 
Fis group study on emerging managers performance drivers 2007
Fis group   study on  emerging managers performance drivers 2007Fis group   study on  emerging managers performance drivers 2007
Fis group study on emerging managers performance drivers 2007
 
Barclays manager selection0312
Barclays   manager selection0312Barclays   manager selection0312
Barclays manager selection0312
 
Active managementmostlyefficientmarkets faj
Active managementmostlyefficientmarkets fajActive managementmostlyefficientmarkets faj
Active managementmostlyefficientmarkets faj
 
2012 0224 active share
2012 0224 active share2012 0224 active share
2012 0224 active share
 
12 182-china webcast
12 182-china webcast12 182-china webcast
12 182-china webcast
 
Vanguard dc
Vanguard dcVanguard dc
Vanguard dc
 
Scoring For Returns-Stuart Investment
Scoring For Returns-Stuart InvestmentScoring For Returns-Stuart Investment
Scoring For Returns-Stuart Investment
 
Performance persistence brown_goetzmann
Performance persistence brown_goetzmannPerformance persistence brown_goetzmann
Performance persistence brown_goetzmann
 
Persistence inmutualfundperformance carhart
Persistence inmutualfundperformance carhartPersistence inmutualfundperformance carhart
Persistence inmutualfundperformance carhart
 
Ownership and fund performance evans
Ownership and fund performance evansOwnership and fund performance evans
Ownership and fund performance evans
 
Information ratio mgrevaluation_bossert
Information ratio mgrevaluation_bossertInformation ratio mgrevaluation_bossert
Information ratio mgrevaluation_bossert
 

Último

VIP Call Girl Jamshedpur Aashi 8250192130 Independent Escort Service Jamshedpur
VIP Call Girl Jamshedpur Aashi 8250192130 Independent Escort Service JamshedpurVIP Call Girl Jamshedpur Aashi 8250192130 Independent Escort Service Jamshedpur
VIP Call Girl Jamshedpur Aashi 8250192130 Independent Escort Service JamshedpurSuhani Kapoor
 
GD Birla and his contribution in management
GD Birla and his contribution in managementGD Birla and his contribution in management
GD Birla and his contribution in managementchhavia330
 
KYC-Verified Accounts: Helping Companies Handle Challenging Regulatory Enviro...
KYC-Verified Accounts: Helping Companies Handle Challenging Regulatory Enviro...KYC-Verified Accounts: Helping Companies Handle Challenging Regulatory Enviro...
KYC-Verified Accounts: Helping Companies Handle Challenging Regulatory Enviro...Any kyc Account
 
Monthly Social Media Update April 2024 pptx.pptx
Monthly Social Media Update April 2024 pptx.pptxMonthly Social Media Update April 2024 pptx.pptx
Monthly Social Media Update April 2024 pptx.pptxAndy Lambert
 
Call Girls Pune Just Call 9907093804 Top Class Call Girl Service Available
Call Girls Pune Just Call 9907093804 Top Class Call Girl Service AvailableCall Girls Pune Just Call 9907093804 Top Class Call Girl Service Available
Call Girls Pune Just Call 9907093804 Top Class Call Girl Service AvailableDipal Arora
 
Creating Low-Code Loan Applications using the Trisotech Mortgage Feature Set
Creating Low-Code Loan Applications using the Trisotech Mortgage Feature SetCreating Low-Code Loan Applications using the Trisotech Mortgage Feature Set
Creating Low-Code Loan Applications using the Trisotech Mortgage Feature SetDenis Gagné
 
BEST ✨ Call Girls In Indirapuram Ghaziabad ✔️ 9871031762 ✔️ Escorts Service...
BEST ✨ Call Girls In  Indirapuram Ghaziabad  ✔️ 9871031762 ✔️ Escorts Service...BEST ✨ Call Girls In  Indirapuram Ghaziabad  ✔️ 9871031762 ✔️ Escorts Service...
BEST ✨ Call Girls In Indirapuram Ghaziabad ✔️ 9871031762 ✔️ Escorts Service...noida100girls
 
Tech Startup Growth Hacking 101 - Basics on Growth Marketing
Tech Startup Growth Hacking 101  - Basics on Growth MarketingTech Startup Growth Hacking 101  - Basics on Growth Marketing
Tech Startup Growth Hacking 101 - Basics on Growth MarketingShawn Pang
 
Call Girls in Gomti Nagar - 7388211116 - With room Service
Call Girls in Gomti Nagar - 7388211116  - With room ServiceCall Girls in Gomti Nagar - 7388211116  - With room Service
Call Girls in Gomti Nagar - 7388211116 - With room Servicediscovermytutordmt
 
MONA 98765-12871 CALL GIRLS IN LUDHIANA LUDHIANA CALL GIRL
MONA 98765-12871 CALL GIRLS IN LUDHIANA LUDHIANA CALL GIRLMONA 98765-12871 CALL GIRLS IN LUDHIANA LUDHIANA CALL GIRL
MONA 98765-12871 CALL GIRLS IN LUDHIANA LUDHIANA CALL GIRLSeo
 
It will be International Nurses' Day on 12 May
It will be International Nurses' Day on 12 MayIt will be International Nurses' Day on 12 May
It will be International Nurses' Day on 12 MayNZSG
 
Lucknow 💋 Escorts in Lucknow - 450+ Call Girl Cash Payment 8923113531 Neha Th...
Lucknow 💋 Escorts in Lucknow - 450+ Call Girl Cash Payment 8923113531 Neha Th...Lucknow 💋 Escorts in Lucknow - 450+ Call Girl Cash Payment 8923113531 Neha Th...
Lucknow 💋 Escorts in Lucknow - 450+ Call Girl Cash Payment 8923113531 Neha Th...anilsa9823
 
Progress Report - Oracle Database Analyst Summit
Progress  Report - Oracle Database Analyst SummitProgress  Report - Oracle Database Analyst Summit
Progress Report - Oracle Database Analyst SummitHolger Mueller
 
Mysore Call Girls 8617370543 WhatsApp Number 24x7 Best Services
Mysore Call Girls 8617370543 WhatsApp Number 24x7 Best ServicesMysore Call Girls 8617370543 WhatsApp Number 24x7 Best Services
Mysore Call Girls 8617370543 WhatsApp Number 24x7 Best ServicesDipal Arora
 
HONOR Veterans Event Keynote by Michael Hawkins
HONOR Veterans Event Keynote by Michael HawkinsHONOR Veterans Event Keynote by Michael Hawkins
HONOR Veterans Event Keynote by Michael HawkinsMichael W. Hawkins
 
VIP Call Girls In Saharaganj ( Lucknow ) 🔝 8923113531 🔝 Cash Payment (COD) 👒
VIP Call Girls In Saharaganj ( Lucknow  ) 🔝 8923113531 🔝  Cash Payment (COD) 👒VIP Call Girls In Saharaganj ( Lucknow  ) 🔝 8923113531 🔝  Cash Payment (COD) 👒
VIP Call Girls In Saharaganj ( Lucknow ) 🔝 8923113531 🔝 Cash Payment (COD) 👒anilsa9823
 
Call Girls In Panjim North Goa 9971646499 Genuine Service
Call Girls In Panjim North Goa 9971646499 Genuine ServiceCall Girls In Panjim North Goa 9971646499 Genuine Service
Call Girls In Panjim North Goa 9971646499 Genuine Serviceritikaroy0888
 
Unlocking the Secrets of Affiliate Marketing.pdf
Unlocking the Secrets of Affiliate Marketing.pdfUnlocking the Secrets of Affiliate Marketing.pdf
Unlocking the Secrets of Affiliate Marketing.pdfOnline Income Engine
 
7.pdf This presentation captures many uses and the significance of the number...
7.pdf This presentation captures many uses and the significance of the number...7.pdf This presentation captures many uses and the significance of the number...
7.pdf This presentation captures many uses and the significance of the number...Paul Menig
 

Último (20)

VIP Call Girl Jamshedpur Aashi 8250192130 Independent Escort Service Jamshedpur
VIP Call Girl Jamshedpur Aashi 8250192130 Independent Escort Service JamshedpurVIP Call Girl Jamshedpur Aashi 8250192130 Independent Escort Service Jamshedpur
VIP Call Girl Jamshedpur Aashi 8250192130 Independent Escort Service Jamshedpur
 
GD Birla and his contribution in management
GD Birla and his contribution in managementGD Birla and his contribution in management
GD Birla and his contribution in management
 
KYC-Verified Accounts: Helping Companies Handle Challenging Regulatory Enviro...
KYC-Verified Accounts: Helping Companies Handle Challenging Regulatory Enviro...KYC-Verified Accounts: Helping Companies Handle Challenging Regulatory Enviro...
KYC-Verified Accounts: Helping Companies Handle Challenging Regulatory Enviro...
 
Monthly Social Media Update April 2024 pptx.pptx
Monthly Social Media Update April 2024 pptx.pptxMonthly Social Media Update April 2024 pptx.pptx
Monthly Social Media Update April 2024 pptx.pptx
 
Call Girls Pune Just Call 9907093804 Top Class Call Girl Service Available
Call Girls Pune Just Call 9907093804 Top Class Call Girl Service AvailableCall Girls Pune Just Call 9907093804 Top Class Call Girl Service Available
Call Girls Pune Just Call 9907093804 Top Class Call Girl Service Available
 
Creating Low-Code Loan Applications using the Trisotech Mortgage Feature Set
Creating Low-Code Loan Applications using the Trisotech Mortgage Feature SetCreating Low-Code Loan Applications using the Trisotech Mortgage Feature Set
Creating Low-Code Loan Applications using the Trisotech Mortgage Feature Set
 
BEST ✨ Call Girls In Indirapuram Ghaziabad ✔️ 9871031762 ✔️ Escorts Service...
BEST ✨ Call Girls In  Indirapuram Ghaziabad  ✔️ 9871031762 ✔️ Escorts Service...BEST ✨ Call Girls In  Indirapuram Ghaziabad  ✔️ 9871031762 ✔️ Escorts Service...
BEST ✨ Call Girls In Indirapuram Ghaziabad ✔️ 9871031762 ✔️ Escorts Service...
 
Tech Startup Growth Hacking 101 - Basics on Growth Marketing
Tech Startup Growth Hacking 101  - Basics on Growth MarketingTech Startup Growth Hacking 101  - Basics on Growth Marketing
Tech Startup Growth Hacking 101 - Basics on Growth Marketing
 
Call Girls in Gomti Nagar - 7388211116 - With room Service
Call Girls in Gomti Nagar - 7388211116  - With room ServiceCall Girls in Gomti Nagar - 7388211116  - With room Service
Call Girls in Gomti Nagar - 7388211116 - With room Service
 
MONA 98765-12871 CALL GIRLS IN LUDHIANA LUDHIANA CALL GIRL
MONA 98765-12871 CALL GIRLS IN LUDHIANA LUDHIANA CALL GIRLMONA 98765-12871 CALL GIRLS IN LUDHIANA LUDHIANA CALL GIRL
MONA 98765-12871 CALL GIRLS IN LUDHIANA LUDHIANA CALL GIRL
 
It will be International Nurses' Day on 12 May
It will be International Nurses' Day on 12 MayIt will be International Nurses' Day on 12 May
It will be International Nurses' Day on 12 May
 
Lucknow 💋 Escorts in Lucknow - 450+ Call Girl Cash Payment 8923113531 Neha Th...
Lucknow 💋 Escorts in Lucknow - 450+ Call Girl Cash Payment 8923113531 Neha Th...Lucknow 💋 Escorts in Lucknow - 450+ Call Girl Cash Payment 8923113531 Neha Th...
Lucknow 💋 Escorts in Lucknow - 450+ Call Girl Cash Payment 8923113531 Neha Th...
 
Progress Report - Oracle Database Analyst Summit
Progress  Report - Oracle Database Analyst SummitProgress  Report - Oracle Database Analyst Summit
Progress Report - Oracle Database Analyst Summit
 
Mysore Call Girls 8617370543 WhatsApp Number 24x7 Best Services
Mysore Call Girls 8617370543 WhatsApp Number 24x7 Best ServicesMysore Call Girls 8617370543 WhatsApp Number 24x7 Best Services
Mysore Call Girls 8617370543 WhatsApp Number 24x7 Best Services
 
HONOR Veterans Event Keynote by Michael Hawkins
HONOR Veterans Event Keynote by Michael HawkinsHONOR Veterans Event Keynote by Michael Hawkins
HONOR Veterans Event Keynote by Michael Hawkins
 
VIP Call Girls In Saharaganj ( Lucknow ) 🔝 8923113531 🔝 Cash Payment (COD) 👒
VIP Call Girls In Saharaganj ( Lucknow  ) 🔝 8923113531 🔝  Cash Payment (COD) 👒VIP Call Girls In Saharaganj ( Lucknow  ) 🔝 8923113531 🔝  Cash Payment (COD) 👒
VIP Call Girls In Saharaganj ( Lucknow ) 🔝 8923113531 🔝 Cash Payment (COD) 👒
 
Call Girls In Panjim North Goa 9971646499 Genuine Service
Call Girls In Panjim North Goa 9971646499 Genuine ServiceCall Girls In Panjim North Goa 9971646499 Genuine Service
Call Girls In Panjim North Goa 9971646499 Genuine Service
 
Unlocking the Secrets of Affiliate Marketing.pdf
Unlocking the Secrets of Affiliate Marketing.pdfUnlocking the Secrets of Affiliate Marketing.pdf
Unlocking the Secrets of Affiliate Marketing.pdf
 
VVVIP Call Girls In Greater Kailash ➡️ Delhi ➡️ 9999965857 🚀 No Advance 24HRS...
VVVIP Call Girls In Greater Kailash ➡️ Delhi ➡️ 9999965857 🚀 No Advance 24HRS...VVVIP Call Girls In Greater Kailash ➡️ Delhi ➡️ 9999965857 🚀 No Advance 24HRS...
VVVIP Call Girls In Greater Kailash ➡️ Delhi ➡️ 9999965857 🚀 No Advance 24HRS...
 
7.pdf This presentation captures many uses and the significance of the number...
7.pdf This presentation captures many uses and the significance of the number...7.pdf This presentation captures many uses and the significance of the number...
7.pdf This presentation captures many uses and the significance of the number...
 

Sebastien page-pimco

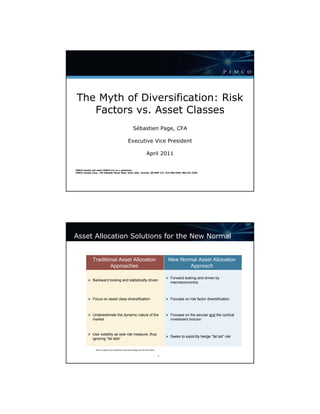
  • 1. The Myth of Diversification: Risk Factors vs. Asset Classes Sébastien Page, CFA Executive Vice President April 2011 PIMCO Canada will retain PIMCO LLC as a subadvisor. PIMCO Canada Corp., 120 Adelaide Street West, Suite 1901, Toronto, ON MSH 1T1, 416-368-3350, 866-341-3350 Asset Allocation Solutions for the New Normal Traditional Asset Allocation New Normal Asset Allocation Approaches Approach Forward looking and driven by Backward looking and statistically driven macroeconomics Focus on asset class diversification Focuses on risk factor diversification Underestimate the dynamic nature of the Focuses on the secular and the cyclical market investment horizon Use volatility as sole risk measure, thus Seeks to explicitly hedge “fat tail” risk ignoring “fat tails” Refer to Appendix for additional investment strategy and risk information. 1 asset_allocation_phil_05
  • 2. Viewing Risk Through a Different Lens Stocks Equity Value / Equity Size Momentum Volatility Liquidity … (Developed) Growth Industry Bonds Yield Fixed Nominal Real Equity Curve Income Volatility Liquidity Duration Duration … (Developed) Duration Spreads 2 2cs_FE_Risk_Factor_Short Risk Factor vs. Asset Class Correlations Average Cross Correlations (March 31, 1997 - January 31, 2011) 70% 59% 60% Full Sample 50% Quiet Turbulent* 40% Percent (%) 40% 30% 30% 20% 10% 4% 3% 4% 0% Risk Factor Correlations Asset Class Correlations Hypothetical example for illustrative purposes only. SOURCE: Windham Portfolio Advisors; PIMCO DataStream; Size, Value, and Momentum from Barra. Risk Factors: Equity, Size, Value, Momentum, Duration, 2-10 Slope, 10-30 Slope, EM Spread, Mortgage Spread, Corp Spread, Swap Spread, Real Estate, Commodity. Asset class correlations calculated using the following indices: MSCI US Small Cap 1750, MSCI US Large Cap 300, MSCI Emerging Markets, MSCI World ex-US, BarCap U.S. Aggregate Index, Dow-Jones U.S. Select REIT Index, S&P GSCI Index * To calculate turbulence, we measured the multivariate distance between N return observations scaled by the corresponding risk factor covariance matrix. The 15% most turbulent months were considered turbulent. All other months were labeled as “quiet.” Refer to Appendix for additional correlation, hypothetical example, and index information. 3
  • 3. Asset Class Diversification Does Not Equate To Risk Diversification As of December 31, 2010 Market Value Allocation Risk Allocation (NACUBO >$1 billon portfolio) Cash Distressed Domestic 3% Commodity Other Natural Debt Equities 7% 1% Resources 3% 14% Currency 7% 3% Int'l Equities Venture 8% Capital Corporate 5% Spread EM Equities 10% 4% Private Equity Domestic 13% Bonds 9% Int'l Bonds Equity Hedge Funds 1% 79% 24% Real Estate 8% SOURCE: 2009 NACUBO-Commonfund Study of Endowments, PIMCO. Hypothetical example for illustrative purposes only. Refer to Appendix for additional hypothetical example and portfolio analysis information. 4 asset_allocation_review_19 Left Tail Events Tend to Occur More Frequently than “Normal” Distributions Predict Normal Distribution “Fat-Tail” Distribution Frequency of Events Higher Probability Of Big Losses Losses Gains SOURCE: PIMCO, Benoit Mandelbrot. Sample for illustrative purposes only. 6 asset_allocation_review_12
  • 4. One “Bad Year” Can Erase the Gains From Many “Good Years” 10 Year Annual Returns Factoring in a 10th “Bad Year” -15% -20% -25% 8% 5.4%* 4.8% 4.1% 10% 7.2% 6.5% 5.9% Average Returns for 9 “Good Years” 12% 8.9% 8.2% 7.6% 14% 10.7% 10.0% 9.3% SOURCE: PIMCO Hypothetical example with hypothetical returns for illustrative purposes only * Sample calculation can be applied to all examples: 5.44% = ((1+8%)^9*(1-15%))^0.1 – 1. If calculated using the formula given this would be the annual return of a portfolio that generates 8% /year for 9 years and followed by a -15% drawdown in the 10th year. Refer to Appendix for additional hypothetical example information. 7 asset_allocation_review_17 Explicit Hedging of Tail Risk Return Distribution Based on Portfolio Factor Exposures + 100 bps spent on 1 year S&P 500 Put with 25% Return Distribution Based on Portfolio Factor Exposures Implied Volatility NAC UBO Portfolio NAC UBO Hedged Normal Distribution Normal Distribution Probability Density Probability Density -50% -40% -30% -20% -10% 0% 10% 20% 30% 40% 50% -50% -40% -30% -20% -10% 0% 10% 20% 30% 40% 50% Annual Return Annual Return Assumptions: S&P 500 put option with 1 year maturity, 25% S&P 500 index implied volatility, risk free rate of zero. Solve for the price that is equal to the tail risk budget (1%) and simulate the returns. If the value of the index falls below strike, then put option value rises and adds to portfolio returns SOURCE: 2009 NACUBO-Commonfund Study of Endowments, PIMCO. Using NACUBO portfolio as of December 31, 2010 Hypothetical example for illustrative purposes only. Refer to Appendix for additional hypothetical example, index, investment strategy, risk, and portfolio analysis information. 8 asset_allocation_review_24
  • 5. Regime Specific Correlations AUD-Equity and JPY-Equity Correlations as a Function of Equity Returns 100% 80% AUD 60% 40% 20% Correlation 0% -20% JPY -40% -60% -80% -100% -10% -5% 0% 5% 10% Equity Return Threshold (Equities Returning x Percent or Less in a Month) SOURCE: Equity returns from Barra’s equity factor, AUD and JPY returns from Windham Portfolio Advisor Hypothetical example for illustrative purposes only. Using monthly data from March 1994 to December 2009 Different time periods will produce different results. Refer to the Appendix for additional correlation, hypothetical example and risk information. 9 Asset Allocation Solutions for the New Normal Traditional Asset Allocation New Normal Asset Allocation Approaches Approach Forward looking and driven by Backward looking and statistically driven macroeconomics Focus on asset class diversification Focuses on risk factor diversification Underestimate the dynamic nature of the Focuses on the secular and the cyclical market investment horizon Use volatility as sole risk measure, thus Seeks to explicitly hedge “fat tail” risk ignoring “fat tails” Refer to Appendix for additional investment strategy and risk information. 10 asset_allocation_phil_05
  • 6. Appendix Past performance is not a guarantee or a reliable indicator of future results. Correlation The correlation of various indices or securities against one another or against inflation is based upon data over a certain time period. These correlations may vary substantially in the future or over different time periods that can result in greater volatility. Endowment Style Portfolio Index Sources US Equities are represented by the S&P 500, International Equities are represented by the MSCI EAFE Net Dividend Index in USD, EM Equities is represented by the MSCI Emerging Markets Index, US Bonds are represented by the Barclays Capital US Aggregate Index, Global Bonds are represented by the Barclays Global Aggregate (USD Hedged) Index, Commodities are represented by the Dow Jones UBS Commodity TR Index, REITs are represented by NCREIF Property Index, Absolute Return is represented by the HFRI Fund Weighted Composite Index, Private Equity is represented by the Cambridge Associates LLC U.S. Private Equity Index®, Venture Capital is represented by the Cambridge Associates LLC U.S. Venture Capital Index® Hypothetical Example No representation is being made that any account, product, or strategy will or is likely to achieve profits, losses, or results similar to those shown. Hypothetical or simulated performance results have several inherent limitations. Unlike an actual performance record, simulated results do not represent actual performance and are generally prepared with the benefit of hindsight. There are frequently sharp differences between simulated performance results and the actual results subsequently achieved by any particular account, product, or strategy. In addition, since trades have not actually been executed, simulated results cannot account for the impact of certain market risks such as lack of liquidity. There are numerous other factors related to the markets in general or the implementation of any specific investment strategy, which cannot be fully accounted for in the preparation of simulated results and all of which can adversely affect actual results. Investment Strategy There is no guarantee that these investment strategies will work under all market conditions and each investor should evaluate their ability to invest for a long-term especially during periods of downturn in the market. No representation is being made that any account, product, or strategy will or is likely to achieve profits, losses, or results similar to those shown. 11 asset_allocation_app_01 Appendix Portfolio Analysis The portfolio analysis is based on the 2009 NACUBO-Commonfund Study of Endowments Average Endowment Style Portfolio and no representation is being made that the structure of the average portfolio or any account will remain the same or that similar returns will be achieved. Results shown may not be attained and should not be construed as the only possibilities that exist. Actual results will vary and are subject to change with market conditions. There is no guarantee that results will be achieved. No fees or expenses were included in the estimated results and distribution. The scenarios assume a set of assumptions that may, individually or collectively, not develop over time. The analysis reflected in this information is based upon data at time of analysis. Forecasts, estimates, and certain information contained herein are based upon proprietary research and should not be considered as investment advice or a recommendation of any particular security, strategy or investment product. Risk Derivatives may involve certain costs and risks such as liquidity, interest rate, market, credit, management and the risk that a position could not be closed when most advantageous. Investing in derivatives could lose more than the amount invested. The strategy seeks to hedge against tail events and achieve its investment objective by entering into financial derivatives (including, options, swaps and other derivative instruments) that are expected to increase in value during the occurrence of tail events. If a tail event occurs, the strategy may lose any delivery of instruments or other collateral pledged as security due to the potential systemic import of the tail event adversely affecting the portfolio positions. The strategy risks the loss of all or a portion of the value of the tail event instruments it may purchase or the derivative contracts it may enter into, even if a period of severe market stress occurs during the term of such securities. A tail event is unpredictable; therefore, investments in instruments tied to the occurrence of a tail event are speculative. Suitable derivative transactions may not be available in all circumstances. The use of these strategies involves certain special risks, including a possible imperfect correlation, or even no correlation, between price movements of derivative instruments and price movements of related investments. The strategy may suffer losses due to the possible inability of the strategy to purchase or sell the security at a time that otherwise would be favorable or the possible need to sell the security at a disadvantageous time because the strategy is required to maintain collateral or offsetting positions in connection with transactions in derivative instruments, and the possible inability of the strategy to close out or to liquidate its derivatives positions. In addition, the strategy’s use of such instruments may cause the strategy to realize higher amounts of short-term capital gains (generally taxed at ordinary income tax rates) than if it had not used such instruments. If the strategy gains exposure to an asset class using derivative instruments backed by a collateral portfolio of fixed income instruments, changes in the value of the fixed income instruments may result in greater or lesser exposure to that asset class than would have resulted from a direct investment in securities comprising that asset class. Derivatives are currently the subject of regulatory and statutory proposals, both in the U.S. and internationally. There can be no assurance that the enactment of rules or regulations in the future will not have an adverse effect on the strategy’s ability to carry out its investment strategy or to do so at a reasonable cost. This material contains the current opinions of the manager and such opinions are subject to change without notice. This material has been distributed for informational purposes only and should not be considered as investment advice or a recommendation of any particular security, strategy or investment product. Information contained herein has been obtained from sources believed to be reliable, but not guaranteed. No part of this material may be reproduced in any form, or referred to in any other publication, without express written permission. ©2011, PIMCO. The products and services provided by PIMCO Canada Corp. may only be available in certain provinces or territories of Canada and only through dealers authorized for that purpose. PIMCO Canada Corp., 120 Adelaide Street West, Suite 1901, Toronto, ON MSH 1T1, 416-368-3350, 866-341-3350. 12 asset_allocation_app_01
  • 7. Appendix Index Description Barclays Capital Global Aggregate (USD Hedged) Index provides a broad-based measure of the global investment-grade fixed income markets. The three major components of this index are the U.S. Aggregate, the Pan-European Aggregate, and the Asian-Pacific Aggregate Indices. The index also includes Eurodollar and Euro-Yen corporate bonds, Canadian Government securities, and USD investment grade 144A securities. Barclays Capital U.S. Aggregate Index represents securities that are SEC-registered, taxable, and dollar denominated. The index covers the U.S. investment grade fixed rate bond market, with index components for government and corporate securities, mortgage pass-through securities, and asset-backed securities. These major sectors are subdivided into more specific indices that are calculated and reported on a regular basis. Barclays Capital U.S. TIPS Index is an unmanaged market index comprised of all U.S. Treasury Inflation Protected Securities rated investment grade (Baa3 or better), have at least one year to final maturity, and at least $250 million par amount outstanding. Performance data for this index prior to 10/97 represents returns of the Barclays Capital Inflation Notes Index. The Cambridge Associates U.S. Private Equity Index is based on returns data representing nearly two-thirds of leveraged buyout, subordinated debt, and special- situations partnerships since 1986. The Cambridge Associates LLC U.S. Venture Capital Index is based on returns data compiled on funds representing over 80% of the total dollars raised by U.S. venture capital managers between 1981 and 2001. Cambridge Associates LLC calculates the pooled net time-weighted return by quarter from March 31, 1981 through the most recent quarter. The pooled means represent the time-weighted rates of return calculated on the aggregate of all cash flows and market values as reported by the General Partners to Cambridge Associates LLC in their quarterly and annual audited financial reports. Net returns exclude all management fees, expenses and performance fees that take the form of a carried interest. The Dow Jones Industrial Average (DJIA) is a price-weighted average of 30 actively traded “blue chip” stocks, primarily industrials, but including financials and other service-oriented companies as well. The components, which change from time to time, represent between 15% and 20% of the market value of NYSE stocks. The Dow Jones UBS Commodity Total Return Index is an unmanaged index composed of futures contracts on 19 physical commodities. The index is designed to be a highly liquid and diversified benchmark for commodities as an asset class. Prior to May 7, 2009, this index was known as the Dow Jones AIG Commodity Total Return Index. 13 asset_allocation_app_01 Appendix The HFRI Fund Weighted Composite Index is comprised of over 2000 domestic and offshore constituent funds. All funds report assets in USD and report net of fees returns on a monthly basis. There is no Fund of Funds included in the index and each has at least $50 million under management or have been actively trading for at least twelve months. JPMorgan GBI Global (Unhedged) is an unmanaged market index representative of the total return performance in U.S. dollars on an unhedged basis of major world bond markets. The MSCI EAFE (Morgan Stanley Capital International Europe, Australasia, Far East Index) is an unmanaged index of over 900 companies, and is a generally accepted benchmark for major overseas markets. Index weightings represent the relative capitalizations of the major overseas markets included in the index on a U.S. dollar adjusted basis. MSCI EAFE Net Dividend Index (USD Unhedged) is an unmanaged index of issuers in countries of Europe, Australia, and the Far East represented in U.S. Dollars on an unhedged basis. The index does not reflect deductions for fees, expenses or taxes. The Morgan Stanley Capital International Emerging Markets Index is an unmanaged index that measures equity market performance in the global emerging markets. As of May 2005, the Emerging Markets Index (float-adjusted market capitalization index) consisted of indices in 26 emerging countries: Argentina, Brazil, Chile, China, Colombia, Czech Republic, Egypt, Hungary, India, Indonesia, Israel, Jordan, Korea, Malaysia, Mexico, Morocco, Pakistan, Peru, Philippines, Poland, Russia, South Africa, Taiwan, Thailand, Turkey, and Venezuela. The Morgan Stanley Capital International World Index is an unmanaged market-weighted index that consists of over 1,200 securities traded in 22 of the world’s most developed countries. Securities are listed on exchanges in the US, Europe, Canada, Australia, New Zealand, and the Far East. The index is calculated separately; without dividends, with gross dividends reinvested and estimated tax withheld, and with gross dividends reinvested, in both U.S. Dollars and local currency. The NCREIF (National Council of Real Estate Investment Fiduciaries) Property Index is a quarterly time series composite total rate of return measure of performance of a very large pool of individual commercial real estate properties acquired in the private market for investment purposes only. The S&P 500 Index is an unmanaged market index generally considered representative of the stock market as a whole. The index focuses on the Large-Cap segment of the U.S. equities market. It is not possible to invest directly in an unmanaged index. 14 asset_allocation_app_01