
Recomendados
Más contenido relacionado
Más de Greg Hanchin
Más de Greg Hanchin (20)
Último
Último (20)
Splunk event correlation_tech_brief
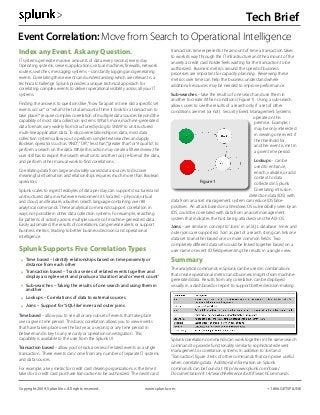
- 1. Index any Event. Ask any Question. IT systems generate massive amounts of data every second, every day. Operating systems, servers, applications, virtual machines, firewalls, network routers, switches, messaging systems – constantly logging and generating events. Correlating these events and understanding which are relevant is a technical challenge. Splunk provides a unique technical approach for correlating complex events to deliver operational visibility across all your IT systems. Finding the answers to questions like,“how far apart in time did a specific set events occur?”or“what’s the total amount of time it took for a transaction to take place?”require complex correlation of multiple data sources beyond the capability of most data collection systems. What’s more, machine-generated data formats vary widely from structured Syslog to SNMP to unstructured multi-line application data. To discover relationships in data, most data collection systems allow you to perform simple text searches and apply Boolean operators such as“AND”,“OR”,“less than”,”greater than”or“equal to”, to perform a search on the data. While this action may create a filtered view, the user still has to export the search results into another tool, re-format the data, and perform other manual work to find correlations. Correlating data from large and widely varied data sources to discover meaningful information and relationships requires much more than Boolean operators. Splunk scales to ingest terabytes of data per day, can support structured and unstructured data in whatever environment it’s located – physical, virtual and cloud, and features a built-in search language containing over 80 analytical commands. These analytical commands support correlation in ways not possible in other data collection systems. For example, searching for patterns of activity across multiple sources of machine-generated data. Easily automated, the results of correlations can generate alerts or support business metrics, leading to better business decisions and operational intelligence. Splunk Supports Five Correlation Types ‣ Time based – Identify relationships based on time proximity or distance from each other ‣ Transaction based – Track a series of related events together and display a single event and produce a‘duration’and/or‘event count’ ‣ Sub-searches – Taking the results of one search and using them in another ‣ Lookups – Correlations of data to external sources ‣ Joins – Support for ‘SQL-like’inner and outer joins Time based – allow you to see all or any subset of events that take place over a given time period. This basic correlation allows you to view events that have taken place over the last year, a second, or any time period in between and is key to any security or operations investigation. This capability is available to the user from the Splunk UI. Transaction based – allow you to track a series of related events as a single transaction. These events can come from any number of separate IT systems and data sources. For example, a key metric for credit card clearing organizations is the time it takes for a credit card purchase transaction to be authorized. The credit card transaction time represents the amount of time a transaction takes to work its way through the IT infrastructure and the amount of the anxiety a credit card holder feels waiting for the transaction to be authorized. Business metrics around the speed of business processes are important for capacity planning. Reviewing these metrics over time can help the business understand where additional resources may be needed to improve performance. Sub-searches – take the results of one search and use them in another to create if/then conditions (Figure 1). Using a sub-search allows users to see the results of a search only if a set of other conditions are met (or not). Security Event Management Systems operate on this premise. Example, I may be only interested in viewing one event if the threshold for another event is met in a given time period. Lookups – can be used to enhance, enrich, validate, or add context to data collected in Splunk. Correlating intrusion detection data (IDS) with data from an asset management system can reduce IDS false- positives. An attack based on a Windows OS vulnerability seen by an IDS, could be correlated with data from an asset management. system that indicates the host being attacked runs the AIX OS. Joins – are similar in concept to‘Joins’ in an SQL database. Inner and outer joins are supported. ‘Join’as part of a search string can link one data set to another based one or more common fields. Two completely different data sets could be linked together based on a user name or event ID field presenting the results in a single view. Summary The analytical commands in Splunk can be used in combinations that create operational metrics and business insights from machine- generated data. Results from any correlation can be displayed visually in a dashboard or report to support better decision-making. Splunk correlation commands can work together in the same search command to provide functionality similar to sophisticated event management or correlation systems. In addition to‘Join’and ‘Transaction’, figure 2 lists of other commands that can prove useful when correlating data. Additional information on Splunk commands can be found at: http://www.splunk.com/base/ Documentation/4.1.4/SearchReference/ListOfSearchCommands Copyright 2009, Splunk Inc. All rights reserved. www.splunk.com +1.866.GET.SPLUNK Event Correlation: Move from Search to Operational Intelligence Tech Brief Figure 1 !