Geometry Test Results Histogram
•
8 recomendaciones•68,807 vistas

This presentation shows how to draw a Histogram Graph were data is grouped into Class Intervals or Classes. To obtain a PowerPoint format download of this presentation, go to the following page: http://passyworldofmathematics.com/pwerpoints/

Recomendados
Más contenido relacionado
La actualidad más candente
La actualidad más candente (20)
Más de Passy World
Más de Passy World (20)
Último
Último (20)
Geometry Test Results Histogram
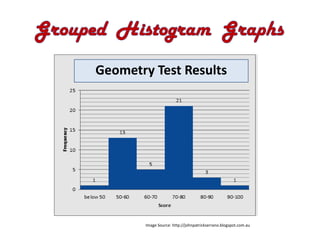
- 1. Geometry Test Results Image Source: http://johnpatrickserrano.blogspot.com.au
- 2. In any Histogram, people need a simple and easy to read graph, which has between 5 and 10 bars. (This can be done by using “Class Intervals” or “Bins”). Geometry Test Results The Geometry Test Results histogram would be far too big if we charted each of the 30 or so result scores on a separate bar for each score. We have created a graph which is smaller and manageable, (with only 6 bars instead of 30 or more). Image Source: http://johnpatrickserrano.blogspot.com.au
- 3. “Class Intervals”, “Class Width”, “Classes”, “Bar Width” and “Bins” all refer to the idea of grouping numerical data into equal width groups. We can then count how many of our items belong in each group. The Geometry Test Results histogram contains “Groups of 10” : Geometry Test Results 50 – 60 which is scores from 50 to 59 60 – 70 which is scores from 60 to 69 and so on. Use your fingers to count: 50, 51, 52, 53, 54, 55, 56, 57, 58, 59 Image Source: http://johnpatrickserrano.blogspot.com.au is a group of TEN . ( eg. 50 to 59 is more than nine items! ).
- 4. The following data relates to how many Cappuccino Coffees were made at a Café every hour during two full working days. 4, 9, 9, 11, 3, 9, 10, 17, 12, 6, 18, 0, 5, 11, 9, 12, 11, 15 First we rewrite the numbers from lowest to highest: 0, 3, 4, 5, 6, 9, 9, 9, 9, 10, 11, 11, 11, 12, 12, 15, 17, 18 We have 12 different number values, but ten different values is the maximum for a Histogram containing 10 bars. So we need to do grouping into “Classes” to reduce this.
- 5. Cappuccino Coffees made at a Café every hour: 0, 3, 4, 5, 6, 9, 9, 9, 9, 10, 11, 11, 11, 12, 12, 15, 17, 18 For a Histogram containing 10 bars: Class Width = (Highest Item – Lowest Item) ÷ 10 = (18 – 0) ÷ 10 = 1.8 which rounds off to 2 . Image Source: http://cutestfood.com The ten Classes of width size 2 we need are : 0-1, 2-3, 4-5, 6-7, 8-9, 10-11, 12-13, 14-15, 16-17, 18-19
- 6. Cappuccino Coffees made at a Café every hour: 0, 3, 4, 5, 6, 9, 9, 9, 9, 10, 11, 11, 11, 12, 12, 15, 17, 18 For a Histogram containing 5 bars: Class Width = (Highest Item – Lowest Item) ÷ 5 = (18 – 0) ÷ 5 = 3.6 which rounds off to 4 . The five Classes of width size 4 we need are : 0-3, 4-7, 8-11, 12-15, 16-19 (remember to count on fingers) Image Source: http://blogspot.com
- 7. Cappuccino Coffees made at a Café every hour: 0, 3, 4, 5, 6, 9, 9, 9, 9, 10, 11, 11, 11, 12, 12, 15, 17, 18 For a Histogram containing 5 bars, we need these classes: 0-3, 4-7, 8-11, 12-15, 16-19 We can count our items into these groups to make the following: Number of Cups Tally Frequency of Cappuccino 0-3 // 2 4-7 /// 3 8 - 11 //// /// 8 12 - 15 /// 3 16 - 19 // 2 Image Source: http://www.espressospot.com
- 8. We now use our five class Frequency Table to create a Histogram graph of the Cappuccino Coffee Statistics. Number of Freq Cappuccinos 0-3 2 8 4-7 3 6 8 – 11 8 12 - 15 3 4 16 - 19 2 2 0 0–3 Number of Cappuccinos Made Per Hour Image Source: http://www.blogspot.com