How much does a great accounting function cost
•
1 recomendación•796 vistas

The document summarizes findings from a study on accounting and reporting (A&R) functions conducted by CEB Finance Leadership Council. The study found that high-performing A&R teams spend less on average as a percentage of revenue than average or low-performing teams, while providing higher levels of service in accuracy, frequency, and detail of reporting. Specifically: - High-performing A&R teams spend an average of 0.37% of revenue on the function compared to 0.50% for average teams and 1.00% for low performers. - They provide reporting with greater detail, frequency, accuracy, and customization than average teams, though not necessarily faster speed. -

Recomendados
Recomendados
Más contenido relacionado
La actualidad más candente
La actualidad más candente (20)
Destacado
Similar a How much does a great accounting function cost
Similar a How much does a great accounting function cost (20)
Último
Último (20)
How much does a great accounting function cost
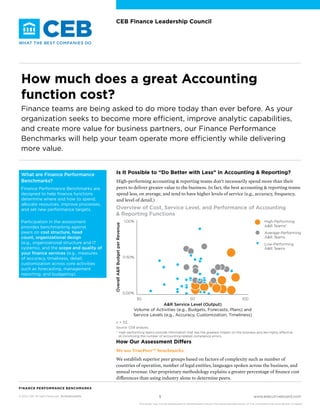
- 1. CEB Finance Leadership Council How much does a great Accounting function cost? Finance teams are being asked to do more today than ever before. As your organization seeks to become more efficient, improve analytic capabilities, and create more value for business partners, our Finance Performance Benchmarks will help your team operate more efficiently while delivering more value. Finance Performance Benchmarks are designed to help finance functions determine where and how to spend, allocate resources, improve processes, and set new performance targets. Participation in the assessment provides benchmarking against peers on cost structure, head count, organizational design (e.g., organizational structure and IT systems), and the scope and quality of your finance services (e.g., measures of accuracy, timeliness, detail, customization across core activities such as forecasting, management reporting, and budgeting). Is It Possible to “Do Better with Less” in Accounting & Reporting? High-performing accounting & reporting teams don’t necessarily spend more than their peers to deliver greater value to the business. In fact, the best accounting & reporting teams spend less, on average, and tend to have higher levels of service (e.g., accuracy, frequency, and level of detail.) Overview of Cost, Service Level, and Performance of Accounting & Reporting Functions Overall A&R Budget per Revenue What are Finance Performance Benchmarks? 1.00% High-Performing A&R Teamsa Average-Performing A&R Teams Low-Performing A&R Teams 0.50% 0.00% 50 30 100 A&R Service Level (Output) Volume of Activities (e.g., Budgets, Forecasts, Plans) and Service Levels (e.g., Accuracy, Customization, Timeliness) n = 53. Source: CEB analysis. a High-performing teams provide information that has the greatest impact on the business and are highly effective at minimizing the number of accounting-related compliance errors. How Our Assessment Differs We use TruePeer™ benchmarks. We establish superior peer groups based on factors of complexity such as number of countries of operation, number of legal entities, languages spoken across the business, and annual revenue. Our proprietary methodology explains a greater percentage of finance cost differences than using industry alone to determine peers. Finance performance benchmarks © 2014 CEB. All rights Reserved. FLC8146114SYN 1 www.executiveboard.com This study may not be reproduced or redistributed without the expressed permission of The Corporate Executive Board Company.
- 2. The Best Accounting & Reporting Teams Have Relatively Fewer FTEs Benchmark Your Whole Department Finance Performance Benchmarks provide specific analysis for these sub-functions: ■■ FP&A ■■ Tax ■■ Treasury Accounting & Reporting FTEs Budget per Revenue for All Accounting & Reporting Teams Compared to High-Performing Teams FTEs per Billion in Revenue for All Accounting & Reporting Teams Compared to High-Performing Teams 1.00% 40 Accounting and Reporting ■■ Accounting & Reporting Spend ■■ 20 30.75 0.37% Transaction Processing ■■ 0.50% Investor Relations 0.11% 0.00% Overall A&R Spend HighPerforming Teams Overall A&R FTE 0.21% Median 7.42 0 0.20% 10.79 16.02 Source: CEB analysis. Source: CEB analysis. Accounting & Reporting Spend by Activity All Accounting & Reporting Teams Compared to High-Performing Teams External Reporting/Financial Accounting Internal Reporting/Cost Accounting High-Performing A&R Teams 54% 46% All A&R Teams 53% 47% 0% 50% 100% n = 77. Member Reaction “Traditionally, we have used benchmarks to justify cost-cutting initiatives. The analysis provided by CEB allows us to not only target spending, but to focus on maximizing the impact of our highest value activities by having a better picture for how and where to allocate staff at various levels.” Source: CEB analysis. Budgets and Head Count Insights for Accounting & Reporting ■■ ■■ The overall budget for high-performing teams is a similar portion of revenue compared their peers; however, the overall FTE count for high performing teams is a lower portion of revenue compared to their peers. Our analysis indicates that high-performing teams are more centralized, engage in greater amounts of offshoring, and are allocated a greater portion of high-potential employees than their peers. VP of Finance Financial Services Company Finance performance benchmarks © 2014 CEB. All rights Reserved. FLC8146114SYN 2 www.executiveboard.com This study may not be reproduced or redistributed without the expressed permission of The Corporate Executive Board Company.
- 3. High-Performing Accounting & Reporting Teams Offer Substantially Higher Levels of Service C ase in Point: ANZ Tiered Services to Align Itself With Business Units That Drive Growth ■■ ■■ Accounting Reporting Service Level All Accounting Reporting Teams Compared to High-Performing Accounting Reporting Teams All AR Teams The Australia and New Zealand Banking Group (ANZ) transformed its finance function to overcome the challenge of operating in a slow growth environment. Finance realized that of the current set of services it provides to the business, not all of them added value, yet each one carried a cost. As a result, Finance segmented business units into five categories based on growth potential and reduced support to low-value business units. This allowed the finance team to align services with businesses that significantly drive overall growth for the organization. High-Performing AR Teams Level of Detail 1 = Minimum level of service detail 7 = Include any and all information available Speed Frequency 1 = Service often not timely 7 = Service exceeds timeliness expectations Level of Customization 1 = Standardized support only 7 = Customization provided to all customers 1 = ervice provided only S as needed 7 = eal-time services R provided Accuracy 1 = nly directionally correct O 7 = 100% accurate n = 77. Source: CEB analysis. How to Use This Chart This chart highlights the service strategy taken by high-performing accounting reporting teams. In the spider diagram, the farther the line stretches toward the exterior of the diagram, the greater the service level against that particular attribute. Service Level Insights for Accounting Reporting ■■ ■■ ■■ High performing teams provide services with greater level of detail, frequency, accuracy, and customization than their peers. High-performing teams do not provide services to the business with greater speed. Accounting Reporting teams that seek to create more value for business partners and minimize the number of accounting related compliance errors should increase the level of detail, frequency, accuracy, and level of customization than they currently do, but this should only be done to support the most critical activities. Finance performance benchmarks © 2014 CEB. All rights Reserved. FLC8146114SYN 3 www.executiveboard.com This study may not be reproduced or redistributed without the expressed permission of The Corporate Executive Board Company.
- 4. The Best Accounting Reporting Teams Provide Greater Detail How to Use This Page This page provides a closer look at three service strategy attributes: frequency, time horizon, and level of advisory support. Attributes highlighted in the tables represent metrics that differed between all accounting reporting teams and high-performing accounting reporting teams. Service Level Dimensions for Accounting Reporting Detail 1 = Bare minimum level | 7 = All relevant detail Metric All AR Teams 5.5 Overall Score High-Performing AR Teams 6.4 4.3 4.0 5.0 4.8 Levels of Internal Reporting Drilldown 1 = nformation provided only at consolidated enterprise level I 3 = Information provided at the business unit level 5 = information provided at the production line level Ad Hoc Reporting Detail 1 = Direct pull of data from reporting system 3 = Multiple sets of data from multiple sources/systems 5 = Multiple set of data, sorted, and synthesized 7 = Multiple sources, sorted, synthesized, and cleaned High-performing AR teams provide greater amounts of detail than their peers. Frequency 1 = Only as needed | 7 = Real-time service Metric All AR Teams 5.4 5.1 4.2 4.4 6.0 Overall Score High-Performing AR Teams 6.3 Frequency of Ad Hoc Reporting Requests 1 = Every couple of weeks 3 = Every week or so 5 = Every couple of days 7 = Every day Frequency of Responses to Ad Hoc Requests 1 = Never 3 = Sometimes 5 = Most of the time 7 = Always High-performing AR teams tend to provide services less frequently than their peers, freeing up resources to include more detail or ensure a higher level of accuracy. Advisory Support 1 = Completely standardized services | 7 = Completely customized services Metric All AR Teams 5.1 Overall Score High-Performing AR Teams 5.0 6.0 6.3 Ad Hoc Reporting Request Fulfillment 1 = e do not provide any custom ad hoc reporting—only W direct to existing reports 3 = Provide ad hoc report if existing report is unable to fulfil 80% of the request Additional Dimensions Assessed Through the Finance Performance Benchmarks ■■ Speed (days to close, collect information) ■■ Accuracy (data and reporting) 5 = Provide ad hoc report if existing report is unable to fulfil 90% of the request 7 = Provide ad hoc report if existing report is unable to fulfil 95% of the request High-performing AR teams provide the same level of customization as their peers, but provide less support to ad hoc reporting requests. n = 77. Source: CEB analysis. Finance performance benchmarks © 2014 CEB. All rights Reserved. FLC8146114SYN 4 www.executiveboard.com This study may not be reproduced or redistributed without the expressed permission of The Corporate Executive Board Company.
- 5. Next Step: Use Finance Performance Benchmarks with Your AR Team Finance Performance Benchmarks are a feature of CEB Finance Leadership Council. Members who participate can expect: ■■ ■■ ■■ ■■ A customized report using TruePeer™ Benchmarks that assesses the overall finance function and six sub-functions including FPA, Accounting Reporting, Tax, Transaction Processing, Treasury, and Investor Relations Individual guidance to ensure company data is accurately recorded and reflected in the report Consultation from CEB’s Executive Advisors™ who will walk through the results with your senior finance leaders during a live or virtual meeting and recommend ways to take out costs or add more value Access to our resources (e.g., best practices, training, executive meetings) aimed at implementing the recommendations coming out of your report How Long Does It Take to Participate? Participation takes roughly eight hours total, most of which can be delegated to a budget analyst. The assessment requires roughly two hours of executive time to answer qualitative questions about processes, services, and value delivered to the business. The entire assessment can be done online, and a report can be generated within one week of completing the assessment. What Is CEB Finance Leadership Council? One of 50 function-specific programs at CEB, we aim to serve finance executives who desire to improve the performance of their function and develop their staff. We offer participation in Finance Performance Benchmarks as well as support in the following five areas: 1. Finance Function Performance Management 2. Finance Organizational Structure and Role Design 3. Finance Talent Development 4. Finance Information Technology 5. Enterprise Capital and Cost Management Member Reaction “Seeing that our company was spending more and providing more services than our peers was insightful, but even more valuable was the revelation that we were not as valuable as peers for all the effort.” VP of Finance Information Technology Company Finance performance benchmarks © 2014 CEB. All rights Reserved. FLC8146114SYN 5 www.executiveboard.com This study may not be reproduced or redistributed without the expressed permission of The Corporate Executive Board Company.
- 6. CEB Finance Leadership Council Membership Features Advisory Support Executive Networking Research and Insight CEB Finance Leadership Council Maximizing the Effectiveness of Your Finance Organization Live and Online Learning Decision and Diagnostic Tools Member Reaction “We’ve been thinking about all the consulting firms to support our transformation efforts. We’ve spent a lot of money with other benchmarking providers over the years, but the CEB report we walked through this week blew them out of the water. It was 10-to-1 in terms of how much we learned and how actionable the results were—and in much less time.” Peer Benchmarking Specific Examples of Support for Benchmarking, Best Practices, and Live and Online Learning Proven Best Practices Peer Benchmarking ■■ Finance Performance Benchmarks: Determine where and how to spend, allocate head count, and set new performance targets. ■■ Business Alignment Tool: Identify and prioritize performance gaps and focus on the activities that matter most to your internal customers. VP of Finance Energy Company Who Is CEB? ■■ CEB is the world’s leading member-based advisory company. With 30 years of experience working with top companies to benchmark, analyze, and apply proven practices to help your team unlock their full potential. Every year we equip more than 16,000 senior leaders from more than 6,000 organizations across 60 countries with the insights and actionable solutions they need to respond quickly to evolving business conditions and transform operations. We do this by combining our advanced research and analytics with best practices from clients across more than 88% of the Fortune 500. ■■ 1 Contact CEB to Learn More Proven Best Practices Finance Talent Test: Assess the completeness of your talent management approach using our behavioral model of finance professionals. Anatomy of a TopPerforming Finance Organization: Set finance strategy by determining which initiatives will have the greatest effect on overall performance. ■■ CUNA Mutual uses business outcomes to quantify the relative importance of different transformation work streams, which enables effective prioritization. ■■ John Deere transforms finance to address the key staffing model risks presented by future changes in its business. ■■ CSX improved its interview structure and rigor by introducing the Influence Screening Interview. ■■ Alpha Company1 teaches staff how to say “no” to lowvalue tasks without jeopardizing business partner relationships. Live and Online Learning ■■ Customized Workshops: Work with our Executive Advisors to create a full-day, customized training workshop on a variety of topics including enterprise cost management, talent development, and developing finance challengers. ■■ Virtual Webinars: Participate in virtual webinars to learn how leading companies solve both common and emerging challenges for Finance. ■■ Online CPE Training: Use our online, CPEaccredited training courses to improve your business acumen or technical expertise. Pseudonym. +1-866-913-8102 flc@executiveboard.com www.executiveboard.com Finance performance benchmarks © 2014 CEB. All rights Reserved. FLC8146114SYN 6 www.executiveboard.com This study may not be reproduced or redistributed without the expressed permission of The Corporate Executive Board Company.