SlideShare una empresa de Scribd logo
1 de 54
Descargar para leer sin conexión
10
Nightlight Map of the World
Credit: NOAA, NASA
11
12
Credit: Topfoto
13
2H
umans are a prolific and op-
portunistic species, among
the most successful of all the
Earth’s inhabitants. As the size
of the human population has increased,
people have spread across the globe into
every imaginable habitat. Throughout
human history, people have demonstrated
an uncanny ability to adapt to and survive
in some very harsh places, including, most
recently, outer space and the ocean—at
least for short periods of time.
As human culture has evolved, people
have developed new ways of living in and
using their environment, and of helping
themselves to all that the Earth has to
offer. Their ability to exploit the Earth’s
seemingly endless resources has been a vi-
tal key to the success of the human species.
However, many major advances in
human culture—from the cultivation of
crops and the development of cities to
modern technologies—have tended to
insulate people from the very environment
that shaped them and upon which they
depend. As a group, people have often
forgotten that for every action taken there
is a reaction, an impact.
The impacts of human activities on
the Earth often have both negative and
positive components. For example, when
people convert forests or grasslands to
cropland they improve the means by
which to feed their ever-growing numbers.
At the same time, they invariably reduce
biological diversity in the converted areas.
Over time, people have rarely been fully
aware of the tremendous change they have
wrought on the Earth or that their success-
es have often been achieved at the expense
of other species and the environment.
Since the early 1970s, many excellent
texts have been written about the plight
of the world (Heywood 1995; Middleton
1997; WRI 2000; Chew 2001; FAO 2001;
Harrison and Pearce 2001; IPCC 2001;
McNeill 2001; UNEP 2002a). This atlas
supplements these works by providing
illustrations of both positive and negative
human-caused changes that have taken
place on the Earth. Satellite images, to-
gether with photographs, provide a unique
view of how people are impacting the ter-
restrial environment and what the conse-
quences of environmental change mean
in terms of human well-being. The images
and the changes they illustrate are diverse.
But they are united by a common message:
environmental change does matter.
The International Conference on
Population and Development Programme
of Action noted that stabilization of world
People and Planet
Human Influences on the Planet
Credit: Topfoto
Credit: Ed Simpson
14
population is crucial to achieving sustain-
able development. Population stabiliza-
tion is also necessary for managing human
impacts on the Earth’s environment and
resources. In 1999, the Earth’s human
population reached 6 000 million, having
grown during the mid-1990s at a rate of 13
per cent per year, with an average annual
addition of 78 million individuals. As of
1999, countries with populations of 100
million or more included China, India, the
United States, Indonesia, Brazil, Pakistan,
the Russian Federation, Bangladesh, Japan,
and Nigeria. According to the medium
variant of the United Nations’ population
estimates and projections, world popula-
tion will reach 7 200 million by the year
2015. Ninety-eight per cent of the popu-
lation increase will take place in less-de-
veloped regions of the world. Africa will
experience, by far, the most rapid rate of
growth (Population Division 2000).
The overall impact that humans have
on the global environment is proportional
to the number of people on the Earth and
the average influence of each individual.
If that overall impact is to be reduced, ad-
dressing both of these factors is essential.
Change in distribution of world population 1900 and 2000. Source: http://www.newint.org/issue309/Images/population.gif
Case Study: Parrot’s Beak
Between Sierra Leone and Liberia,
there is a small strip of land belonging
to Guinea known as the “Parrot’s Beak.”
As civil wars raged in Sierra Leone
and Liberia, hundreds of thousands of
refugees have fled to relative safety in
Guinea, many of them settling in the
Parrot’s Beak. The United Nations High
Commissioner for Refugees (UNHCR)
estimates that the refugee population
constitutes up to 80 per cent of the local
population there (UNEP 2000).
The 1974 image of the Parrot’s
Beak in Guinea (left) shows the sur-
rounding territory of Liberia and Sierra
Leone. Scattered throughout the deep
green forest of the Parrot’s Beak region
are small flecks of light green, where
compounds of villages with surrounding
agricultural plots are located. Several
dark spots in the upper left of the image
are most likely burn scars.
The 2002 image (facing page) shows
the Parrot’s Beak region clearly defined
by its light green color surrounded by
darker green forest. The light green
Credit: UNEP/GRID–Geneva
Deforestation of indigenous palm trees in
the refugee camp has left barren hillsides.
Population Change
Europe
(including
Russia)
25%
Asia 60%
US 5%
Africa 4.5%
Latin America 3% Others 2.5%
Asia Pacific
(including former
Soviet Asia) 54%
Africa 10%
Latin America
& Caribbean 8%
Middle East &
North Africa 6%
North America 5%
Others 3%
Europe
(including
Russia)
14%
15
A biome is a major ecological community of plants
and animals with similar life forms and environmen-
tal conditions. Some of the Earth’s major terrestrial
biomes include forests, grasslands, deserts, rain
forests, and tundra. Different biomes are the source
of different kinds of resources and processes (col-
lectively called ecosystem services) such as water,
soil, oil, natural gas and other fuels, minerals and
other raw materials, wildlife habitat, erosion control,
nutrient cycling, water filtration, food production,
and genetic resources. The estimated global value
of the Earth’s biomes for ecosystem services alone
ranges from US $16 trillion to US $54 trillion a year
(Costanza et al. 1997).
color is the result of deforestation in
the “safe area” where refugees have
set up camp. Many of the refugees
integrated into local villages, created
their own family plots, and expanded
the zones of converted forest area until
they all merged into the larger defined
area. In the upper part of the 2002 im-
age the forest devastation is especially
obvious, as areas that were green in the
1974 image now appear gray. Logging
interests also moved into the higher
elevations of this region, expanding the
deforested zone visible in the upper
left corner of the image.
Overall impoverishment of the
environment of the Parrot’s Beak is
directly related to the rapidly increas-
ing population in the area, mainly due
to immigration, and a growth rate of
about three per cent among the indig-
enous population. Natural resources
are being exploited to create more ar-
able land for crops, wood for charcoal,
firewood and construction materials,
and commercial logging for revenue.
Source: UNEP 2000.
Credit: UNEP/GRID–Geneva
Deforestation is evident on the hills sur-
rounding the refugee camp.
Tropical and Subtropical Grasslands, Savannas, and Shrublands
Temperate Grasslands, Savannas, and Shrublands
Boreal Forests / Taiga
Temperate Conifer Forests
Temperate Broadleaf and Mixed Forests
Tropical and Subtropical Coniferous Forests
Deserts and Xeric Shrublands
Mangroves
Bare Rock / Ice
Mediterranean Forests, Woodlands, and Scrub
Tundra
Montane Grasslands and Shrublands
Flooded Grasslands and Savannas
Tropical and Subtropical Dry Broadleaf Forests
Tropical and Subtropical Moist Broadleaf Forests
Biomes
Source: World Wildlife Fund Terrestrial Ecoregions Dataset.
World Biomes
16
A
simple definition of world population is the num-
ber of people alive on the Earth at any given
point in time. World population reached
6 400 million in 2004 and it continues to grow by some
80 million each year (Table 2.1). Since the 1950s, China
has been the world’s most populous country (Table 2.2).
China’s population is currently greater than that of some
entire world regions (Global Population Profile 2002). By
2050, world population is estimated to reach 7 900 to
10 900 million, when stabilization of the Earth’s popula-
tion is likely to take place. Whether or not world popu-
lation falls within that range by this middle of this cen-
tury—rather than exceeding it—will depend upon many
of the choices and commitments that people make in the
coming years (UNFPA 2001).
The size of any population changes as a result of fluc-
tuations in three fundamental factors: birth rate, death
rate, and immigration or emigration. When any or all of
these factors deviate from zero, the size of the
population will change (Global Population
Profile 2002). The primary driving force of
population change, whether in an individual
country or for the entire world, is change in
birth and death rates.
World population is growing more slowly
than was expected (Figure 2.1) as a result of
aid, family planning programs, and educa-
tional and economic programs directed at
women. People are also healthier and living
longer than they did in the past; average life
expectancy has increased while crude birth
rate and death rate are following a downward
trend (Tables 2.3, 2.4, 2.5 and 2.6).
Most future population growth is likely to
be in countries that have relatively large num-
bers of young people and where large families
are still the norm. Furthermore, declining mortality and
increased longevity have resulted in, and will continue to
lead to, the expansion of older populations. Worldwide,
2.1 World Population
Table 2.1 – World population for given points in time
Source: ESA 2003
Year Population
1970 3 692 492 000
1975 4 068 109 000
1980 4 434 682 000
1985 4 830 979 000
1990 5 263 593 000
1995 5 674 380 000
2000 6 070 581 000
2005 6 453 628 000
2010 6 830 283 000
Source: Global Population Profile 2002
1804
1922
1959
1974
1987
1999
2013
2028
2048
1800 1850 1900 1950 2000 2050
0
1
2
3
4
5
6
7
8
9
10
Population in billions Total world population
118 years
37 years
15
years
13
years
12
years
14
years
15
years
20
years
Source: United Nations (1995b); U.S. Census Bureau, International Programs Center, International Data Base and unpublished tables.
Figure 2.1: Time to successive billions in world population: 1800-2050.
Credit: Topfoto
17
the average life expectancy in 1950 was 46 years; in 2050,
it is projected to be 76 years (Hunter 2001).
While an increase in life expectancy is a positive de-
velopment, it presents a new set of challenges. In Europe,
for example, where women give birth to an average of 1.4
children, governments are concerned that there will be
too few workers in future years to support the growing
number of retirees in the population. An aging popula-
tion strains a nation’s social security system and pension
plans, and puts pressure on health budgets because of
higher health care costs for the elderly. Some govern-
ments are also concerned that a shortage of working-age
individuals may lead to increased immigration, and that a
decline in population may signal a weakening of a coun-
try’s political and economic clout (Ashford 2004).
One of the main reasons that world population has
grown so rapidly over the last 200 years is that mortal-
ity rates have declined faster than fertility
rates. Improved sanitation, health care,
medicine, shelter, and nutrition have all
led to dramatic increases in life expectancy.
Fertility rates, on the other hand, declined
more recently than mortality rates did
(UNEP 1999).
There is a striking paradox in global
population trends: for more than two de-
cades, many developing countries have ex-
perienced a rapid decline in fertility while
fertility rates in most highly developed na-
tions have remained very low (Figures 2.3
and 2.4). Yet in the coming years, a massive
increase of the world population is almost
certain (Heilig 1996).
The Demographic Transition Model
(Figure 2.2) shows how a country’s popula-
tion can change as the country develops.
However, this model does not take into
account migration. Worldwide, migration
of people out of rural areas is accelerating,
making internal and international
Table 2.3 – Median age for given points
in time Source: ESA 2003.
Year Median age
1970 21.7
1975 22.0
1980 22.7
1985 23.4
1990 24.3
1995 25.3
2000 26.4
2005 27.4
2010 28.4
Table 2.5 – Crude birth rate per 1 000
population - Medium variant Source: ESA 2003.
Period Crude birth rate
1970-1975 30.9
1975-1980 28.1
1980-1985 27.4
1985-1990 26.8
1990-1995 24.5
1995-2000 22.7
2000-2005 21.3
2005-2010 20.4
Table 2.6 – Crude death rate per 1 000
population - Medium variant Source: ESA 2003.
Period Crude death rate
1970-1975 11.6
1975-1980 10.9
1980-1985 10.3
1985-1990 9.7
1990-1995 9.5
1995-2000 9.2
2000-2005 9.1
2005-2010 9.0
Table 2.4 – Average life expectancy at birth - Medium
variant Source: ESA 2003.
Period Both sexes Male Female
combined
1970-1975 58.0 56.5 59.5
1975-1980 59.8 58.1 61.5
1980-1985 61.3 59.4 63.2
1985-1990 62.9 60.9 64.8
1990-1995 63.8 61.7 65.9
1995-2000 64.6 62.5 66.9
2000-2005 65.4 63.3 67.6
2005-2010 66.3 64.2 68.4
Table 2.2 – The Top Ten Most Populous Countries: 1950, 2002, 2050
1950 2002 2050
1. China 1. China 1. India
2. India 2. India 2. China
3. United States 3. United States 3. United States
4. Russia 4. Indonesia 4. Indonesia
5. Japan 5. Brazil 5. Nigeria
6. Indonesia 6. Pakistan 6. Bangladesh
7. Germany 7. Russia 7. Pakistan
8. Brazil 8. Bangladesh 8. Brazil
9. United Kingdom 9. Nigeria 9. Congo (Kinshasa)
10. Italy 10. Japan 10. Mexico
Source: U.S. Census Bureau, International Programs Center, International Data Base are unpublished tables.
Credit: Ed Simpson
18
migration potentially one of the most
important development and policy issues
of this century. The migration of labor
geographically, out of rural areas, and
occupationally, out of farm jobs, is one of
the most pervasive features of agricultural
transformations and economic growth. Yet
in a world of complete and well-function-
ing markets, there is little or no economic
rationale for policies to reduce migration;
the movement of labor out of agriculture is
both a quintessential feature of agricultural
transformations and a prerequisite for
efficient and balanced economic growth
(Taylor and Martin 2002).
Clearly, human numbers cannot contin-
ue to increase indefinitely. Unfortunately,
the more people there are and the longer
they live, the more competition there will
be for the Earth’s limited resources. Many
countries in the developing world are ap-
proaching levels of resource consumption
Figure 2.2: The Demographic Transition Model shows how population growth occurs
naturally in four stages. Stage 1: Birth rate and death rate are high, limiting both the
rate of increase and total population. Stage 2: Birth rate remains relatively high but
death rate begins to fall, causing the population to grow rapidly. Stage 3: Declining
birth rate and low death rate maintain continued population growth. Stage 4: Both
birth rate and death rate are low, slowing population growth, but leaving a large total
population. Source: http://www.geography.learnontheinternet.co.uk/topics/growth
6.7
5.1 5.1
2.6
5.0
2.6
2.0 2.0 2.2 1.4
1970 2004
Africa Asia Latin America
& Caribbean
North
America
Europe
Figure 2.3: Childbearing trends in major world
regions, 1970 and 2004
Total fertility rate (children per woman)
Source: UN Population Division. World Population Prospects: The 2002 Revision (1970
data), and C. Haub, 2004 World Population Data Sheet (2004 data).
Figure 2.4: Different patterns of fertility
decline, 1970-2000
0
1
2
3
4
5
6
7
1970 1975 1980 1985 1990 1995 2000
BangladeshIndia
Argentina
Thailand
Children per woman
Sources: Registrar General of India; Instituto Nacional de Estadística (Argen-
tina); United Nations Population Division; Institute of Population and Social
Research, Mahidol University, Thailand; Demographic and Health Surveys; and
Population Reference Bureau estimates.
Credit: Topfoto
5,000 and higher
No data
10 - 49
1 - 9
50 - 99
100 - 199
200 - 499
500 - 999
1,000 - 1,999
2,000 - 4,999
5,000 and
higher
No data 10 - 491 - 9 50 - 99 100 - 199 200 - 499 500 - 999 1,000 -
1,999
2,000 -
4,999
Population Density
persons per square km
Population Density
persons per square km
Source: Gridded Population of the World (GPW), Version 3.0 (v3) beta,
2000, published by Columbia University Center for International Earth
Science Information network (CIESIN).
Source: Gridded Population of the World (GPW), Version 3.0 (v3) beta,
2000, published by Columbia University Center for International Earth
Science Information network (CIESIN).
Population Density Map
Source: http://beta.sedac.ciesin.columbia.edu/
19
and waste generation that rival those of de-
veloped countries. Unless all nations adopt
more sustainable methods of production
and consumption, the planet’s carrying
capacity will be exceeded (UNEP 1999).
Natural resources are already severely
limited, and there is emerging evidence
that natural forces are already starting
to control human population numbers
through malnutrition and disease (Pimen-
tel et al. 1999).
The environmental challenges that peo-
ple now face and most likely will continue
to face in the future would be less difficult
if world population were growing very
slowly or not at all. The number of people
on the Earth and the rate at which that
number increases (Table 2.7) dramatically
impact the availability of water, soil, ar-
able land, minerals, fuels, and many other
natural resources worldwide. Access to and
Case Study: Monitoring Rapid Urban
Expansion of Tehran, Iran
1975 and 2000
Tehran is located at the foot of the Alborz
Mountains. The city occupies the northern part
of the alluvial Tehran Plain, sloping from the
mountains to the flat Great Salt Desert. The ur-
ban area is bounded by mountains to the north
and east making it difficult to differentiate the
urban area from the mountainous and desert
area that surrounds Tehran.
The population of Tehran has grown three-
fold since 1970 when the population was three
million. In 1987, the city had grown to more
than seven million people and covered an area
of 575 km2 (230 square miles). Today the city
has nine million residents.
The rapid expansion of Tehran, as well as its
sharp population growth in recent decades, has
had many adverse impacts on the environment.
Air and water pollution are major problems in
the city. Urban areas are replacing farms and
water resources. A major concern is its location
on a recognized zone of active faulting with a
modest to high seismic risk. Recent planning
and construction techniques are designed to
improve the resistance to a major earthquake
that could threaten the city.
19
Credit: Saman Salari Sharif, UNEP-GRID Geneva
The map portrays the boundaries of urban areas with defined populations of 5 000 persons or more. Source: Modified from http://beta.sedac.ciesin.columbia.edu/gpw/global.jsp
Global Urban Extent Map
20
use of family planning services can help
lower fertility rates and delay child-bearing
years, thereby helping to slow population
growth. Comprehensive population policies
are an essential element in a world devel-
opment strategy that combines access to
reproductive health services, education and
economic opportunities, improved energy
and natural resource technologies, and
more reasonable models of consumption
and what constitutes “the good life.” Such a
strategy has the potential to bring humanity
into an enduring balance with the envi-
ronment and the natural resources upon
which people will always depend (Popula-
tion Fact Sheet 2000).
In addition to the overall global increas-
es in population, the geographic distri-
bution of human population underwent
massive changes during the 20th century
(Figure 2.5). For example, between 1900
and 1990, the population of northern
South America increased by 214 million, or
681 per cent, compared to the global aver-
age population increase of 3 700 million, or
236 per cent (Ramankutty and
Olejniczak 2002).
Population growth around Lake Victoria,
Kenya, is significantly higher than in the rest
of Africa because of the wealth of natural
resources and economic benefits the lake re-
gion offers. Note the increase in population
in a 100-km (62 miles) buffer zone around
Lake Victoria between 1960 and 2000. Dur-
ing each decade, population growth within
this zone outpaced the continental average.
Source: UNEP/GRID- Sioux Falls
Lake Victoria, Kenya
0 – 0.5
0.5 – 10
10 – 100
100 – 250
250 – 500
500 – 1000
greater than 1000
Population density
(people per sq km)
Table 2.7 – World Vital Events Per Time Unit: 2004
(Figures may not add to totals due to rounding)
Natural Population
Time unit Births Death Increase
Year 29 358 036 56 150 533 73 207 503
Month 10 779 836 4 679 211 6 100 625
Day 353 437 153 417 200 021
Hour 14 727 6 392 8 334
Minute 245 107 139
Second 4.1 1.8 2.3
Source: http://www.census.gov/cgi-bin/ipc/pcwe
Figure 2.5: Population change in the 20th century
Source: http://www.bioone.org/pdfserv/i0044-7447-031-03-0251.pdf
Credit: Ed Simpson
Water
Low (<25)
Medium (25–100)
High (>100)
Population Density
(people/km2)
21
2.2 Culture
Culture encompasses the customary beliefs, social forms,
and material traits of a racial, religious, or social group.
Culture includes the set of values and institutions that
enables a society to develop and maintain its identity.
Cultural signatures differ around the globe and often
hold to very different ideals and ideas, such as the value
of economics as an integrating system of values or the
importance of technology and technological change as
springboards for human progress. Different cultures also
differ in their concepts of justice and fairness and their
beliefs about the relationship between people and the
natural and spiritual world (UNEP 2002a).
Today, many of these differences are disappearing as
cultures worldwide become increasingly homogeneous.
Major steps in this direction occurred in the fifteenth
century with European exploration and colonization and
in the nineteenth century with the Industrial Revolution.
More recently, the creation of the European Union in
1952 broke down many international barriers and con-
currently reduced cultural diversity within Europe. Fol-
lowing the collapse of the Eastern Bloc in 1989, capital-
ism became more pervasive, less nationally limited, and
more powerful worldwide.
Globally, world-spanning communication networks
and inexpensive air travel have reduced the costs of
cross-cultural connections of all kinds, boosting televi-
sion, tourism, and emigration to new levels. Global finan-
cial integration has proceeded at a furious pace, along
with the international flow of goods and services as coun-
tries become increasingly dependent on each other for
Credit: Bigfoto
Source: Terralingua, UNESCO, and WWF 2003
The World’s Biocultural Diversity. People, Languages and Ecosystems
22
food and basic commodities (Wilk 2000).
Explosive development of electronic me-
dia, including the Internet, has intensified
cultural homogenization by promoting the
ideals of a handful of cultures over those
of many others. Western clothing is replac-
ing ethnic dress in many countries, while
American pop music is crowding out tradi-
tional folk music (Gary and Rubino 2001).
In short, current globalization of trade
and mass culture, together with unprec-
edented demand for consumer goods, has
significantly impacted indigenous cultures
around the globe.
In many parts of the world, English has
become the dominant language, having
displaced native tongues and dialects. Of
the 6 800 or so “living” languages spoken
in the world today, nearly half are likely to
disappear in the foreseeable future (Wurm
1970; Gary and Rubino 2001). More than
350 languages already have fewer than
50 speakers (Table 2.8). Such rare lan-
guages are more likely to decline or disap-
pear than those that are more common
(Sutherland 2003).
Source: http://highered.mcgraw-hill.com/site/dl/free/007248179x/35299/map12.pdf
Languages of the World
Source: Modified from http://www.neiu.edu/~ejhowens/104/6/cultur.gif
Legend
Anglo American
Austral European
European
Indic
Insular Oceanic
Latin America
Islamic
Sino Japanese
Slavic
Southeast Asia
sub Saharan Africa
WORLD CULTURAL REGIONS
23
The disappearance of any language represents an irrepa-
rable loss for the heritage of all humankind (Wurm 1970). It
has been likened to the extinction of species—an unfortunate
cultural analog to the alarming events now being witnessed in
the biological world. In fact, the number of “living” languages
spoken on the Earth is dwindling faster than the
planet’s biodiversity.
The interrelationship between culture and the environ-
ment is also reflected in the depletion of energy resources
and forced adoption of new energy sources. In Europe, coal
replaced relatively scarce wood as a fuel at the beginning of the
Industrial Revolution. Oil and natural gas, in turn, began to
replace coal during the early twentieth century. Nuclear, solar,
and other energy sources are now replacing petroleum prod-
ucts (O’Neil 2004).
Table 2.8 – The most common languages in the world
Approximate number Countries with
of native speakers substantial numbers
Language (in the year 2000) of native speakers
1. Mandarin Chinese 874 000 000 16
2. Hindi (India) 366 000 000 17
3. English 341 000 000 104
4. Spanish 322-358 000 000 43
5. Bengali 207 000 000 9
(India and Bangladesh)
6. Portuguese 176 000 000 33
7. Russian 167 000 000 30
8. Japanese 125 000 000 26
9. German (standard) 100 000 000 40
10. Korean 78 000 000 31
11. French 77 000 000 53
12. Wu Chinese 77 000 000 1
13. Javanese 75 000 000 4
14. Yue Chinese 71 000 000 20
15. Telegu (India) 69 000 000 7
Note: These statistics are only rough approximations in most cases.
(Source: The World Almanac and Book of Facts, 2003)
Credit: Bigfoto
Source: http://highered.mcgraw-hill.com/site/dl/free/007248179x/35299/map11.pdf
Religions of the World
24
Religion, an important aspect of culture,
also has had an effect on the environment.
The Western world’s attitudes toward
nature were shaped largely by the Judeo-
Christian tradition, which stressed the
concept of a world created solely for the
benefit of humans. According to this tradi-
tion, “God planned all [of creation] explic-
itly for man’s benefit and rule: no item in
the physical creation had any purpose save
to serve man’s purposes.” (White 1967).
Christianity, and Western civilization as a
whole, held a view of nature that separated
humans from the rest of the natural world
and encouraged exploitation of it for the
sole benefit of the human species (Thorn-
gren 2003). This cultural philosophy stood
in stark contrast to many older, indigenous
religious traditions, in which people were
seen as part of nature and spirits inhabited
animals, plants, and even non-living envi-
ronmental components such as mountains
and rivers.
Much has been said about the expan-
sion of Western culture to the detriment
of others. It is clear that many individuals
aspire to Western lifestyles, while others as-
sociate Western cultural values with selfish
individualism and excessive consumption.
The spread of Western culture is both a
cause and an effect of economic globaliza-
tion, aided by the far-reaching penetration
of information technologies and electronic
media. At the same time, there have been
nationalist and religious reactions against
that culture, sometimes resulting in terror-
ist activities and in open warfare within or
between nations (UNEP 2002a).
Homogenization of culture, whether
Western-influenced or not, should improve
peoples’ ability to communicate with one
another and, in doing so, reduce conflicts.
Conversely, variety in all aspects of life has
been a source of wonder and celebration
for countless centuries, and the loss of that
variety is an unfortunate prospect (Gary
and Rubino 2001).
A natural wonder formed by natural processes, Rainbow
Bridge (far left) straddles a tributary of the Colorado
River in southern Utah in the United States. Two con-
temporary bridges, one from Sydney, Australia (left),
and the other from London, England (below left), echo
the natural form of Rainbow Bridge, but are the obvious
byproducts of modern culture.
Credit: Ed Simpson
Credit: Bigfoto
Credit: BigfotoCredit: USGS
25
2.3 Land Use and
Degradation
Growing crops, clearing land, planting trees, draining a wetland—
these and many other activities fall into the broad category of land
use, or how people use land. Land-use intensity is the extent to
which land is used. It is an indication of the amount and degree of
development in an area, and a reflection of the effects generated
by that development (Planning Department 2001).
As a measure of activity, land-use intensity can range from very
low (for example, a pristine wilderness area) to intermediate (a
managed forest ecosystem) to very high (urban and industrial
settings) (Lebel and Steffen 1998). From a global change perspec-
tive (Figure 2.6), land-use intensity is an important characteristic
in assessing change and its impact (Berka et al. 1995). Land-use
intensity is determined by the spatial requirements of a land-use
activity, relationship to open space, requirements for infrastruc-
ture (transportation routes, water, sewer, electricity, and commu-
nications), and environmental impact. Parameters for measuring
land-use intensity typically include:
• type of land-use activity, such as agriculture, grazing, wood
production, or residential, commercial or industrial usage,
• duration of use,
• number of people, animals, plants, structures, or machines
that occupy the land during a given period, and
• amount of land involved.
Figure 2.6: This series of illustrations depicts global land-use change, particularly
the expansion of cropland and grazing land, between 1700 and 1990. Credit: Klein
Goldewijk, K., 2001. Source: NASA 2002, http://www.gsfc.nasa.gov/topstory/20020926landcover.
html
Credit: Topfoto
tropical evergreen/deciduous forest
savana
grassland and steppe
open shrub land
temperate deciduous forest
temperate needle-leaf evergreen forest
intensive agriculture marginal cropland used for grazing
desert
26
Also important in assessing land-use
intensity is to examine the relative imper-
viousness of the landscape. Impervious
surfaces, such as paved roads, inhibit or
entirely block the absorption of water by
underlying soil (Forney et al. 2001). Once
paved or otherwise made impervious, land
is not easily reclaimed. As environmentalist
Rupert Cutler noted (Brown 2001),
“Asphalt is the land’s last crop.”
Land-use intensity trends are usually
expressed through changes in inputs,
management, or number of harvests over a
given period of time. Only changes within
the same land-use category and on the
same area (change of intensity)—as op-
posed to changes from one type of land
use to another (for example, forest to
cropland)—are taken into account when
assessing trends (van Lynden et al. n.d.;
FAO 2002).
The Agro-Ecological Zones (AEZ)
methodology (Figure 2.7) is a system devel-
oped by the Food and Agriculture Organi-
zation of the United Nations (FAO) with
the collaboration of the International Insti-
tute for Applied Systems Analysis (IIASA),
that enables rational land use planning on
the basis of an inventory of land resources
and evaluation of biophysical limitations
and potentials. This methodology utilizes
a land resources inventory to assess, for
specified management conditions and
levels of inputs, all feasible agricultural
land-use options and to quantify expected
production of cropping activities relevant
Figure 2.8: A satellite image reveals a typical “feather” or “fish-
bone” pattern of deforestation in Brazil. The pattern follows
the construction of a new road through the rain forest. Roads
provide easy access for mechanicized logging to clear cut for-
est sections. Clear cut sections can then be turned into agricul-
tural fields as roads provide easy access to local markets.
Source: UNEP/GRID–Sioux Falls
B R A Z I L
R o n d ô n i a
Ariquemmes
São Joao
Joao Filipe
Rio Branco
São Cruz
Uru-Eu-Wau-Wau
Indigenous
Area
Pacaás Novos
National Park
Karitiana
Indigenous
Area
RioCandeias
RioJamari
B R A Z I L
R o n d ô n i a
0 10
Kilometers
B R A Z I L
R o n d ô n i a
Ariquemmes
São Joao
Rio Branco
São Cruz
ana
nous
a
RioCandeias
RioJamari
B R A Z I L
R o n d ô n i a
Figure 2.7: Conceptual framework of the Agro-Ecological Zones methodology
Source: FAO 2000, http://www.fao.org/ag/agl/agll/gaez/index.htm
19 Sep 2001
27
in the specific agro-ecological context.
The characterization of land resources
includes components of climate, soils and
landform, which are basic for the supply of
water, energy, nutrients and physical sup-
port to plants (FAO 2000).
Worldwide, the effect people are having
on the Earth is substantial and growing.
Satellite images reveal in startling detail
the signs of human impact on the land-
scape. From the herringbone patterns
of deforestation etched into once-undis-
turbed rain forests (Figure 2.8) to the
patchwork patterns of agricultural fields
and concrete splotches of urban sprawl,
the evidence that people have become a
powerful force capable of reshaping the
Earth’s environment is everywhere.
Scientists estimate that between one-
third and one-half of the Earth’s land
surface has been transformed by human
activities (Figure 2.9) (Herring n.d.). The
activity that has had the greatest impact on
the global landscape is agriculture. Twelve
per cent of the world’s land surface—an
area equivalent to that of the South Ameri-
can continent—is under permanent
cultivation (Ramankutty and Foley 1999;
Devitt 2001).
Over the next 30 years, the annual rate
of growth in global crop production is ex-
pected to decrease. However, the Food and
Agriculture Organization of the United
Nations predicts that production will still
exceed demand, despite the world’s grow-
ing population. By 2030, 75 per cent of the
projected global crop production will oc-
cur in developing countries, compared to
50 per cent in the early 1960s. Increases in
production will be achieved by improving
plant yields and through more intensive
land-use activities, including multi-crop-
ping or high-cropping intensities (UCS
2004). In light of these projections, contin-
ued support of agricultural research and
policies in developing countries is vital.
Nearly one-third of the world’s crop-
land—1 500 million hectares—has been
abandoned during the past 40 years
because erosion has made it unproductive
(Pimentel et al. 1995). Restoring soil lost
by erosion is a slow process; it takes rough-
ly 500 years for a mere 2.5 cm (1 inch)
of soil to form under agricultural
Source: http://www.isric.nl/
Global Soil Degradation Map
Credit: Topfoto
27
Source: http://www.isric.nl/
28
conditions (Pimentel et al. 1996). Thus the
approach to replacing eroded agricultural
lands typically has been to clear more and
more areas of grassland or forest and con-
vert them to cropland. The ever-growing
need for agricultural land accounts for 60
to 80 per cent of the world’s deforestation
(Figure 2.9).
Despite such “replacement” strategies,
the amount of available cropland
worldwide has declined to 0.27 hectare
(0.67 acres) per person (Pimentel et al.
1996). It is possible to feed one adult on
a plant diet grown on about 0.2 hectares
(0.5 acres) of land (Knee 2003)—and
this land-per-person minimum is roughly
what will be available when world
population reaches 8 000 million—but
only if crop yields now being achieved
in developed countries are achieved
worldwide. To do so requires that most
countries’ inputs of fertilizer, and probably
pesticides, rise to match those of North
America and Europe. Furthermore, any
mechanization of crop production will
entail additional energy consumption.
Increased mechanization is likely given
the mass migration from rural areas to
cities currently underway on all continents.
While agriculture accounts for only about
two per cent of energy consumption in
North America and Europe, it accounts
for roughly ten per cent of energy
consumption in the rest of the world
(Knee 2003).
The shortage of cropland, together with
falling productivity, is a significant factor
contributing to global food shortages and
associated human malnutrition. Political
unrest, economic insecurity, and unequal
food distribution patterns also contribute
to food shortages worldwide (Pimentel et
al. 1996).
In addition to agriculture, the global
trend toward urbanization is another key
factor bringing change to the landscape.
Historically, forests and grasslands have
been converted to cropland. Increasingly,
cropland is being converted to urban areas
(Ramankutty and Foley 1999; Devitt 2001).
Millions of hectares of cropland in the
industrial world have been paved to create
roads and parking lots. The average car re-
quires 0.07 hectares (0.17 acres) of paved
land for roads and parking space
(Brown 2001).
If farmers worldwide fail to meet the
challenge of increasing yields on existing
cropland, or they cannot access the tools
necessary to achieve increased yields, the
only alternative will be to clear the world’s
remaining forests and grasslands (Green
2001). Yet indications are that the world
does not have enough forests to fulfill all
the current and future demands being
placed on them (Nilsson 1996).
As natural forests are exhausted or
come under protection, the demand for
wood and wood products will be increas-
ingly satisfied by tree farms. Between 1980
and 1995, forest plantations in developed
countries increased from 45-60 million
hectares (111-147 million acres)to 80-100
million hectares (198-247 million acres).
Credit: Topfoto
Figure 2.9: Human-induced land degradation (severe and very severe) as percentage of total land area
Source: World Atlas of Desertification (UNEP 1992)
30
25
20
15
10
5
0
Area(millionsq.km) Total human
induced land
degradation
Total land
Sub-
Saharan
Africa
North
Africa
and Near
East
North
Asia,
east of
Urals
Asia and
Pacific
South
and
Central
America
North
America
Europe
29
In the developing world, the area in forest
plantations doubled from roughly 40 mil-
lion to about 81 million hectares (99-200
million acres) over the same period. More
than 80 per cent of forest plantations in
the developing world are found in Asia,
where demand for paper and other wood
products continues to grow rapidly. For-
est plantations now cover more than 187
million hectares (462 million acres) world-
wide. That accounts for less than five
per cent of the Earth’s total forested area,
but 20 per cent of current global wood pro-
duction (Larsen 2003).
Land Degradation
and Desertification
By the beginning of the twenty-first cen-
tury, unprecedented global environmental
changes had reached sufficient propor-
tions to impinge upon human health—si-
multaneously and often interactively. These
changes include the processes of land
degradation and desertification (Menne
and Berollini 2000).
Land degradation is the decline in the
potential of land resources to meet hu-
man economic, social, and environmental
functions needs (Africa Mountain Forum
n.d.). Desertification is soil degradation in
arid regions, often to such an extent that
it is impossible to make the soil produc-
tive again (Table 2.9). Desertification is
the result of complex interactions between
unpredictable climatic variations and
unsustainable land use practices by com-
munities who, in their struggle to survive,
overexploit agricultural, forest, and water
resources (CIDA 2001).
Over 3 600 million hectares (8 896 mil-
lion acres)—25 per cent of the Earth’s land
area—are affected by land degradation.
Desertification occurs to some extent on
30 per cent of irrigated lands, 47 per cent
of rain-fed agricultural lands, and 73 per
cent of rangelands (Figure 2.10). Annually,
an estimated 1.5 to 2.5 million hectares
(3.7 to 6 million acres) of irrigated land,
3.5 to 4.0 million hectares (8.6 to 9 mil-
lion acres) of rain-fed agricultural land,
and about 35 million hectares (86 million
acres) of rangeland lose all or part of their
productivity due to land degradation pro-
cesses (Watson et al. 1998).
Desertification and drought are prob-
lems of global dimension that directly
affect more than 900 million people in
100 countries, some of which are among
the least developed nations in the world
(Watson et al. 1998). The consequences of
desertification include (UNEP 2002a):
• reduction of the land’s natural resil-
ience to recover from climatic distur-
bances;
• reduction of soil productivity;
• damaged vegetation cover, such that
edible plants are easily replaced by
non-edible ones;
• increased downstream flooding, re-
duced water quality, sedimentation in
rivers and lakes, and siltation of reser-
voirs and navigation channels;
• aggravated health problems due to
wind-blown dust, including eye infec-
tions, respiratory illnesses, allergies,
and mental stress;
• undermined food production; and
• loss of livelihoods forcing affected
people to migrate.
Desertification results from misman-
agement of land and thus deals with two
interlocking, complex systems: the natural
Credit: Topfoto
Table 2.9 – Degree of soil degradation by subcontinental regions (per cent of total area)
None Light Moderate Strong Extreme
Africa 83 6 6 4 0.2
Asia 82 7 5 3 <0.1
Australiasia 88 11 0.5 0.2 <0.1
Europe 77 6 15 1 0.3
North America 93 1 5 1 0
South America 86 6 6 1 0
World:
Per centage 85 6 7 2 <0.1
Area (‘000 km2
) 110 483 7 490 9 106 2 956 92
Source: World Atlas of Desertification (UNEP 1992)
30
ecosystem and the human social system
(Eswaran et al. 1998). While much desert-
ification is attributed to poor land-use prac-
tices, hotter and drier conditions brought
about by potential global warming would
extend the area prone to desertification
northwards to encompass areas currently
not at risk. In addition, the rate of deserti-
fication would increase due to increases
in erosion, salinization, fire hazard, and
reductions in soil quality. As a result, the
process of desertification is likely to be-
come irreversible (Karas n.d.).
Worldwide, an estimated 6 to 27 million
hectares (15 to 67 million acres) of land
are lost each year to desertification. Seven-
ty per cent of the world’s dry land is de-
graded enough to be vulnerable to deserti-
fication (Anon 2002). The amount of land
susceptible to desertification (areas known
as tension zones) also is increasing. Cur-
rently, 7.1 million km2 (2.7 million square
miles) of land face low risk of human-in-
duced desertification, 8.6 million km2
(3.4 million square miles) are at moderate
risk, 15.6 million km2 (6.2 million square
miles) are at high risk, and 11.9 million
km2 (4.6 million square miles)are at very
high risk. Tension zones result from:
• excessive and continuous soil erosion
resulting from overuse and improper
use of lands, especially marginal and
sloping lands;
• nutrient depletion and/or soil acidi-
fication due to inadequate replenish-
ment of nutrients or soil pollution
from excessive use of organic and
inorganic agrichemicals;
• reduced water-holding capacity of
soils due to reduced soil volume and
reduced organic matter content, both
of which are a consequence of erosion
and reduced infiltration due to crust-
ing and compaction;
• salinization and water-logging from
over-irrigation without adequate
drainage; and
• unavailability of water stemming from
decreased supply of aquifers and
drainage bodies.
The following negative effects are high-
est in the tension zones (Eswaran et al.
1998):
• systematic reduction in crop perfor-
mance, leading to failure in rain-fed
and irrigated systems;
• reduction in land cover and biomass
production in rangelands, with an
accompanying reduction in quality of
feed for livestock;
• reduction of available woody plants
for fuel and increased distances to
harvest them;
Credit: Topfoto
Figure 2.10: Soils are classified according to the proportions of different sized particles they contain.
As seen in this figure, the largest percentage of world land area unsuitable for agriculture is land that
is too dry. Source: FAO 2000, http://www.fao.org/desertification/default.asp?lang=en
31
Case Study: Mt. Kenya–Diversity
in Ecosystems
Christian Lambrechts
Mount Kenya is located on
the equator 180 kilometres
north of Nairobi. It is a soli-
tary mountain of volcanic
origin with the base diam-
eter of about 120 km (75
miles). Its broad cone shape
reaches an altitude of 5 199 m (17 057 ft) with
deeply incised U-shaped valleys in the upper
parts. Forest vegetation covers the major part
of the mountain, with a total area around
220 000 hectares (548 574 acres). The forests
are critical and invaluable national assets that
must be protected.
High diversity in ecosystems and species
The wide range in altitude clines—from 1 200
to 3 400 m (3 900 to 11 000 ft)—and rainfall
clines from—from 900 mm/year (35 in/year)
in the north to 2 300 mm/year (91 in/year) in
the south-eastern slopes—contributes to the
highly diverse mosaic patterns of Mount Kenya
forests. Mount Kenya adds value to the na-
tion by providing tourism potential and local
cultural and economic benefits. It also pro-
vides important environmental services to the
nation such as a water catchment area of the
Tana River where 50 per cent of Kenya’s total
electricity output is generated.
Forest conservation initiative
Following a 1999 aerial survey, the entire forest
belt of Mount Kenya was gazetted as National
Reserve and placed under the management of
Kenya Wildlife Services in the year 2000. In
2002, a study was carried out to assess the effec-
tiveness of the new management practices put
in place in 2000. The study revealed significant
improvement in the state of conservation of
the forests.
This sub-scene of an ASTER satellite image shows
sand dunes covering an area roughly 12 km x 15 km
(8 x 9 miles) in the Thar Desert of northwestern
India and eastern Pakistan. The dunes here shift
constantly, taking on new shapes. Approximately 800
km (497 miles) long and 490 km (305 miles) wide,
the Thar Desert is bounded on the south by a salt
marsh known as the Rann of Kutch, and on the west
by the Indus River plain. The desert’s terrain is pri-
marily rolling sand hills, with scattered outcroppings
of shrub and rock. Source: NASA 2004, http://asterweb.jpl.
nasa.gov/gallery/gallery.htm?name=Thar
Forest is shown in true color (red) on these images. Note the changes in forest cover in the boxes.
Source: UNEP/GRID–Nairobi
• significant reduction in water from
overland flows or aquifers and a con-
comitant reduction in water quality;
• encroachment of sand and crop dam-
age by sand-blasting and wind erosion;
and
• increased gully and sheet erosion by
torrential rain.
Ultimately, desertification processes im-
pact about 2 600 million people, or 44 per
cent of the world’s population (Eswaran
et al. 1998).
31
Credit: NASA/GSFC/METI/ERSDAC/JAROS,
and U.S./Japan ASTER Science Team.
32
2.4 Ecoregions
and Ecosystems
An ecosystem is an organic community of plants and an-
imals viewed within its physical environment (habitat);
the ecosystem results from the interaction between soil
and climate. It is a dynamic complex of plant, animal,
and microorganism communities and their non-living
environment interacting as a functional unit (UNEP-
WCMC 2003).
An ecoregion is a cartographical delineation of a
relatively large unit of land or water containing a geo-
graphically distinct assemblage of species, natural com-
munities, and environmental conditions. An ecoregion
is often defined by similarity of climate, landform, soil,
surface form, potential natural vegetation, hydrology,
and other ecologically relevant variables. Ecoregions
contain multiple landscapes with different spatial pat-
terns of ecosystems.
The ecoregion concept is one of the most important
in landscape ecology, both for management and un-
derstanding (Hargrove and Hoffman 1999). Ecoregion
classifications are based on particular environmental
conditions and designed for specific purposes, and no
single set of ecoregions would be appropriate for all
potential uses (Wikipedia n.d.).
The environment of an ecoregion in terms of
climate, resource endowments, and socioeconomic
Credit: Topfoto
Tropical rainforest
Tropical moist
deciduous forest
Tropical dry forest
Tropical shrubland
Tropical desert
Tropical mountain
Polar
Water
No Data
Subtropical humid forest
Subtropical dry forest
Subtropical steppe
Subtropical desert
Subtropical mountain
Temperate oceanic forest
Temperate continental forest
Temperate steppe/prairie
Boreal coniferous forest
Boreal tundra woodland
Boreal mountain
Temperate desert
Temperate mountain
SCALE 1:150,000,000
GLOBAL ECOLOGICAL ZONES
Source: USGS National Center for EROS
33
conditions is homogeneous. Specific ad-
vantages of using an ecoregion approach
for planning and decision-making include:
• easier identification of production capa-
bilities and constraints;
• better targeting of prospective
technologies;
• improved assessment of responses to
new technologies; and
• wider adoption and larger impact of
research outputs (Saxena et al. 2001).
Trends
An increase in average global tempera-
ture has the potential to bring about
dramatic change in ecosystems. Some
species may be forced out of their habitats
(possibly to extinction) because of chang-
ing conditions. Other species may flourish
and spread. Few, if any, terrestrial ecore-
gions on the Earth are expected to remain
unaffected by significant global warming.
Since 1970, there has been a 30
per cent decline in the world’s living
things and the downward trend is continu-
ing at one per cent or more per year (Col-
lins 2000; UNEP 1997). Table 2.10 shows
an increase in the number of endangered
and vulnerable species between the years
2000–2003. Modification of landscapes,
loss of native species, introduction of
exotic species, monoculture-focused agri-
culture, soil enhancement, irrigation, and
land degradation have all tended to “sim-
plify” ecosystems, leading to a reduction
in biodiversity. In aquatic environments,
eutrophication and habitat destruction
have had a similar effect (Tilman et al.
2001). As ecosystems become simpler, so
do ecoregions.
Ecoregion and ecosystem fragmenta-
tion also contributes to a decline in biodi-
versity and threatens many species. Glob-
ally, over half of the temperate broadleaf
and mixed forests and nearly one quarter
of the tropical rain forests have been frag-
mented or removed (Wade et al. 2003).
Table 2.10 – Loss of biodiversity from 2000 to 2003—expressed as changes in species
numbers—in animals and plants classified as critically endangered, endangered, and
vulnerable
Critically Endangered Endangered Vulnerable
Group 2000 2002 2003 2000 2002 2003 2000 2002 2003
Mammals 180 181 184 340 339 337 610 617 609
Birds 182 182 182 321 326 331 680 684 681
Reptiles 56 55 57 74 79 78 161 159 158
Amphibians 25 30 30 38 37 37 83 90 90
Fishes 156 157 162 144 143 144 452 442 444
Insects 45 46 46 118 118 118 392 393 389
Mollusks 222 222 250 237 236 243 479 481 474
Plants 1 014 1 046 1 276 1 266 1 291 1 634 3 311 3 377 3 864
Source: http://www.redlist.org/info/tables/table2.html
Credit: Topfoto
34
Impacts
Simplification of ecosystems and ecore-
gions results in species extinctions and
a loss of natural resources (Tilman et al.
2001). Climate change and the way in
which ecological communities respond to
it have enormous conservation implica-
tions. These include developing awareness
of the transience of native ranges and
plant associations and the significance of
population declines and increases, as well
as the need to develop targets and refer-
ences for restoration, and strategies for
dealing with global warming (Millar 2003).
For example, changes in the potential dis-
tribution of tree and shrub taxa in North
America in response to projected climate
change are expected to be far-reaching
and complex; growing ranges for various
species will shift not only northward and
upward in elevation but in all directions
(Shafer et al. 2001). Some models predict
that more than 80 per cent of the world’s
ecoregions will suffer extinctions as a
result of global warming (Malcolm et al.
2002). Ecoregions expected to be most
dramatically altered by climate change
include the boreal forests of the North-
ern Hemisphere, the fynbos of Southern
Africa, and the Terai-Duar savanna and
grasslands of northeastern India (Malcolm
et al. 2002).
Credit: NRCS
Credit: Topfoto
35
2.5 Biodiversity,
Invasive Species,
and
Protected Areas
Biological diversity, or “biodiversity,” refers to the
variety of life on the Earth in all its forms. There
are three levels of biodiversity: biodiversity of a
landscape or ecosystem, species biodiversity, and
genetic biodiversity (IUCN, UNEP, and WWF
1991). These three levels are intimately connected.
For example, genetic diversity is often the key to
survival for a species, equipping it with the neces-
sary resources to adapt to changing environmental
conditions. Species diversity, in turn, is typically a
measure of ecosystem health (Rosenzweig 1999).
We have just begun to identify and fully un-
derstand the diverse living things that currently
inhabit the Earth. Scientists have discovered and
described roughly 1.75 million species to date.
That number is expected to increase substantially
when all marine organisms, arthropods, bacteria,
and viruses are eventually added to the list. Tragi-
cally, however, humans are destroying this great
diversity at an alarming rate. Rates of human-in-
duced species extinction are estimated to be 50 to
100 times the natural background rate; this could
Credit: Gyde Lund
Credit: www.invasive.org
36
increase to 1 000 to 10 000 times the natu-
ral rate in the next 25 years (Lund et al.
2003; Pellew 1996).
Why are so many species becoming
extinct? Human activities over the last
three centuries have significantly trans-
formed the Earth’s environment, primarily
through the conversion of natural ecosys-
tems to agriculture (Ramankutty and Foley
1999). It is estimated that cropland ex-
panded from 3-4 million km2 (1.2-1.5 mil-
lion square miles) in 1700 to 15-18 million
km2 (5.8-6.9 million square miles) in 1990,
primarily at the expense of forests. At the
same time, grazing lands expanded from 5
million km2 (1.9 million square miles) in
1700 to 31 million km2 (12 million square
miles) in 1990, largely via the conversion of
native grasslands (Goldewijk and Raman-
kutty 2001). In addition to agriculture-driv-
en landscape transformations, the move
to monoculture-based forms of agriculture
has contributed to declining biodiversity.
Wild plants and animals are a major
source of food. Billions of people still har-
vest wild or “bush” food around the world.
Between one-fifth and one-half of all food
consumed by poor people in developing
countries is gathered rather than culti-
vated. On a global scale, ocean fish caught
in the wild account for 16 per cent of the
human diet (Harrison and Pearce 2001).
Wild plants are also a major source of
medicine, and the loss of biological diver-
sity has serious implications in terms of
human health. Of the 150 most frequently
prescribed drugs, more than half are
derived from or patterned after chemical
compounds found in plants (Brehm 2003).
Moreover, plants are an important source
of fuel. Nearly 15 per cent of the world’s
energy is derived from the burning of plant
materials (De Leo and Levin 1997).
Worldwide, people eat only a small frac-
tion of the 70 000 plants known to be ed-
ible or to have edible parts (Wilson 1989).
But retaining biodiversity is still vital for
the food supply, since most food crops con-
stantly require an infusion of “wild” genes
to maintain their resistance to ever-evolv-
ing pests (Harrison and Pearce 2001).
37
Despite our dependence on biodi-
versity, it has been estimated that 27 000
species are lost every year—roughly three
per hour. Other estimates put the number
much higher. The greatest loss of bio-
diversity is currently taking place in wet
tropical regions where rain forest ecosys-
tems are being altered dramatically. But
loss of biodiversity is also evident in drier
regions, due to desertification. Major con-
tributors to species extinctions and loss of
biodiversity worldwide include:
• human population growth;
• unsustainable patterns of consump-
tion such as over-harvesting of plant
and animal resources;
• poor agricultural practices;
• increased production of wastes and
pollutants;
• urban development; and
• international conflict (UNEP 2002b).
Loss of biodiversity occurs hand-in-
hand with habitat loss, and habitat loss is
generally greatest where human popula-
tion density is highest (Harrison 1997).
One type of habitat loss is fragmentation.
Fragmentation occurs where a once-con-
tinuous ecosystem is broken up into many
small, poorly connected patches of land,
which happens when blocks of trees are
removed from a forest. A change in land
cover typically accompanies fragmenta-
tion. Six categories of fragmentation have
been identified (interior, perforated,
edge, transitional, patch, and undeter-
mined) depending on how a given area
of land is broken up (Riitters et al. 2000).
Fragmentation may be human-induced or
due to natural causes such as fire, floods,
or wind. Fragmentation may create more
diverse landscapes than were originally
present, and while it may destroy habitats
of some species, it can also create habitats
for others.
37
Left to right: Junipers near near Paulina, Oregon. Without natural fires to control their spread,
junipers can become invasive in rangelands (Credit: Gyde Lund). Women herding goats (Credit:
Topfoto). Cattle grazing in a bog (Credit: Topfoto). Kudzu taking over the land and trees in the
southeastern United States (Credit: Gyde Lund).
Photos left to right: A family of elephants in Africa (Credit: Gyde Lund). A clear-cut section of
forest (Credit: Topfoto). Yellowstone National Park (Credit: Gyde Lund). People often peel the loose
bark off birches for souvenirs. Danforth, ME USA (Credit: Randy Cyr, GREENTREE Technolo-
gies, www.forestryimages.org).
38
Invasive Species
Most plants and animals exist in places in
which they did not originate. They moved
or were introduced into new areas over
time. While rooted plants cannot them-
selves move from place to place, the dis-
persion of their seeds by wind, water, and
animals has enabled them to spread into
many new habitats.
An introduced species is one whose
existence in a given region is due to some
type of human activity. That activity may
enable the species to cross natural geo-
graphic barriers or it may transform condi-
tions in an area as to be in some way favor-
able to the species’ growth and spread.
Introduced species are also called alien, or
exotic, species.
Many introduced species have been
actively transported by people to new areas
for specific purposes and have played
important and beneficial roles in human
history. Most modern agricultural crops
were introduced into the regions they
now inhabit. For instance, corn (maize) is
thought to have originated in Mexico some
7 000 years ago. Today it is found world-
wide. Wheat probably originated in the
Middle East. Currently, wheat is grown on
more land area worldwide than any other
crop and is a close third to rice and corn in
total world production.
Many modern domesticated animals
were also new species introductions at
some point in their history. Modern do-
mestic cattle evolved from a single early
ancestor, the auroch. Cattle were domes-
ticated between 10 000 and 15 000 years
ago near the boundary of Europe and Asia
or Southwest Asia. Cattle are now widely
distributed throughout the world. The
total world cattle population in the late
Figure 2.11: The number and extent of the world’s
protected lands increased significantly during the
period from 1872 to 2003. The greatest increase has
occurred over the past few decades. In 2003, the total
number of protected sites surpassed 100 000, while
total area increased to more than 18 million km2 (7
million square miles). Source: Chape et al. 2003
100,000
80,000
60,000
40,000
20,000
0
1872 1902 1917 1932 1947 1952 1962 1977 1992 2003
0
2,000,000
4,000,000
6,000,000
8,000,000
10,000,000
12,000,000
14,000,000
16,000,000
18,000,000
Number of sitesArea of Sites
Cumulative Growth in Protected Areas by 5 Year Increments:
1872 – 2003
Case Study: Lake Maracaibo, Venezuela
Lake Maracaibo in northwestern Venezuela is
the largest natural lake in South America at
13 330 km2 (5 146 square miles). At its widest
point, it is more than 125 km (78 miles) wide.
The lake itself lies in the Maracaibo basin,
which is semi-arid in the north, but averages
over 1 200 mm (47 in) of annual rainfall in
the south. It has been suffering from a serious
problem of invasive duckweed, a tiny aquatic
plant that grows in freshwater. This first image
(left), taken by the Aqua MODIS satellite on
17 December 2003, shows the lake during the
winter months, when duckweed is absent from
the lake’s waters, and the silvery sunglint is ab-
sent. In summer the weed blooms. The true-co-
lour image from 26 June 2004 (middle) shows
strands of duckweed curling through the lake,
floating at the surface, or slightly submerged
in the brackish water. A closer look in August
2004 (right) reveals the stranglehold the duck-
weed has on port areas, especially along the
important oil shipping routes in the neck of
Lake Maracaibo. Fish and the fishing industry
suffer as thick green mats block photosynthesis
and alter fish habitats. The weed also adheres
to boats, affects cooling systems, and obstructs
travel. In September 2004, Venezuela’s Min-
istry of Environment and Natural Resources
reported that it had reduced the duckweed
area by 75 per cent, using duckweed harvesting
machines from the United States. The ministry
is investigating using the harvested weed as
animal fodder.
Credit: (Left, right images) NASA; (middle) LPDAAC – USGS National Center for EROS
38
39
1980s was estimated to be nearly 1.3 bil-
lion. Chickens—the world’s most abundant
domesticated bird—are generally believed
to have descended from jungle fowl in
Southeast Asia. They were subsequently
introduced into almost every country and
region of the world.
In stark contrast to such positive species
introductions are those where introduced
exotic species have become invasive. Scien-
tifically speaking, invasive species are those
organisms that are unwanted and have a
tendency to spread. Invasive species harm,
or have the potential to harm, a given
ecosystem or peoples’ health or economic
well-being (Clinton 1999). Historically,
some invasive exotic species have been
intentionally introduced into new settings;
the introduction of the common starling
into the United States and the rabbit into
Australia are two classic examples. Intro-
ductions of other invasive species have
occurred by accident, such as that of zebra
mussels into the American Great Lakes as a
result of shipping activities.
Native or indigenous species are those
that occur naturally in an area or habitat.
Invasive species often out-compete and dis-
place native species because the invaders
have no natural enemies and can spread
easily and quickly. Both managed and
natural ecosystems throughout the world
are under siege from increasing numbers
of harmful invasive species. These include
disease organisms, agricultural weeds, and
destructive insects and small mammals that
threaten economic productivity, ecological
stability, and biodiversity. On a local scale,
such invasions decrease diversity of native
flora and fauna. Globally, they contribute
to making the biosphere more homoge-
neous and less resilient.
Natural biodiversity helps to maintain
ecological resilience in the face of varying
environmental conditions (Holling et al.
1995). Invasion by exotic species lessens
ecological resilience and can transform
ecosystems in unpredictable ways that may
have negative consequences for people.
This problem is growing in severity and
geographic extent as global trade and
international travel expand, as markets
are liberalized and deregulated, as ecosys-
tems are further altered and fragmented,
and as global climate continues to change
(Brandt 2003; Dalmazzone 2000).
Invasions by alien species are set to
worsen in the next few decades if the
world continues to warm as most scientists
predict it will. Longer growing seasons
spawned by global warming may give
invasive weedy plants time to flower and
set seeds where previously they could only
spread asexually. This new-found ability
could allow the weeds to adapt to new
environments more quickly, and better
resist attack by insects. Higher levels of
carbon dioxide in the atmosphere may also
favor plants that can utilize extra carbon
dioxide and grow faster. One such example
is cheatgrass, an introduced species that
now dominates vast areas of the American
West (Holmes 1998). In other parts of the
world, invasive exotic plant species make
up 4 to 44 per cent of the total number of
species in ecosystems (Lövei 1997).
Invasive exotic species are one of the
most significant drivers of environmental
change worldwide. They also contribute
to social instability and economic hard-
ship, and place constraints on sustainable
development, economic growth, and en-
vironmental conservation. Worldwide, the
annual economic impact of invasive species
on agriculture, biodiversity, fisheries, for-
ests, and industry is enormous. The World
Conservation Union (IUCN) estimates that
the global economic costs of invasive exotic
species are about US$400 billion annually
(UNEP 2002a). Alien invaders cost 140 bil-
lion dollars a year in the USA alone (Mc-
Grath 2005). Less easily measured costs
also include unemployment, impacts on
infrastructure, shortages of food and water,
environmental degradation, increases in
the rate and severity of natural disasters,
and human illness and death. Invasive ex-
otic species represent a growing problem,
and one that is here to stay—at least for
the foreseeable future (Brandt 2003).
Protected and Wilderness Areas
Wilderness areas are those areas of land
that are relatively untouched by human
activities. To qualify as wilderness, an area
must have 70 per cent or more of its origi-
nal vegetation intact, cover at least 10 000
km2 (3 861 square miles), and be inhab-
ited by fewer than five people per km2 (12
people per square mile).
Wilderness areas are major storehouses
of biodiversity. They also provide critical
ecosystem services to the planet, including
watershed maintenance, pollination, and
carbon sequestration. Wilderness areas
currently cover nearly half the Earth’s ter-
restrial surface (Mittermeier et al. 2003).
While that represents a significant amount
of land area, however, most wilderness
areas are not protected, and are therefore
at risk.
Table 2.11 – Growth of protected areas of the world in 1994 and 2004 (in per cent)
Ratio 1994 2004
World 7.8 9.5
Developed Countries 11.3 14.1
Commonwealth Independent States (CIS) 2.8 3.0
CIS-ASIA 3.6 3.8
CIS-Europe 2.6 2.8
Developing 7.6 9.1
Northern Africa 3.5 3.9
Sub-Saharan Africa 8.1 8.3
Latin America & the Caribbean 8.0 9.9
Eastern Asia 8.2 14.2
Southern Asia 4.5 5.1
South-eastern Asia 4.8 5.9
Western Asia 21.4 22.0
Oceania 1.0 1.1
Least Developed Countries (LDCs) 7.7 7.9
Landlocked Developing Countries (LLDCs) 8.4 9.6
Small Island Developing States (SIDs) 1.6 2.8
There is considerable variation in the total area protected between regions, ranging from 1.1 per cent in
the developing countries of Oceania to 22.0 per cent in Western Asia. The percentage coverage in both
Western and Eastern Asia (14.2 per cent) exceeds the coverage of all developed countries (14.1
per cent) representing a significant commitment by these regions to conservation. However, the con-
straints imposed upon the data by the criterion for a date of establishment within the Millennium Devel-
opment Goals (MDG) reporting period suggest that all figures should be treated cautiously.
Source: UNEP-WCMC 2005
40
One of the most effective means for
conserving wilderness is through the de-
velopment of protected areas. A protected
area is an area of land (or water) especially
dedicated to the protection and mainte-
nance of biological diversity, along with
natural and associated cultural resources,
that is managed through legal or other
effective means (IUCN 1994). Protected
areas are managed for a wide variety of
purposes, including:
• scientific research;
• wilderness protection and preservation
of species and ecosystems;
• maintenance of environmental
services;
• protection of specific natural and
cultural features;
• tourism and recreation;
• education;
• sustainable use of resources from
natural ecosystems; and
• maintenance of cultural and tradition-
al attributes (Green and Paine 1997).
The 2003 United Nations List of Pro-
tected Areas—compiled by UNEP and
the IUCN and released during the Fifth
World Parks Congress in Durban, South
Africa—reveals that there are now 102 102
protected areas, together representing a
total land area roughly equivalent to China
and Canada combined, or more than 12
per cent of the Earth’s surface (Chape et
al. 2003). That total exceeds the ten
per cent called for in the Caracas Action
Plan formulated at the Fourth World Parks
Congress held in 1992 in Caracas, Venezu-
ela. Between 10 and 30 per cent of some of
the planet’s vital natural features, such as
Amazonian rain forests and tropical savan-
nah grasslands, are classified as protected
areas. However, ecoregional and habitat
representation remains uneven.
Currently, almost half of the world’s
protected areas are found in regions where
agriculture and logging are primary land-
use strategies. All indications are that food
Source: www.conservation.org
World Environmental Hotspots as identified by Conservation International.
41
and timber production will need to in-
crease in coming decades to keep up with
population growth and increasing demand
for wood and wood products. Thus, estab-
lishing additional protected areas, while
helping to preserve biological diversity, will
take land out of production and put more
stress on lands elsewhere (Sohngen et al.
1999). Balancing the need to protect wild
species and conserve habitat while at the
same time increasing agricultural and tim-
ber production represents a tremendous
challenge (McNeely and Scherr 2001).
Of the world’s protected areas, the vast
majority—91.3 per cent—are found in ter-
restrial ecosystems. Fewer than ten
per cent of the world’s lakes and less than
0.5 per cent of the world’s seas and oceans
lie within protected areas (SBSTTA 2003).
Recognizing that the world’s marine en-
vironment remains largely unprotected,
the Fifth World Parks Congress put forth
the Durban Action Plan. The Plan calls for
the establishment of at least 20-30 per cent
marine protected areas worldwide by 2012.
The Plan also calls for the conservation of
all globally threatened or endangered spe-
cies by 2010.
In the coming years, further develop-
ment of global networks of protected areas
will need to focus on four areas (Green
and Paine 1997):
• consolidating existing networks by ad-
dressing major gaps;
• physically linking protected areas to
one another so they function more ef-
fectively as networks;
• expanding networks by forming or
strengthening links with other sectors,
notably the private sector;
• and improving the effectiveness with
which protected areas are managed.
Protected areas are often considered a
kind of sacrifice, a financial burden rather
than an asset. Yet establishing, maintain-
ing, and expanding protected areas is a
fundamental approach to safe-guarding
the environment and conserving
biological diversity.
Protected areas are also important in
other respects, such as helping to maintain
freshwater resources. Protected areas may
also hold the cures to some of the world’s
most devastating diseases in the form of
unique chemical compounds and as-yet-un-
discovered genetic material.
A recent analysis published by Con-
servation International identified nine
additional sites as areas of extraordinarily
high biological diversity, popularly known
as hotspots, taking the count of hotspots to
34. These 34 regions worldwide are where
75 per cent of the planet’s most threatened
mammals, birds, and amphibians survive.
In these 34 hotspots, estimated 50 per cent
of all vascular plants and 42 per cent of
terrestrial vertebrates exist. Therefore it is
critical to protect and preserve these areas
(Conservation International 2005).
Credit: Christian Lambrechts
Credit: Topfoto
42
Case Study: Ranikhet Forests,
Sonitpur, India
S. P. S. Kushwaha, A. Khan, B. Habib, A. Quadri and A. Singh
This is a study of habitat evaluation for sambar
(Cervus unicolor var. niger) and muntjak (Munti-
acus muntjak var. vaginalis) in the Ranikhet for-
ests of Kumaon Himalaya in the northeastern
province of Sonitpur, India.
Location:
The study was carried out in the Chaubatia Re-
serve Forest (area 8428 ha) located close to the
town of Ranikhet in the Almora district in Ku-
maon Himalaya (79°24’ –79°30’ E and 29°35’
– 29°4’ N). Forests dominate the landscape in
the study area. The Kumaon region is spread
over 21 073 km2 (8 136 square miles) and had
extensive tracts of natural forests until a few
centuries ago. Though there was no scientific
exploration to document the extent of these
natural forests and in the faunal populations,
old records of naturalists and hunters docu-
ment floral and faunal richness in the region.
Extensive areas under natural forests were
cleared until to late 1940s either for valuable
timber or for planting commercially
viable species.
Five major forest types are found in Ra-
nikhet: oak forest, oak-pine forest, chirpine
forest, pure deodar and mixed deodar forests.
The study area provides diverse and favourable
habitats for a wide range of wild animals. The
most notable species are: common leopard
(Panthera pardus), red fox (Vulpes vulpes), Hima-
layan yellow-throated marten (Martes flavigula),
hanuman langur (Semnopethicus entellus), rhesus
macaque (Macaca mulatta), sambar (Cervus
unicolor), muntjak (Muntiacus muntjak) and
Kashmir flying squirrel (Hylopetes fimbriatus).
Four broad soil categories—red loam, brown
forest soil, loam and meadow soil—have been
reported from Ranikhet.
Habitat suitability analysis is considered
important for introduction, rehabilitation,
and ex-situ conservation of species and their
habitats. Habitat models are based on
the relationship between the animal
and the environment. Such models are
normally animal-centric, in this case the
two animals are sambar and muntjak,
and usually consistent with the data
needs for planning. Studies show that
both sambar and muntjak avoid human distur-
bance. The low overall suitability of Chaubatia
forest for sambar (23.89 per cent) and muntjak
(12.60 per cent) can be attributed to distur-
bance in their habitat. Hence, human activities
in the forests need to be minimized for any
effective conservation of these two species.
An analysis of the findings indicate a pri-
mary preference of sambar to high tree and
herb density but low shrub cover, and indiffer-
ence for herb diversity found in higher alti-
tudes, whereas muntjak seem to prefer regions
of high grass density on the same scale found
in relatively lower altitudes with higher herb
density and diversity. Sambar prefer sites that
score low in terms of direct human disturbance
and similar conclusions can be drawn for munt-
jak. The analysis indicates an indifference of
both the species towards logging activities when
good grass growth is resultant.
Because of increasing disturbance,
the wildlife habitats in Kumaon re-
gion are shrinking. If the situation is
not advertised, a time may come when
ungulates, which play important role in
vegetation dynamics and form a connect-
ing link in the food chain, will disappear
from these forests. Hence, necessary steps
should be taken to conserve the forests.
Source: Kushwaha et al. 2004Habitat loss (1999–2002)
Habitat loss (1994–2002)
Habitat loss (1994–1999)
Credit: Dr. Bibhab Talukdar
42
Sonitpur
Map of Study Area
43
2.6 Energy
Consumption
and Resource
Extraction
Energy is measured by its capacity to do work
(potential energy) or the conversion of this
capacity to motion (kinetic energy). Most of the
world’s convertible energy comes from fossil fu-
els that are burned to produce heat that is then
converted to mechanical energy or other means
in order to accomplish tasks (EIA 2004a).
Energy is essential for the fulfillment of many
basic human needs, such as generating electric-
ity, heating and cooling living spaces, cooking
food, forging steel, and powering engines for
many forms of transportation (Harrison and
Pearce 2001). Energy use is closely tied to hu-
man health and well-being. Worldwide, roughly
2 000 million people do not have access to elec-
tricity. Countries in which energy use is low tend
to have high infant mortality rates, low literacy
rates, and low life expectancies. It is through
the utilization of convertible energy sources that
the modern world has transcended its agrarian
roots and fostered the energy-driven societies
that characterize it today. Generating the power
to sustain these societies has entailed extract-
ing massive amounts of natural resources from
the planet. Extraction is the process of obtain-
Credit: Topfoto
Credit: NOAA, NASANightlight Map of the World
44
ing a useful substance from a raw material
(NCR&LB 2003). Such raw materials may
include fossil fuels, metals, minerals, water,
and biomass, including animals and raw
materials from plants and crops
(EEA 2001).
Resources can be divided into those that
are renewable, such as plant and animal
material, and those that are not, including
coal, oil, and minerals. The Earth has a
finite supply of non-renewable resources.
Even renewable resources, however, are
exhaustible if they are used faster than they
can be replenished.
Total world energy consumption has
risen almost 70 per cent since 1971 (WRI
1998). It is expected to increase by 58 per
cent between 2001 and 2025, from 404
quadrillion British thermal units (Btu) in
2001 to 640 quadrillion Btu in 2025 (EIA
2003; EIA 2004b). While a slow, steady in-
crease in energy consumption is expected
in industrialized nations, where most en-
ergy use currently takes place, a meteoric
increase in consumption is anticipated in
the developing world during that period
(Tilford 2000).
The tempo at which energy resources
are being used to fuel modern societies
is rapidly depleting supplies of non-re-
newable resources and far exceeding the
rate at which renewable resources can be
naturally renewed (Ernst 2002). In many
least–developed countries, for instance,
burning biomass in the form of wood
(largely a non-renewable resource) gener-
ates 70 to 90 per cent of the energy needed
and disregard for the fate of non-renew-
able resources is prevalent. In the United
States, for example, 72 per cent of the
country’s electricity is generated using non-
renewable resources. Only about 10 per
cent comes from renewable resources, with
nuclear power providing the rest.
Currently, 85 per cent of world energy
consumption comes from the burning of
fossil fuels—oil, coal, and natural gas (BP
2003). Although no immediate shortages
of these non-renewable energy resources
exist, supplies are finite and will not last
forever. What took millions of years to
Global Natural Resources
Affluent countries consume vast quantities of global natural resources, but contribute
proportionately less to the extraction of many raw materials. This imbalance is due, in
part, to domestic attitudes and policies intended to protect the environment. Ironically,
developed nations are often better equipped to extract resources in an environmentally
prudent manner than the major suppliers. Thus, although citizens of affluent countries
may imagine that preservationist domestic policies are conserving resources and
protecting nature, heavy consumption rates necessitate resource extraction elsewhere and
oftentimes with weak environmental oversight. A major consequence of this “illusion of
natural resource preservation” is greater global environmental degradation than would
arise if consumption were reduced and a larger portion of production was shared by
affluent countries. Clearly, environmental policy needs to consider the global distribution
and consequences of natural resource extraction (Berlik et al. 2002).
Case Study: Blackout in
United States and Canada
14 August 2003
On 14 August 2003, parts of the northeastern
United States and southeastern Canada expe-
rienced widespread power blackouts. Among
the major urban agglomerations affected by the
electrical power outage were the cities of New
York City, Albany, and Buffalo in New York,
Cleveland and Columbus in Ohio, Detroit in
Michigan, and Ottawa and Toronto in Ontario,
Canada. Other U.S. states, including New
Jersey, Vermont, Pennsylvania, Connecticut,
and Massachusetts, were also affected. The
blackout resulted in the shutting down of
nuclear power plants in New York and Ohio,
and air traffic was slowed as flights into affected
airports were halted. Approximately 50 mil-
lion people were affected by the outage. The
change in the nighttime city lights is apparent
in this pair of Defense Meteorological Satel-
lite Program (DMSP) satellite images. The top
image was acquired on 14 August, about 20
hours before the blackout, and the bottom im-
age shows the same area on 15 August, roughly
seven hours after the blackout. In the
bottom scene, notice how the lights in
Detroit, Cleveland, Columbus, Toron-
to, and Ottowa are either missing or
visibly reduced. Previous major black-
outs include the 9 November 1965
outage caused by a faulty relay at a
power plant in Ontario, which affected
a large swath of land stretching from
Toronto to New York. Another one
followed on 14 July 1977, the result of
a lightning strike, affecting New York
City. The power supply in nine west-
ern states was also affected in August
1996 as a result of a high demand for
electricity, a heat wave, and sagging
electrical power lines.
Source: NASA 2002, http://earthobservatory.nasa.
gov/NaturalHazards/natural_hazards_v2.php3?img_
id=11628; GlobalSecurity.org 2003, http://www.
globalsecurity.org/eye/blackout_2003.htm
Credit Image courtesy Chris Elvidge, U.S. Air Force http://earthobservatory.
nasa.gov/NaturalHazards/Archive/Aug2003/NE_US_OLS2003227_lrg.jpg
Credit: Topfoto
44
45
Case Study: SWERA, the Solar and Wind
Energy Resource Assessment
The Solar and Wind Energy Resource Assessment
(SWERA)—co-financed by the Global Environ-
ment Facility (GEF)—is a project to assist 13 devel-
oping countries identify optimal locations for po-
tential solar and wind energy production. SWERA
assists by creating a global archive of information
gathered through a network of international and
national agencies. These agencies collect and
analyse data on solar and wind energy resources,
energy demand, and electrification. Using inputs
derived from satellite and surface observations,
SWERA partners model wind and solar energy re-
source potential and produce maps of wind power
density and monthly average and daily total solar
radiation of a given area. This information can
then be used to facilitate investments and create
policies in the participating countries for develop-
ing solar and wind energy.
Source: UNEP/GRID–Sioux Falls
Credit: NREL
Credit: NREL
45
Credit: NREL
46
produce will be consumed in the time
frame of a century or two (Hawken 1994;
Tilford 2000).
This rapid, large-scale consumption of a
fuel source that took millennia to produce
has generated unforeseen complications,
several with global implications. Burning
fossil fuels produces atmospheric pollutants
such as oxides of sulfur and nitrogen and
unburned hydrocarbons. Fossil fuel com-
bustion also adds one of the most prevalent
greenhouse gases—carbon dioxide—to the
atmosphere. As a result, world energy use
has emerged at the center of the climate
change debate. World carbon dioxide emis-
sions are projected to rise from
23 900 million metric tonnes in 2001 to
27 700 million metric tonnes in 2010 and
37 100 million metric tonnes in 2025 (EIA
2004b). The Earth’s atmosphere and bio-
sphere will not remain unchanged by the
combustion of such enormous amounts of
these fuels. The relatively sudden release of
massive amounts of carbon has the poten-
tial not only to disrupt the Earth’s heat
balance and climate, but other parts of
the global carbon cycle as well, and in
unpredictable ways.
The Earth cannot sustain existing levels
of resource consumption. Furthermore,
resource extraction methods are often
environmentally destructive. The impact
of environmental degradation hits those
who are poorest the hardest. Many of the
world’s energy sources and other natural
resources come from developing countries.
Extracting and harvesting these resources
can result in air, soil, and water pollution.
It also generates waste; the amount of waste
associated with extracting minerals, for
instance, can be enormous. Disposing of
wastes in environmentally friendly ways is
a daunting, if not impossible, task in many
developing nations.
A major challenge for the 21st century
is to develop methods of generating and us-
ing energy that meet the needs of the popu-
lation while protecting the planet (Harri-
son and Pearce 2001). Yet most of the world
is still without energy policies that direct or
restrict consumption patterns.
Only through conservation and resource
recovery strategies can we hope to reach a
sustainable balance between available re-
sources and their consumption. The utiliza-
Biomass
Plant and animal material, or biomass, is a
rich source of carbon compounds. When
burned to release energy, biomass does not
add additional carbon to the natural carbon
cycle as do fossil fuels. Fast-growing plants,
such as switchgrass, willow, and poplar can
be harvested and used as “energy crops.”
Biomass wastes, including forest residues,
lumber and paper mill waste, crop wastes,
garbage, and landfill and sewage gas, can be
used for heating, as transportation fuels, and
to produce electricity, while at the same time
reducing environmental burdens. According
to the World Bank, 50 to 60 per cent of the en-
ergy used in developing countries in Asia, and
70 to 90 per cent used in developing countries
in Africa, comes from wood or other biomass;
half the world cooks with wood.
Coal
Coal is the world’s largest source of fuel for
electricity production. The byproducts of coal
combustion are also a major source of envi-
ronmental damage.
Natural Gas
Compared to coal and oil, natural gas is a
relatively clean-burning fossil fuel. It is used
primarily for heating and for powering many
industrial processes. Increasingly, natural gas
is burned to drive turbines used in the pro-
duction of electricity.
Oil
Although used primarily in the production
of transportation fuels, oil is also used for
generating electricity, for heating, and in the
production of chemical compounds and syn-
thetic materials.
Sources of Energy
Credit: www.freefoto.com
Credit: Volker Quaschning
Sources:
www.freefoto.com, http://www.topfoto.co.uk/, Prof. Dr.-Ing. habil. Volker Quaschning http://www.volker-quaschning.de
47
Wind
Wind power is an ancient energy source
that has moved into the modern era. Aero-
dynamically designed wind turbines can
produce electricity more cheaply than coal-
burning power plants.
Wind power is an ancient energy source
Geothermal
Geothermal energy is energy contained in
intense heat that continually flows outward
from deep within the Earth. Geothermal
energy is typically used to heat water, which
is then used to heat buildings directly or to
drive turbines to produce electricity.
Solar
Solar energy—power from the sun—is
readily available and inexhaustible. Hu-
mans have used sunlight for heating and
drying for thousands of years. Converting
the power of sunlight into usable energy
forms, such as electricity, is not without
cost, but the sunlight itself is free. Solar
cells, or photovoltaics, are devices used to
transform sunlight into electric current.
Hydroelectric
Hydroelectric power uses the force of mov-
ing water to produce electricity. A large
part of the world’s electricity is produced in
hydroelectric plants. Many of these plants,
however, are associated with large dams that
disrupt habitats and displace people. Small-
er “run of the river” hydroelectric plants
have less environmental impact.
tion of non-renewable resources is
theoretically not sustainable. But if used
wisely, some non-renewable resources can
be conserved and recycled for a very long
time. To recycle means to make new prod-
ucts from old ones. Recycling materials
such as paper, aluminum, and glass saves
energy, reduces pollution, and conserves
natural resources (EPA 2003). Every nation
must assume responsibility for recycling
its own wastes. Some industrialized West-
ern countries “dispose” of their electronic
wastes by shipping them to Asia—an in-
creasingly common practice (FOEE 2004).
To insure that renewable resources
can be replenished at a sustainable rate,
people must switch to more environmen-
tally friendly energy sources and employ
new technologies that can help make such
sustainability a reality (Ernst 2002). Indeed,
new technologies—coupled with effective
and efficient use of existing technologies—
are essential to increasing the capabilities
of countries to achieve sustainable devel-
opment on many fronts, as well as sustain-
ing the world’s economy, protecting the
environment, and alleviating poverty and
human suffering (Hay and Noonan 2000).
Most changes in the Earth, including
changes brought about by increasing ener-
gy consumption, can be observed through
such tools as remote sensing. Remote
sensing is the collection of information
about an object without being in physical
contact with the object. Aircraft and satel-
lites are the common platforms from which
remote sensing observations are made.
Satellite imagery, a crucial component of
this publication, is especially useful for
studying changes in our Earth’s environ-
ment. Most satellite imagery is collected
using multispectral scanners, which record
light intensities in different wavelengths in
the spectrum from infrared through vis-
ible light through ultraviolet light. Satel-
lite imagery is useful because of its stable
nature (same resolution, same time, same
data characteristics). Aided by the global
positioning system (GPS), these satellites
know their orbital position precisely. Thus,
satellite imagery is ideally suited for applica-
tions requiring large-area coverage, such as
agricultural monitoring, regional mapping,
environmental assessment, and infrastruc-
ture planning (Krouse et al. 2000).
Nuclear
Nuclear power harnesses the heat of ra-
dioactive materials to produce steam for
electricity generation. The use of nuclear
power is expected to decline as aging
plants are taken out of operation.
Credit: Volker Quaschning
Credit: www.freefoto.com
Credit: Topfoto
Credit: Topfoto
Credit: Topfoto
48
THE BLACK TRIANGLE, EUROPE
MINING
The so-called Black Triangle is an area bordered by Germany, Poland, and
the Czech Republic and is the site of extensive surface coal mining opera-
tions. In the 1975 satellite image above, the gray areas are surface mines
located primarily in the Czech Republic. Air-borne pollutants from coal
extraction activities tended to become trapped by the mountainous ter-
rain to the northeast and were concentrated in the area around the mines,
48
48
49
eventually causing severe deforestation along the border between the Czech
Republic and Germany. In the 2000 image, this deforestation is very obvi-
ous, appearing as large brownish patches. Interestingly, the 2000 image also
reveals somewhat improved vegetation cover—a slight“greening”of the
landscape—as compared to conditions in 1975. Some of this improvement
may be attributable to actions taken by the three countries bordering the
Black Triangle to reduce pollutants produced by the mining operations. The
implementation of anti-pollution technologies, including circulating fluid-
ized-bed boilers, clean coal technology, and nitrous oxide emission burners,
appears to have reversed some, albeit not all, of the environmental damage
experienced by the region as a result of the mines.
49
50
COPSA MICA, ROMANIA
Copsa Mica is a large industrial city located in the very center of
Romania and is classified as an “environmental disaster area.” The en-
vironmentally damaged area covers hundreds of square kilometres of
land. The main industries in Copsa Mica are non-ferrous metalworking
and chemical processing plants, and their effect on the environment
has been devastating. Air pollution by heavy metals is 600 times
In one year up to 67 000 tonnes of sulfur dioxide, 500 tonnes of lead, 400
tonnes of zinc and 4 tonnes of cadmium can be released by the city’s two ac-
tive smelters. The affected area is huge: in excess of 180 000 hectares (445 000
acres) of land are affected by air pollution and 150 000 hectares (371 000 acres)
of agricultural land are untenable. 31 000 hectares (77 000 acres) of forest are
also unacceptably polluted.
50
MINING
Credit: Lorant Czaran
¸
¸
¸
51
the allowed levels. To make matters worse, a lead-smelting facility emitted
fumes containing sulfur dioxide, lead, cadmium, and zinc on the town and
surrounding area for 50 km2 (19 square miles). The entire town and much of
the surrounding area were covered with a blanket of black soot daily until the
facilities were forced to close in 1993.
In 1989 Copsa Mica was exposed as one of the most polluted places in
Europe. It has the highest infant mortality rate in Europe, 30.2 per cent of
children suffer reduced“lung function”and 10 per cent of the total popula-
tion of 20 000 suffer“neurobehavioral problems.” The soil and the local food
chain probably will remain contaminated for at least another three decades.
51
¸
52
ESCONDIDA, CHILE
Located at an elevation of 3 050 m (10 006 ft), Chile’s Escondida Mine
is an open-pit copper, gold, and silver mine and also the largest cop-
per mine in the world. Isolated in the barren, arid Atacama Desert in
the country’s far north, the Escondida Mine relies heavily on external
well fields for the water used in its mining operations. Unlike similar
mining operations, however, Escondida has a redeveloped tailings
52
MINING
53
impoundment, which appears on the 1989 image as a white patch in the
lower left corner. Impoundments of this type help reduce water consump-
tion and enhance water conservation, two areas where mining activities
typically fall short. The Escondida Mine also minimizes the impact of its
operation on the environment by means of a 170-km-long (106 miles) un-
derground pipeline that carries copper concentrate slurry from the mine to
the port of Coloso. This underground scheme is efficient and ecologically
sound, as the copper travels downhill without disrupting the environment.
The 2003 image shows how the Escondida Mine has grown and expanded
while at the same time continues to minimize negative impacts from its
mining operations on the environment.
53
54
EKATI, CANADA
As of 2001, the Ekati Mine was North America’s only operating dia-
mond mine. Located in the north central Northwestern Territories
(NWT) of Canada, the mine yields raw diamonds from a sparsely
inhabited sub-arctic region. Air transport connects mine personnel
and supplies year-round, while a single winter ice road provides the
only vehicular access just ten weeks per year.
54
MINING
55
Expanded mining exploration in the 1990s began a new era for this other-
wise undeveloped region. Wildlife officials have collared and tracked caribou,
in a herd ranging from 350 000 to half a million, to monitor their movement
and behavior in proximity to the mines. Historical information about the
herds comes from Dogrib and Inuit knowledge obtained from elder natives
who still inhabit the NWT, and who have depended on the caribou
for centuries.
These two images compare the same area, pre-mining and after mine op-
erations have commenced. The white patch in the northwest portion of the
2000 image represents the mine and the associated infrastructure.
55
56
OK TEDI MINE, PAPUA NEW GUINEA
The controversial Ok Tedi copper mine is located at the
headwaters of the Ok Tedi River, a tributary of the Fly River,
in extremely rough terrain in the rainforest-covered Star
Mountains of Papua New Guinea’s western province. Prior
to the opening of the mine in 1984, this area was very
isolated, sparsely inhabited, and ecologically pristine. This56
MINING
57
pair of satellite images reveals the tremendous environmental impact the
mine has had in 20 years. The uncontrolled discharge of 70 million tonnes of
waste rock and mine tailings annually has spread more than 1 000 km (621
miles) down the Ok Tedi and Fly rivers, raising river beds and causing flood-
ing, sediment deposition, forest damage, and a serious decline in the area’s
biodiversity. In the 1990 image, both the mine and the township of Tabu-
bil—developed east of the river in support of the mine—are clearly visible.
Lighter patches of green show disturbance of the original forest cover from
subsistence agriculture, road clearing, and other infrastructure development.
57
58
POWDER RIVER BASIN, UNITED STATES
The Powder River basin, located in northeast Wyoming
and southeast Montana, is a core area of coal and natural
gas production in the United States. Coal mining activities
in the basin date back to 1975.
In recent years surface mining in Wyoming has mush-
roomed, making it the leading coal producer in America58
MINING
59
at almost 300 000 tonnes per year. Similarly, coal bed methane gas develop-
ment in this region is unrivaled in the U.S.
The images show areas under coal exploitation. Notable is the remarkable
increase in mining operations in the 2001 image. Reasons for the expansion
include improvements in the area’s rail network, the high grade of the coal
deposits, and the depletion of high-grade deposits in other major coal min-
ing areas such as West Virginia and Kentucky.
The open cast coal mines appear as white-purplish while the reddish
brown areas are bare ground. Vegetated areas are green.
59
60
WEIPA BAUXITE MINE, AUSTRALIA
Mining of bauxite (aluminum ore) began at Weipa, on the Cape York
Pennisula in Queensland, Australia, in 1963. The mine produces 8.5
metric tonnes of ore annually, making it one of the world’s largest
open-cut bauxite mines.
Under current mining practices, vegetation is cleared and the
topsoil is removed and either stockpiled for later use or immediately
60
MINING
Atlas chapter2 screen

Más contenido relacionado

La actualidad más candente

Les recommandations du GIEC aux politiques
Les recommandations du GIEC aux politiquesLes recommandations du GIEC aux politiques
Les recommandations du GIEC aux politiquesPaperjam_redaction
 
The Meaning of Land in Myanmar
The Meaning of Land in MyanmarThe Meaning of Land in Myanmar
The Meaning of Land in MyanmarMYO AUNG Myanmar
 
WWF Living Planet 2018-Summary Report
WWF Living Planet 2018-Summary ReportWWF Living Planet 2018-Summary Report
WWF Living Planet 2018-Summary ReportEnergy for One World
 
Project on Air Pollution in the context of Ethiopia based on Kaizen philosoph...
Project on Air Pollution in the context of Ethiopia based on Kaizen philosoph...Project on Air Pollution in the context of Ethiopia based on Kaizen philosoph...
Project on Air Pollution in the context of Ethiopia based on Kaizen philosoph...berhanu taye
 
Boulding Award Speech to ISEE 2012 by Mathis Wackemagel
Boulding Award Speech to ISEE 2012 by Mathis WackemagelBoulding Award Speech to ISEE 2012 by Mathis Wackemagel
Boulding Award Speech to ISEE 2012 by Mathis WackemagelOlinda Services
 
Lecture 20 change conflict crisis 4 environment and development
Lecture 20 change conflict crisis 4 environment and developmentLecture 20 change conflict crisis 4 environment and development
Lecture 20 change conflict crisis 4 environment and developmentdavid roberts
 
Resources 3.1 3.7 3.8
Resources 3.1 3.7 3.8Resources 3.1 3.7 3.8
Resources 3.1 3.7 3.8njcotton
 
Population growth and sustainable land management in india
Population growth and sustainable land management in indiaPopulation growth and sustainable land management in india
Population growth and sustainable land management in indiaAlexander Decker
 
human population environment
human population environmenthuman population environment
human population environmentYash Patel
 
ENVIRONMENT AND DEVELOPMENT
ENVIRONMENT AND DEVELOPMENTENVIRONMENT AND DEVELOPMENT
ENVIRONMENT AND DEVELOPMENTFarajaGasto100
 
2019 welcome to the anthropocene cemus
2019 welcome to the anthropocene cemus2019 welcome to the anthropocene cemus
2019 welcome to the anthropocene cemusOwen Gaffney
 
population ecology
population ecologypopulation ecology
population ecologyimlovestruck
 

La actualidad más candente (19)

Les recommandations du GIEC aux politiques
Les recommandations du GIEC aux politiquesLes recommandations du GIEC aux politiques
Les recommandations du GIEC aux politiques
 
The Meaning of Land in Myanmar
The Meaning of Land in MyanmarThe Meaning of Land in Myanmar
The Meaning of Land in Myanmar
 
WWF Living Planet 2018-Summary Report
WWF Living Planet 2018-Summary ReportWWF Living Planet 2018-Summary Report
WWF Living Planet 2018-Summary Report
 
Human Population growth
Human Population growthHuman Population growth
Human Population growth
 
Project on Air Pollution in the context of Ethiopia based on Kaizen philosoph...
Project on Air Pollution in the context of Ethiopia based on Kaizen philosoph...Project on Air Pollution in the context of Ethiopia based on Kaizen philosoph...
Project on Air Pollution in the context of Ethiopia based on Kaizen philosoph...
 
Boulding Award Speech to ISEE 2012 by Mathis Wackemagel
Boulding Award Speech to ISEE 2012 by Mathis WackemagelBoulding Award Speech to ISEE 2012 by Mathis Wackemagel
Boulding Award Speech to ISEE 2012 by Mathis Wackemagel
 
Population and environment
Population and environmentPopulation and environment
Population and environment
 
Lecture 20 change conflict crisis 4 environment and development
Lecture 20 change conflict crisis 4 environment and developmentLecture 20 change conflict crisis 4 environment and development
Lecture 20 change conflict crisis 4 environment and development
 
Resources 3.1 3.7 3.8
Resources 3.1 3.7 3.8Resources 3.1 3.7 3.8
Resources 3.1 3.7 3.8
 
Population growth and sustainable land management in india
Population growth and sustainable land management in indiaPopulation growth and sustainable land management in india
Population growth and sustainable land management in india
 
human population environment
human population environmenthuman population environment
human population environment
 
Population ecology
Population ecologyPopulation ecology
Population ecology
 
ENVIRONMENT AND DEVELOPMENT
ENVIRONMENT AND DEVELOPMENTENVIRONMENT AND DEVELOPMENT
ENVIRONMENT AND DEVELOPMENT
 
2019 welcome to the anthropocene cemus
2019 welcome to the anthropocene cemus2019 welcome to the anthropocene cemus
2019 welcome to the anthropocene cemus
 
population ecology
population ecologypopulation ecology
population ecology
 
Unit 8 towards_sustainable_future
Unit 8 towards_sustainable_futureUnit 8 towards_sustainable_future
Unit 8 towards_sustainable_future
 
08 hum pop1
08 hum pop108 hum pop1
08 hum pop1
 
Lecture 5 ns 5 2010
Lecture 5 ns 5 2010Lecture 5 ns 5 2010
Lecture 5 ns 5 2010
 
Chapt09 lecture
Chapt09 lectureChapt09 lecture
Chapt09 lecture
 

Similar a Atlas chapter2 screen

Population growth implications for environmental sustaintability
Population growth implications for environmental sustaintabilityPopulation growth implications for environmental sustaintability
Population growth implications for environmental sustaintabilityarmandogo92
 
Population development and environment
Population development and environmentPopulation development and environment
Population development and environmentpopulation scientist
 
Human Population and the Environment
Human Population and the EnvironmentHuman Population and the Environment
Human Population and the EnvironmentWhitney
 
Sustainable dev szabo_a
Sustainable dev szabo_aSustainable dev szabo_a
Sustainable dev szabo_aAntal Szabo
 
IPCC Special Report on Climate Change and Land Use (2019)
IPCC Special Report on Climate Change and Land Use (2019)IPCC Special Report on Climate Change and Land Use (2019)
IPCC Special Report on Climate Change and Land Use (2019)Energy for One World
 
Period 7 - Teresa Benites - World Overpopulation
Period 7 - Teresa Benites - World OverpopulationPeriod 7 - Teresa Benites - World Overpopulation
Period 7 - Teresa Benites - World Overpopulationmrsalcido
 
Distribution Of Population: Factors reposible for uneven distribution of popu...
Distribution Of Population: Factors reposible for uneven distribution of popu...Distribution Of Population: Factors reposible for uneven distribution of popu...
Distribution Of Population: Factors reposible for uneven distribution of popu...Sadia Rahat
 
Biodiversity and Human Population Growth
Biodiversity and Human Population GrowthBiodiversity and Human Population Growth
Biodiversity and Human Population Growthmashapiro
 
The Anthropocene: Global Change and the Earth System
The Anthropocene: Global Change and the Earth SystemThe Anthropocene: Global Change and the Earth System
The Anthropocene: Global Change and the Earth SystemMcGuinness Institute
 
Population growth, variation among nations
Population growth, variation among nationsPopulation growth, variation among nations
Population growth, variation among nationsHarsh Rastogi
 
498R Final Risk Comm Report
498R Final Risk Comm Report498R Final Risk Comm Report
498R Final Risk Comm ReportDemitra Salteris
 
Ecosystems 5 Biodiversity And Humans
Ecosystems 5 Biodiversity And HumansEcosystems 5 Biodiversity And Humans
Ecosystems 5 Biodiversity And HumansEcumene
 
Fighting+for+Our+Shared+Future+-+ELC+(Full+Page+Read)+-+Updated+12_29
Fighting+for+Our+Shared+Future+-+ELC+(Full+Page+Read)+-+Updated+12_29Fighting+for+Our+Shared+Future+-+ELC+(Full+Page+Read)+-+Updated+12_29
Fighting+for+Our+Shared+Future+-+ELC+(Full+Page+Read)+-+Updated+12_29Brittany N. Carmon
 
Critical Analysis Of Sustainability Principles
Critical Analysis Of Sustainability PrinciplesCritical Analysis Of Sustainability Principles
Critical Analysis Of Sustainability PrinciplesTracy Berry
 

Similar a Atlas chapter2 screen (20)

Population growth implications for environmental sustaintability
Population growth implications for environmental sustaintabilityPopulation growth implications for environmental sustaintability
Population growth implications for environmental sustaintability
 
Population development and environment
Population development and environmentPopulation development and environment
Population development and environment
 
Environmental Degradation Essay
Environmental Degradation EssayEnvironmental Degradation Essay
Environmental Degradation Essay
 
Human Population and the Environment
Human Population and the EnvironmentHuman Population and the Environment
Human Population and the Environment
 
Environmental Refugee
Environmental RefugeeEnvironmental Refugee
Environmental Refugee
 
Sustainable dev szabo_a
Sustainable dev szabo_aSustainable dev szabo_a
Sustainable dev szabo_a
 
IPCC Special Report on Climate Change and Land Use (2019)
IPCC Special Report on Climate Change and Land Use (2019)IPCC Special Report on Climate Change and Land Use (2019)
IPCC Special Report on Climate Change and Land Use (2019)
 
The Importance Of Overpopulation
The Importance Of OverpopulationThe Importance Of Overpopulation
The Importance Of Overpopulation
 
Period 7 - Teresa Benites - World Overpopulation
Period 7 - Teresa Benites - World OverpopulationPeriod 7 - Teresa Benites - World Overpopulation
Period 7 - Teresa Benites - World Overpopulation
 
Distribution Of Population: Factors reposible for uneven distribution of popu...
Distribution Of Population: Factors reposible for uneven distribution of popu...Distribution Of Population: Factors reposible for uneven distribution of popu...
Distribution Of Population: Factors reposible for uneven distribution of popu...
 
EPQ essay
EPQ essayEPQ essay
EPQ essay
 
Biodiversity and Human Population Growth
Biodiversity and Human Population GrowthBiodiversity and Human Population Growth
Biodiversity and Human Population Growth
 
The Anthropocene: Global Change and the Earth System
The Anthropocene: Global Change and the Earth SystemThe Anthropocene: Global Change and the Earth System
The Anthropocene: Global Change and the Earth System
 
Essay On Conservation Of Nature
Essay On Conservation Of NatureEssay On Conservation Of Nature
Essay On Conservation Of Nature
 
Population growth, variation among nations
Population growth, variation among nationsPopulation growth, variation among nations
Population growth, variation among nations
 
498R Final Risk Comm Report
498R Final Risk Comm Report498R Final Risk Comm Report
498R Final Risk Comm Report
 
Is The World Overpopulated Essay
Is The World Overpopulated EssayIs The World Overpopulated Essay
Is The World Overpopulated Essay
 
Ecosystems 5 Biodiversity And Humans
Ecosystems 5 Biodiversity And HumansEcosystems 5 Biodiversity And Humans
Ecosystems 5 Biodiversity And Humans
 
Fighting+for+Our+Shared+Future+-+ELC+(Full+Page+Read)+-+Updated+12_29
Fighting+for+Our+Shared+Future+-+ELC+(Full+Page+Read)+-+Updated+12_29Fighting+for+Our+Shared+Future+-+ELC+(Full+Page+Read)+-+Updated+12_29
Fighting+for+Our+Shared+Future+-+ELC+(Full+Page+Read)+-+Updated+12_29
 
Critical Analysis Of Sustainability Principles
Critical Analysis Of Sustainability PrinciplesCritical Analysis Of Sustainability Principles
Critical Analysis Of Sustainability Principles
 

Más de João Soares

DANÇAR O ZEN: APRENDIZADO E POÉTICAS DE UM PROCESSO
DANÇAR O ZEN: APRENDIZADO E POÉTICAS DE UM PROCESSODANÇAR O ZEN: APRENDIZADO E POÉTICAS DE UM PROCESSO
DANÇAR O ZEN: APRENDIZADO E POÉTICAS DE UM PROCESSOJoão Soares
 
How Google enables Big Oil’s greenwashing-Final Report
How Google enables Big Oil’s greenwashing-Final ReportHow Google enables Big Oil’s greenwashing-Final Report
How Google enables Big Oil’s greenwashing-Final ReportJoão Soares
 
The Entropy Law and the Economic Process
The Entropy Law and the Economic ProcessThe Entropy Law and the Economic Process
The Entropy Law and the Economic ProcessJoão Soares
 
E-Livro - Elogio da Loucura, por Erasmo de Roterdão
E-Livro - Elogio da Loucura, por Erasmo de RoterdãoE-Livro - Elogio da Loucura, por Erasmo de Roterdão
E-Livro - Elogio da Loucura, por Erasmo de RoterdãoJoão Soares
 
Constituição da República Portuguesa 1976
Constituição da República Portuguesa 1976Constituição da República Portuguesa 1976
Constituição da República Portuguesa 1976João Soares
 
War is a crime against humanity: The Story of War Resisters’ International
War is a crime against humanity: The Story of War Resisters’ InternationalWar is a crime against humanity: The Story of War Resisters’ International
War is a crime against humanity: The Story of War Resisters’ InternationalJoão Soares
 
Extending Russia: Competing from Advantageous Ground
Extending Russia: Competing from Advantageous GroundExtending Russia: Competing from Advantageous Ground
Extending Russia: Competing from Advantageous GroundJoão Soares
 
Pensar Portugal – A modernidade de um país antigo
Pensar Portugal – A modernidade de um país antigoPensar Portugal – A modernidade de um país antigo
Pensar Portugal – A modernidade de um país antigoJoão Soares
 
Vista do Ethos Mundial - Um consenso mínimo entre os humanos.pdf
Vista do Ethos Mundial - Um consenso mínimo entre os humanos.pdfVista do Ethos Mundial - Um consenso mínimo entre os humanos.pdf
Vista do Ethos Mundial - Um consenso mínimo entre os humanos.pdfJoão Soares
 
Bulletin of the Atomic Scientisits 2024-Doomsday-Clock-Statement
Bulletin of the Atomic Scientisits 2024-Doomsday-Clock-StatementBulletin of the Atomic Scientisits 2024-Doomsday-Clock-Statement
Bulletin of the Atomic Scientisits 2024-Doomsday-Clock-StatementJoão Soares
 
The Man in The High Castle Philip K. Dick
The Man in The High Castle Philip K. DickThe Man in The High Castle Philip K. Dick
The Man in The High Castle Philip K. DickJoão Soares
 
o homem do castelo alto - philip k. dick
o homem do castelo alto - philip k. dicko homem do castelo alto - philip k. dick
o homem do castelo alto - philip k. dickJoão Soares
 
Falsas catástrofes invisíveis e ameaças de destruição
Falsas catástrofes invisíveis e ameaças de destruiçãoFalsas catástrofes invisíveis e ameaças de destruição
Falsas catástrofes invisíveis e ameaças de destruiçãoJoão Soares
 
Cronologia das organizações de direita (1973-1976)
Cronologia das organizações de direita (1973-1976)Cronologia das organizações de direita (1973-1976)
Cronologia das organizações de direita (1973-1976)João Soares
 
Introdução ao pensamento feminista negro
Introdução ao pensamento feminista negroIntrodução ao pensamento feminista negro
Introdução ao pensamento feminista negroJoão Soares
 
Queer Palestine and the Empire of Critique
Queer Palestine and the Empire of CritiqueQueer Palestine and the Empire of Critique
Queer Palestine and the Empire of CritiqueJoão Soares
 
Livro - Modernidade liquida por Zygmunt Bauman
Livro - Modernidade liquida por Zygmunt BaumanLivro - Modernidade liquida por Zygmunt Bauman
Livro - Modernidade liquida por Zygmunt BaumanJoão Soares
 
Um Manifesto Anarquista - Louisa Sarah Bevington
Um Manifesto Anarquista - Louisa Sarah BevingtonUm Manifesto Anarquista - Louisa Sarah Bevington
Um Manifesto Anarquista - Louisa Sarah BevingtonJoão Soares
 
Inquérito aos Hábitos de Leitura dos Estudantes do 1.º Ciclo do Ensino Superi...
Inquérito aos Hábitos de Leitura dos Estudantes do 1.º Ciclo do Ensino Superi...Inquérito aos Hábitos de Leitura dos Estudantes do 1.º Ciclo do Ensino Superi...
Inquérito aos Hábitos de Leitura dos Estudantes do 1.º Ciclo do Ensino Superi...João Soares
 
Tese Doutoramento sobre a "cunha" em Portugal - João Ribeiro
Tese  Doutoramento sobre a "cunha" em Portugal - João RibeiroTese  Doutoramento sobre a "cunha" em Portugal - João Ribeiro
Tese Doutoramento sobre a "cunha" em Portugal - João RibeiroJoão Soares
 

Más de João Soares (20)

DANÇAR O ZEN: APRENDIZADO E POÉTICAS DE UM PROCESSO
DANÇAR O ZEN: APRENDIZADO E POÉTICAS DE UM PROCESSODANÇAR O ZEN: APRENDIZADO E POÉTICAS DE UM PROCESSO
DANÇAR O ZEN: APRENDIZADO E POÉTICAS DE UM PROCESSO
 
How Google enables Big Oil’s greenwashing-Final Report
How Google enables Big Oil’s greenwashing-Final ReportHow Google enables Big Oil’s greenwashing-Final Report
How Google enables Big Oil’s greenwashing-Final Report
 
The Entropy Law and the Economic Process
The Entropy Law and the Economic ProcessThe Entropy Law and the Economic Process
The Entropy Law and the Economic Process
 
E-Livro - Elogio da Loucura, por Erasmo de Roterdão
E-Livro - Elogio da Loucura, por Erasmo de RoterdãoE-Livro - Elogio da Loucura, por Erasmo de Roterdão
E-Livro - Elogio da Loucura, por Erasmo de Roterdão
 
Constituição da República Portuguesa 1976
Constituição da República Portuguesa 1976Constituição da República Portuguesa 1976
Constituição da República Portuguesa 1976
 
War is a crime against humanity: The Story of War Resisters’ International
War is a crime against humanity: The Story of War Resisters’ InternationalWar is a crime against humanity: The Story of War Resisters’ International
War is a crime against humanity: The Story of War Resisters’ International
 
Extending Russia: Competing from Advantageous Ground
Extending Russia: Competing from Advantageous GroundExtending Russia: Competing from Advantageous Ground
Extending Russia: Competing from Advantageous Ground
 
Pensar Portugal – A modernidade de um país antigo
Pensar Portugal – A modernidade de um país antigoPensar Portugal – A modernidade de um país antigo
Pensar Portugal – A modernidade de um país antigo
 
Vista do Ethos Mundial - Um consenso mínimo entre os humanos.pdf
Vista do Ethos Mundial - Um consenso mínimo entre os humanos.pdfVista do Ethos Mundial - Um consenso mínimo entre os humanos.pdf
Vista do Ethos Mundial - Um consenso mínimo entre os humanos.pdf
 
Bulletin of the Atomic Scientisits 2024-Doomsday-Clock-Statement
Bulletin of the Atomic Scientisits 2024-Doomsday-Clock-StatementBulletin of the Atomic Scientisits 2024-Doomsday-Clock-Statement
Bulletin of the Atomic Scientisits 2024-Doomsday-Clock-Statement
 
The Man in The High Castle Philip K. Dick
The Man in The High Castle Philip K. DickThe Man in The High Castle Philip K. Dick
The Man in The High Castle Philip K. Dick
 
o homem do castelo alto - philip k. dick
o homem do castelo alto - philip k. dicko homem do castelo alto - philip k. dick
o homem do castelo alto - philip k. dick
 
Falsas catástrofes invisíveis e ameaças de destruição
Falsas catástrofes invisíveis e ameaças de destruiçãoFalsas catástrofes invisíveis e ameaças de destruição
Falsas catástrofes invisíveis e ameaças de destruição
 
Cronologia das organizações de direita (1973-1976)
Cronologia das organizações de direita (1973-1976)Cronologia das organizações de direita (1973-1976)
Cronologia das organizações de direita (1973-1976)
 
Introdução ao pensamento feminista negro
Introdução ao pensamento feminista negroIntrodução ao pensamento feminista negro
Introdução ao pensamento feminista negro
 
Queer Palestine and the Empire of Critique
Queer Palestine and the Empire of CritiqueQueer Palestine and the Empire of Critique
Queer Palestine and the Empire of Critique
 
Livro - Modernidade liquida por Zygmunt Bauman
Livro - Modernidade liquida por Zygmunt BaumanLivro - Modernidade liquida por Zygmunt Bauman
Livro - Modernidade liquida por Zygmunt Bauman
 
Um Manifesto Anarquista - Louisa Sarah Bevington
Um Manifesto Anarquista - Louisa Sarah BevingtonUm Manifesto Anarquista - Louisa Sarah Bevington
Um Manifesto Anarquista - Louisa Sarah Bevington
 
Inquérito aos Hábitos de Leitura dos Estudantes do 1.º Ciclo do Ensino Superi...
Inquérito aos Hábitos de Leitura dos Estudantes do 1.º Ciclo do Ensino Superi...Inquérito aos Hábitos de Leitura dos Estudantes do 1.º Ciclo do Ensino Superi...
Inquérito aos Hábitos de Leitura dos Estudantes do 1.º Ciclo do Ensino Superi...
 
Tese Doutoramento sobre a "cunha" em Portugal - João Ribeiro
Tese  Doutoramento sobre a "cunha" em Portugal - João RibeiroTese  Doutoramento sobre a "cunha" em Portugal - João Ribeiro
Tese Doutoramento sobre a "cunha" em Portugal - João Ribeiro
 

Último

08448380779 Call Girls In Greater Kailash - I Women Seeking Men
08448380779 Call Girls In Greater Kailash - I Women Seeking Men08448380779 Call Girls In Greater Kailash - I Women Seeking Men
08448380779 Call Girls In Greater Kailash - I Women Seeking MenDelhi Call girls
 
FULL ENJOY 🔝 8264348440 🔝 Call Girls in Diplomatic Enclave | Delhi
FULL ENJOY 🔝 8264348440 🔝 Call Girls in Diplomatic Enclave | DelhiFULL ENJOY 🔝 8264348440 🔝 Call Girls in Diplomatic Enclave | Delhi
FULL ENJOY 🔝 8264348440 🔝 Call Girls in Diplomatic Enclave | Delhisoniya singh
 
Beyond Boundaries: Leveraging No-Code Solutions for Industry Innovation
Beyond Boundaries: Leveraging No-Code Solutions for Industry InnovationBeyond Boundaries: Leveraging No-Code Solutions for Industry Innovation
Beyond Boundaries: Leveraging No-Code Solutions for Industry InnovationSafe Software
 
How to Remove Document Management Hurdles with X-Docs?
How to Remove Document Management Hurdles with X-Docs?How to Remove Document Management Hurdles with X-Docs?
How to Remove Document Management Hurdles with X-Docs?XfilesPro
 
Pigging Solutions Piggable Sweeping Elbows
Pigging Solutions Piggable Sweeping ElbowsPigging Solutions Piggable Sweeping Elbows
Pigging Solutions Piggable Sweeping ElbowsPigging Solutions
 
The 7 Things I Know About Cyber Security After 25 Years | April 2024
The 7 Things I Know About Cyber Security After 25 Years | April 2024The 7 Things I Know About Cyber Security After 25 Years | April 2024
The 7 Things I Know About Cyber Security After 25 Years | April 2024Rafal Los
 
Slack Application Development 101 Slides
Slack Application Development 101 SlidesSlack Application Development 101 Slides
Slack Application Development 101 Slidespraypatel2
 
Key Features Of Token Development (1).pptx
Key  Features Of Token  Development (1).pptxKey  Features Of Token  Development (1).pptx
Key Features Of Token Development (1).pptxLBM Solutions
 
Neo4j - How KGs are shaping the future of Generative AI at AWS Summit London ...
Neo4j - How KGs are shaping the future of Generative AI at AWS Summit London ...Neo4j - How KGs are shaping the future of Generative AI at AWS Summit London ...
Neo4j - How KGs are shaping the future of Generative AI at AWS Summit London ...Neo4j
 
Tech-Forward - Achieving Business Readiness For Copilot in Microsoft 365
Tech-Forward - Achieving Business Readiness For Copilot in Microsoft 365Tech-Forward - Achieving Business Readiness For Copilot in Microsoft 365
Tech-Forward - Achieving Business Readiness For Copilot in Microsoft 3652toLead Limited
 
Kotlin Multiplatform & Compose Multiplatform - Starter kit for pragmatics
Kotlin Multiplatform & Compose Multiplatform - Starter kit for pragmaticsKotlin Multiplatform & Compose Multiplatform - Starter kit for pragmatics
Kotlin Multiplatform & Compose Multiplatform - Starter kit for pragmaticscarlostorres15106
 
Swan(sea) Song – personal research during my six years at Swansea ... and bey...
Swan(sea) Song – personal research during my six years at Swansea ... and bey...Swan(sea) Song – personal research during my six years at Swansea ... and bey...
Swan(sea) Song – personal research during my six years at Swansea ... and bey...Alan Dix
 
A Domino Admins Adventures (Engage 2024)
A Domino Admins Adventures (Engage 2024)A Domino Admins Adventures (Engage 2024)
A Domino Admins Adventures (Engage 2024)Gabriella Davis
 
Injustice - Developers Among Us (SciFiDevCon 2024)
Injustice - Developers Among Us (SciFiDevCon 2024)Injustice - Developers Among Us (SciFiDevCon 2024)
Injustice - Developers Among Us (SciFiDevCon 2024)Allon Mureinik
 
Unblocking The Main Thread Solving ANRs and Frozen Frames
Unblocking The Main Thread Solving ANRs and Frozen FramesUnblocking The Main Thread Solving ANRs and Frozen Frames
Unblocking The Main Thread Solving ANRs and Frozen FramesSinan KOZAK
 
08448380779 Call Girls In Diplomatic Enclave Women Seeking Men
08448380779 Call Girls In Diplomatic Enclave Women Seeking Men08448380779 Call Girls In Diplomatic Enclave Women Seeking Men
08448380779 Call Girls In Diplomatic Enclave Women Seeking MenDelhi Call girls
 
08448380779 Call Girls In Friends Colony Women Seeking Men
08448380779 Call Girls In Friends Colony Women Seeking Men08448380779 Call Girls In Friends Colony Women Seeking Men
08448380779 Call Girls In Friends Colony Women Seeking MenDelhi Call girls
 
Breaking the Kubernetes Kill Chain: Host Path Mount
Breaking the Kubernetes Kill Chain: Host Path MountBreaking the Kubernetes Kill Chain: Host Path Mount
Breaking the Kubernetes Kill Chain: Host Path MountPuma Security, LLC
 
Enhancing Worker Digital Experience: A Hands-on Workshop for Partners
Enhancing Worker Digital Experience: A Hands-on Workshop for PartnersEnhancing Worker Digital Experience: A Hands-on Workshop for Partners
Enhancing Worker Digital Experience: A Hands-on Workshop for PartnersThousandEyes
 
Install Stable Diffusion in windows machine
Install Stable Diffusion in windows machineInstall Stable Diffusion in windows machine
Install Stable Diffusion in windows machinePadma Pradeep
 

Último (20)

08448380779 Call Girls In Greater Kailash - I Women Seeking Men
08448380779 Call Girls In Greater Kailash - I Women Seeking Men08448380779 Call Girls In Greater Kailash - I Women Seeking Men
08448380779 Call Girls In Greater Kailash - I Women Seeking Men
 
FULL ENJOY 🔝 8264348440 🔝 Call Girls in Diplomatic Enclave | Delhi
FULL ENJOY 🔝 8264348440 🔝 Call Girls in Diplomatic Enclave | DelhiFULL ENJOY 🔝 8264348440 🔝 Call Girls in Diplomatic Enclave | Delhi
FULL ENJOY 🔝 8264348440 🔝 Call Girls in Diplomatic Enclave | Delhi
 
Beyond Boundaries: Leveraging No-Code Solutions for Industry Innovation
Beyond Boundaries: Leveraging No-Code Solutions for Industry InnovationBeyond Boundaries: Leveraging No-Code Solutions for Industry Innovation
Beyond Boundaries: Leveraging No-Code Solutions for Industry Innovation
 
How to Remove Document Management Hurdles with X-Docs?
How to Remove Document Management Hurdles with X-Docs?How to Remove Document Management Hurdles with X-Docs?
How to Remove Document Management Hurdles with X-Docs?
 
Pigging Solutions Piggable Sweeping Elbows
Pigging Solutions Piggable Sweeping ElbowsPigging Solutions Piggable Sweeping Elbows
Pigging Solutions Piggable Sweeping Elbows
 
The 7 Things I Know About Cyber Security After 25 Years | April 2024
The 7 Things I Know About Cyber Security After 25 Years | April 2024The 7 Things I Know About Cyber Security After 25 Years | April 2024
The 7 Things I Know About Cyber Security After 25 Years | April 2024
 
Slack Application Development 101 Slides
Slack Application Development 101 SlidesSlack Application Development 101 Slides
Slack Application Development 101 Slides
 
Key Features Of Token Development (1).pptx
Key  Features Of Token  Development (1).pptxKey  Features Of Token  Development (1).pptx
Key Features Of Token Development (1).pptx
 
Neo4j - How KGs are shaping the future of Generative AI at AWS Summit London ...
Neo4j - How KGs are shaping the future of Generative AI at AWS Summit London ...Neo4j - How KGs are shaping the future of Generative AI at AWS Summit London ...
Neo4j - How KGs are shaping the future of Generative AI at AWS Summit London ...
 
Tech-Forward - Achieving Business Readiness For Copilot in Microsoft 365
Tech-Forward - Achieving Business Readiness For Copilot in Microsoft 365Tech-Forward - Achieving Business Readiness For Copilot in Microsoft 365
Tech-Forward - Achieving Business Readiness For Copilot in Microsoft 365
 
Kotlin Multiplatform & Compose Multiplatform - Starter kit for pragmatics
Kotlin Multiplatform & Compose Multiplatform - Starter kit for pragmaticsKotlin Multiplatform & Compose Multiplatform - Starter kit for pragmatics
Kotlin Multiplatform & Compose Multiplatform - Starter kit for pragmatics
 
Swan(sea) Song – personal research during my six years at Swansea ... and bey...
Swan(sea) Song – personal research during my six years at Swansea ... and bey...Swan(sea) Song – personal research during my six years at Swansea ... and bey...
Swan(sea) Song – personal research during my six years at Swansea ... and bey...
 
A Domino Admins Adventures (Engage 2024)
A Domino Admins Adventures (Engage 2024)A Domino Admins Adventures (Engage 2024)
A Domino Admins Adventures (Engage 2024)
 
Injustice - Developers Among Us (SciFiDevCon 2024)
Injustice - Developers Among Us (SciFiDevCon 2024)Injustice - Developers Among Us (SciFiDevCon 2024)
Injustice - Developers Among Us (SciFiDevCon 2024)
 
Unblocking The Main Thread Solving ANRs and Frozen Frames
Unblocking The Main Thread Solving ANRs and Frozen FramesUnblocking The Main Thread Solving ANRs and Frozen Frames
Unblocking The Main Thread Solving ANRs and Frozen Frames
 
08448380779 Call Girls In Diplomatic Enclave Women Seeking Men
08448380779 Call Girls In Diplomatic Enclave Women Seeking Men08448380779 Call Girls In Diplomatic Enclave Women Seeking Men
08448380779 Call Girls In Diplomatic Enclave Women Seeking Men
 
08448380779 Call Girls In Friends Colony Women Seeking Men
08448380779 Call Girls In Friends Colony Women Seeking Men08448380779 Call Girls In Friends Colony Women Seeking Men
08448380779 Call Girls In Friends Colony Women Seeking Men
 
Breaking the Kubernetes Kill Chain: Host Path Mount
Breaking the Kubernetes Kill Chain: Host Path MountBreaking the Kubernetes Kill Chain: Host Path Mount
Breaking the Kubernetes Kill Chain: Host Path Mount
 
Enhancing Worker Digital Experience: A Hands-on Workshop for Partners
Enhancing Worker Digital Experience: A Hands-on Workshop for PartnersEnhancing Worker Digital Experience: A Hands-on Workshop for Partners
Enhancing Worker Digital Experience: A Hands-on Workshop for Partners
 
Install Stable Diffusion in windows machine
Install Stable Diffusion in windows machineInstall Stable Diffusion in windows machine
Install Stable Diffusion in windows machine
 

Atlas chapter2 screen

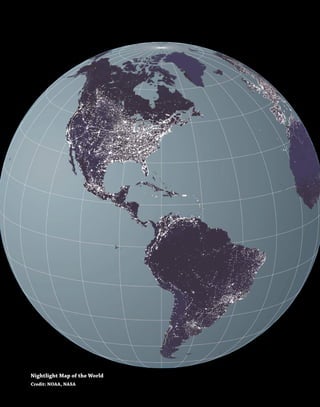
  • 1. 10 Nightlight Map of the World Credit: NOAA, NASA
  • 2. 11
  • 4. 13 2H umans are a prolific and op- portunistic species, among the most successful of all the Earth’s inhabitants. As the size of the human population has increased, people have spread across the globe into every imaginable habitat. Throughout human history, people have demonstrated an uncanny ability to adapt to and survive in some very harsh places, including, most recently, outer space and the ocean—at least for short periods of time. As human culture has evolved, people have developed new ways of living in and using their environment, and of helping themselves to all that the Earth has to offer. Their ability to exploit the Earth’s seemingly endless resources has been a vi- tal key to the success of the human species. However, many major advances in human culture—from the cultivation of crops and the development of cities to modern technologies—have tended to insulate people from the very environment that shaped them and upon which they depend. As a group, people have often forgotten that for every action taken there is a reaction, an impact. The impacts of human activities on the Earth often have both negative and positive components. For example, when people convert forests or grasslands to cropland they improve the means by which to feed their ever-growing numbers. At the same time, they invariably reduce biological diversity in the converted areas. Over time, people have rarely been fully aware of the tremendous change they have wrought on the Earth or that their success- es have often been achieved at the expense of other species and the environment. Since the early 1970s, many excellent texts have been written about the plight of the world (Heywood 1995; Middleton 1997; WRI 2000; Chew 2001; FAO 2001; Harrison and Pearce 2001; IPCC 2001; McNeill 2001; UNEP 2002a). This atlas supplements these works by providing illustrations of both positive and negative human-caused changes that have taken place on the Earth. Satellite images, to- gether with photographs, provide a unique view of how people are impacting the ter- restrial environment and what the conse- quences of environmental change mean in terms of human well-being. The images and the changes they illustrate are diverse. But they are united by a common message: environmental change does matter. The International Conference on Population and Development Programme of Action noted that stabilization of world People and Planet Human Influences on the Planet Credit: Topfoto Credit: Ed Simpson
  • 5. 14 population is crucial to achieving sustain- able development. Population stabiliza- tion is also necessary for managing human impacts on the Earth’s environment and resources. In 1999, the Earth’s human population reached 6 000 million, having grown during the mid-1990s at a rate of 13 per cent per year, with an average annual addition of 78 million individuals. As of 1999, countries with populations of 100 million or more included China, India, the United States, Indonesia, Brazil, Pakistan, the Russian Federation, Bangladesh, Japan, and Nigeria. According to the medium variant of the United Nations’ population estimates and projections, world popula- tion will reach 7 200 million by the year 2015. Ninety-eight per cent of the popu- lation increase will take place in less-de- veloped regions of the world. Africa will experience, by far, the most rapid rate of growth (Population Division 2000). The overall impact that humans have on the global environment is proportional to the number of people on the Earth and the average influence of each individual. If that overall impact is to be reduced, ad- dressing both of these factors is essential. Change in distribution of world population 1900 and 2000. Source: http://www.newint.org/issue309/Images/population.gif Case Study: Parrot’s Beak Between Sierra Leone and Liberia, there is a small strip of land belonging to Guinea known as the “Parrot’s Beak.” As civil wars raged in Sierra Leone and Liberia, hundreds of thousands of refugees have fled to relative safety in Guinea, many of them settling in the Parrot’s Beak. The United Nations High Commissioner for Refugees (UNHCR) estimates that the refugee population constitutes up to 80 per cent of the local population there (UNEP 2000). The 1974 image of the Parrot’s Beak in Guinea (left) shows the sur- rounding territory of Liberia and Sierra Leone. Scattered throughout the deep green forest of the Parrot’s Beak region are small flecks of light green, where compounds of villages with surrounding agricultural plots are located. Several dark spots in the upper left of the image are most likely burn scars. The 2002 image (facing page) shows the Parrot’s Beak region clearly defined by its light green color surrounded by darker green forest. The light green Credit: UNEP/GRID–Geneva Deforestation of indigenous palm trees in the refugee camp has left barren hillsides. Population Change Europe (including Russia) 25% Asia 60% US 5% Africa 4.5% Latin America 3% Others 2.5% Asia Pacific (including former Soviet Asia) 54% Africa 10% Latin America & Caribbean 8% Middle East & North Africa 6% North America 5% Others 3% Europe (including Russia) 14%
  • 6. 15 A biome is a major ecological community of plants and animals with similar life forms and environmen- tal conditions. Some of the Earth’s major terrestrial biomes include forests, grasslands, deserts, rain forests, and tundra. Different biomes are the source of different kinds of resources and processes (col- lectively called ecosystem services) such as water, soil, oil, natural gas and other fuels, minerals and other raw materials, wildlife habitat, erosion control, nutrient cycling, water filtration, food production, and genetic resources. The estimated global value of the Earth’s biomes for ecosystem services alone ranges from US $16 trillion to US $54 trillion a year (Costanza et al. 1997). color is the result of deforestation in the “safe area” where refugees have set up camp. Many of the refugees integrated into local villages, created their own family plots, and expanded the zones of converted forest area until they all merged into the larger defined area. In the upper part of the 2002 im- age the forest devastation is especially obvious, as areas that were green in the 1974 image now appear gray. Logging interests also moved into the higher elevations of this region, expanding the deforested zone visible in the upper left corner of the image. Overall impoverishment of the environment of the Parrot’s Beak is directly related to the rapidly increas- ing population in the area, mainly due to immigration, and a growth rate of about three per cent among the indig- enous population. Natural resources are being exploited to create more ar- able land for crops, wood for charcoal, firewood and construction materials, and commercial logging for revenue. Source: UNEP 2000. Credit: UNEP/GRID–Geneva Deforestation is evident on the hills sur- rounding the refugee camp. Tropical and Subtropical Grasslands, Savannas, and Shrublands Temperate Grasslands, Savannas, and Shrublands Boreal Forests / Taiga Temperate Conifer Forests Temperate Broadleaf and Mixed Forests Tropical and Subtropical Coniferous Forests Deserts and Xeric Shrublands Mangroves Bare Rock / Ice Mediterranean Forests, Woodlands, and Scrub Tundra Montane Grasslands and Shrublands Flooded Grasslands and Savannas Tropical and Subtropical Dry Broadleaf Forests Tropical and Subtropical Moist Broadleaf Forests Biomes Source: World Wildlife Fund Terrestrial Ecoregions Dataset. World Biomes
  • 7. 16 A simple definition of world population is the num- ber of people alive on the Earth at any given point in time. World population reached 6 400 million in 2004 and it continues to grow by some 80 million each year (Table 2.1). Since the 1950s, China has been the world’s most populous country (Table 2.2). China’s population is currently greater than that of some entire world regions (Global Population Profile 2002). By 2050, world population is estimated to reach 7 900 to 10 900 million, when stabilization of the Earth’s popula- tion is likely to take place. Whether or not world popu- lation falls within that range by this middle of this cen- tury—rather than exceeding it—will depend upon many of the choices and commitments that people make in the coming years (UNFPA 2001). The size of any population changes as a result of fluc- tuations in three fundamental factors: birth rate, death rate, and immigration or emigration. When any or all of these factors deviate from zero, the size of the population will change (Global Population Profile 2002). The primary driving force of population change, whether in an individual country or for the entire world, is change in birth and death rates. World population is growing more slowly than was expected (Figure 2.1) as a result of aid, family planning programs, and educa- tional and economic programs directed at women. People are also healthier and living longer than they did in the past; average life expectancy has increased while crude birth rate and death rate are following a downward trend (Tables 2.3, 2.4, 2.5 and 2.6). Most future population growth is likely to be in countries that have relatively large num- bers of young people and where large families are still the norm. Furthermore, declining mortality and increased longevity have resulted in, and will continue to lead to, the expansion of older populations. Worldwide, 2.1 World Population Table 2.1 – World population for given points in time Source: ESA 2003 Year Population 1970 3 692 492 000 1975 4 068 109 000 1980 4 434 682 000 1985 4 830 979 000 1990 5 263 593 000 1995 5 674 380 000 2000 6 070 581 000 2005 6 453 628 000 2010 6 830 283 000 Source: Global Population Profile 2002 1804 1922 1959 1974 1987 1999 2013 2028 2048 1800 1850 1900 1950 2000 2050 0 1 2 3 4 5 6 7 8 9 10 Population in billions Total world population 118 years 37 years 15 years 13 years 12 years 14 years 15 years 20 years Source: United Nations (1995b); U.S. Census Bureau, International Programs Center, International Data Base and unpublished tables. Figure 2.1: Time to successive billions in world population: 1800-2050. Credit: Topfoto
  • 8. 17 the average life expectancy in 1950 was 46 years; in 2050, it is projected to be 76 years (Hunter 2001). While an increase in life expectancy is a positive de- velopment, it presents a new set of challenges. In Europe, for example, where women give birth to an average of 1.4 children, governments are concerned that there will be too few workers in future years to support the growing number of retirees in the population. An aging popula- tion strains a nation’s social security system and pension plans, and puts pressure on health budgets because of higher health care costs for the elderly. Some govern- ments are also concerned that a shortage of working-age individuals may lead to increased immigration, and that a decline in population may signal a weakening of a coun- try’s political and economic clout (Ashford 2004). One of the main reasons that world population has grown so rapidly over the last 200 years is that mortal- ity rates have declined faster than fertility rates. Improved sanitation, health care, medicine, shelter, and nutrition have all led to dramatic increases in life expectancy. Fertility rates, on the other hand, declined more recently than mortality rates did (UNEP 1999). There is a striking paradox in global population trends: for more than two de- cades, many developing countries have ex- perienced a rapid decline in fertility while fertility rates in most highly developed na- tions have remained very low (Figures 2.3 and 2.4). Yet in the coming years, a massive increase of the world population is almost certain (Heilig 1996). The Demographic Transition Model (Figure 2.2) shows how a country’s popula- tion can change as the country develops. However, this model does not take into account migration. Worldwide, migration of people out of rural areas is accelerating, making internal and international Table 2.3 – Median age for given points in time Source: ESA 2003. Year Median age 1970 21.7 1975 22.0 1980 22.7 1985 23.4 1990 24.3 1995 25.3 2000 26.4 2005 27.4 2010 28.4 Table 2.5 – Crude birth rate per 1 000 population - Medium variant Source: ESA 2003. Period Crude birth rate 1970-1975 30.9 1975-1980 28.1 1980-1985 27.4 1985-1990 26.8 1990-1995 24.5 1995-2000 22.7 2000-2005 21.3 2005-2010 20.4 Table 2.6 – Crude death rate per 1 000 population - Medium variant Source: ESA 2003. Period Crude death rate 1970-1975 11.6 1975-1980 10.9 1980-1985 10.3 1985-1990 9.7 1990-1995 9.5 1995-2000 9.2 2000-2005 9.1 2005-2010 9.0 Table 2.4 – Average life expectancy at birth - Medium variant Source: ESA 2003. Period Both sexes Male Female combined 1970-1975 58.0 56.5 59.5 1975-1980 59.8 58.1 61.5 1980-1985 61.3 59.4 63.2 1985-1990 62.9 60.9 64.8 1990-1995 63.8 61.7 65.9 1995-2000 64.6 62.5 66.9 2000-2005 65.4 63.3 67.6 2005-2010 66.3 64.2 68.4 Table 2.2 – The Top Ten Most Populous Countries: 1950, 2002, 2050 1950 2002 2050 1. China 1. China 1. India 2. India 2. India 2. China 3. United States 3. United States 3. United States 4. Russia 4. Indonesia 4. Indonesia 5. Japan 5. Brazil 5. Nigeria 6. Indonesia 6. Pakistan 6. Bangladesh 7. Germany 7. Russia 7. Pakistan 8. Brazil 8. Bangladesh 8. Brazil 9. United Kingdom 9. Nigeria 9. Congo (Kinshasa) 10. Italy 10. Japan 10. Mexico Source: U.S. Census Bureau, International Programs Center, International Data Base are unpublished tables. Credit: Ed Simpson
  • 9. 18 migration potentially one of the most important development and policy issues of this century. The migration of labor geographically, out of rural areas, and occupationally, out of farm jobs, is one of the most pervasive features of agricultural transformations and economic growth. Yet in a world of complete and well-function- ing markets, there is little or no economic rationale for policies to reduce migration; the movement of labor out of agriculture is both a quintessential feature of agricultural transformations and a prerequisite for efficient and balanced economic growth (Taylor and Martin 2002). Clearly, human numbers cannot contin- ue to increase indefinitely. Unfortunately, the more people there are and the longer they live, the more competition there will be for the Earth’s limited resources. Many countries in the developing world are ap- proaching levels of resource consumption Figure 2.2: The Demographic Transition Model shows how population growth occurs naturally in four stages. Stage 1: Birth rate and death rate are high, limiting both the rate of increase and total population. Stage 2: Birth rate remains relatively high but death rate begins to fall, causing the population to grow rapidly. Stage 3: Declining birth rate and low death rate maintain continued population growth. Stage 4: Both birth rate and death rate are low, slowing population growth, but leaving a large total population. Source: http://www.geography.learnontheinternet.co.uk/topics/growth 6.7 5.1 5.1 2.6 5.0 2.6 2.0 2.0 2.2 1.4 1970 2004 Africa Asia Latin America & Caribbean North America Europe Figure 2.3: Childbearing trends in major world regions, 1970 and 2004 Total fertility rate (children per woman) Source: UN Population Division. World Population Prospects: The 2002 Revision (1970 data), and C. Haub, 2004 World Population Data Sheet (2004 data). Figure 2.4: Different patterns of fertility decline, 1970-2000 0 1 2 3 4 5 6 7 1970 1975 1980 1985 1990 1995 2000 BangladeshIndia Argentina Thailand Children per woman Sources: Registrar General of India; Instituto Nacional de Estadística (Argen- tina); United Nations Population Division; Institute of Population and Social Research, Mahidol University, Thailand; Demographic and Health Surveys; and Population Reference Bureau estimates. Credit: Topfoto 5,000 and higher No data 10 - 49 1 - 9 50 - 99 100 - 199 200 - 499 500 - 999 1,000 - 1,999 2,000 - 4,999 5,000 and higher No data 10 - 491 - 9 50 - 99 100 - 199 200 - 499 500 - 999 1,000 - 1,999 2,000 - 4,999 Population Density persons per square km Population Density persons per square km Source: Gridded Population of the World (GPW), Version 3.0 (v3) beta, 2000, published by Columbia University Center for International Earth Science Information network (CIESIN). Source: Gridded Population of the World (GPW), Version 3.0 (v3) beta, 2000, published by Columbia University Center for International Earth Science Information network (CIESIN). Population Density Map Source: http://beta.sedac.ciesin.columbia.edu/
  • 10. 19 and waste generation that rival those of de- veloped countries. Unless all nations adopt more sustainable methods of production and consumption, the planet’s carrying capacity will be exceeded (UNEP 1999). Natural resources are already severely limited, and there is emerging evidence that natural forces are already starting to control human population numbers through malnutrition and disease (Pimen- tel et al. 1999). The environmental challenges that peo- ple now face and most likely will continue to face in the future would be less difficult if world population were growing very slowly or not at all. The number of people on the Earth and the rate at which that number increases (Table 2.7) dramatically impact the availability of water, soil, ar- able land, minerals, fuels, and many other natural resources worldwide. Access to and Case Study: Monitoring Rapid Urban Expansion of Tehran, Iran 1975 and 2000 Tehran is located at the foot of the Alborz Mountains. The city occupies the northern part of the alluvial Tehran Plain, sloping from the mountains to the flat Great Salt Desert. The ur- ban area is bounded by mountains to the north and east making it difficult to differentiate the urban area from the mountainous and desert area that surrounds Tehran. The population of Tehran has grown three- fold since 1970 when the population was three million. In 1987, the city had grown to more than seven million people and covered an area of 575 km2 (230 square miles). Today the city has nine million residents. The rapid expansion of Tehran, as well as its sharp population growth in recent decades, has had many adverse impacts on the environment. Air and water pollution are major problems in the city. Urban areas are replacing farms and water resources. A major concern is its location on a recognized zone of active faulting with a modest to high seismic risk. Recent planning and construction techniques are designed to improve the resistance to a major earthquake that could threaten the city. 19 Credit: Saman Salari Sharif, UNEP-GRID Geneva The map portrays the boundaries of urban areas with defined populations of 5 000 persons or more. Source: Modified from http://beta.sedac.ciesin.columbia.edu/gpw/global.jsp Global Urban Extent Map
  • 11. 20 use of family planning services can help lower fertility rates and delay child-bearing years, thereby helping to slow population growth. Comprehensive population policies are an essential element in a world devel- opment strategy that combines access to reproductive health services, education and economic opportunities, improved energy and natural resource technologies, and more reasonable models of consumption and what constitutes “the good life.” Such a strategy has the potential to bring humanity into an enduring balance with the envi- ronment and the natural resources upon which people will always depend (Popula- tion Fact Sheet 2000). In addition to the overall global increas- es in population, the geographic distri- bution of human population underwent massive changes during the 20th century (Figure 2.5). For example, between 1900 and 1990, the population of northern South America increased by 214 million, or 681 per cent, compared to the global aver- age population increase of 3 700 million, or 236 per cent (Ramankutty and Olejniczak 2002). Population growth around Lake Victoria, Kenya, is significantly higher than in the rest of Africa because of the wealth of natural resources and economic benefits the lake re- gion offers. Note the increase in population in a 100-km (62 miles) buffer zone around Lake Victoria between 1960 and 2000. Dur- ing each decade, population growth within this zone outpaced the continental average. Source: UNEP/GRID- Sioux Falls Lake Victoria, Kenya 0 – 0.5 0.5 – 10 10 – 100 100 – 250 250 – 500 500 – 1000 greater than 1000 Population density (people per sq km) Table 2.7 – World Vital Events Per Time Unit: 2004 (Figures may not add to totals due to rounding) Natural Population Time unit Births Death Increase Year 29 358 036 56 150 533 73 207 503 Month 10 779 836 4 679 211 6 100 625 Day 353 437 153 417 200 021 Hour 14 727 6 392 8 334 Minute 245 107 139 Second 4.1 1.8 2.3 Source: http://www.census.gov/cgi-bin/ipc/pcwe Figure 2.5: Population change in the 20th century Source: http://www.bioone.org/pdfserv/i0044-7447-031-03-0251.pdf Credit: Ed Simpson Water Low (<25) Medium (25–100) High (>100) Population Density (people/km2)
  • 12. 21 2.2 Culture Culture encompasses the customary beliefs, social forms, and material traits of a racial, religious, or social group. Culture includes the set of values and institutions that enables a society to develop and maintain its identity. Cultural signatures differ around the globe and often hold to very different ideals and ideas, such as the value of economics as an integrating system of values or the importance of technology and technological change as springboards for human progress. Different cultures also differ in their concepts of justice and fairness and their beliefs about the relationship between people and the natural and spiritual world (UNEP 2002a). Today, many of these differences are disappearing as cultures worldwide become increasingly homogeneous. Major steps in this direction occurred in the fifteenth century with European exploration and colonization and in the nineteenth century with the Industrial Revolution. More recently, the creation of the European Union in 1952 broke down many international barriers and con- currently reduced cultural diversity within Europe. Fol- lowing the collapse of the Eastern Bloc in 1989, capital- ism became more pervasive, less nationally limited, and more powerful worldwide. Globally, world-spanning communication networks and inexpensive air travel have reduced the costs of cross-cultural connections of all kinds, boosting televi- sion, tourism, and emigration to new levels. Global finan- cial integration has proceeded at a furious pace, along with the international flow of goods and services as coun- tries become increasingly dependent on each other for Credit: Bigfoto Source: Terralingua, UNESCO, and WWF 2003 The World’s Biocultural Diversity. People, Languages and Ecosystems
  • 13. 22 food and basic commodities (Wilk 2000). Explosive development of electronic me- dia, including the Internet, has intensified cultural homogenization by promoting the ideals of a handful of cultures over those of many others. Western clothing is replac- ing ethnic dress in many countries, while American pop music is crowding out tradi- tional folk music (Gary and Rubino 2001). In short, current globalization of trade and mass culture, together with unprec- edented demand for consumer goods, has significantly impacted indigenous cultures around the globe. In many parts of the world, English has become the dominant language, having displaced native tongues and dialects. Of the 6 800 or so “living” languages spoken in the world today, nearly half are likely to disappear in the foreseeable future (Wurm 1970; Gary and Rubino 2001). More than 350 languages already have fewer than 50 speakers (Table 2.8). Such rare lan- guages are more likely to decline or disap- pear than those that are more common (Sutherland 2003). Source: http://highered.mcgraw-hill.com/site/dl/free/007248179x/35299/map12.pdf Languages of the World Source: Modified from http://www.neiu.edu/~ejhowens/104/6/cultur.gif Legend Anglo American Austral European European Indic Insular Oceanic Latin America Islamic Sino Japanese Slavic Southeast Asia sub Saharan Africa WORLD CULTURAL REGIONS
  • 14. 23 The disappearance of any language represents an irrepa- rable loss for the heritage of all humankind (Wurm 1970). It has been likened to the extinction of species—an unfortunate cultural analog to the alarming events now being witnessed in the biological world. In fact, the number of “living” languages spoken on the Earth is dwindling faster than the planet’s biodiversity. The interrelationship between culture and the environ- ment is also reflected in the depletion of energy resources and forced adoption of new energy sources. In Europe, coal replaced relatively scarce wood as a fuel at the beginning of the Industrial Revolution. Oil and natural gas, in turn, began to replace coal during the early twentieth century. Nuclear, solar, and other energy sources are now replacing petroleum prod- ucts (O’Neil 2004). Table 2.8 – The most common languages in the world Approximate number Countries with of native speakers substantial numbers Language (in the year 2000) of native speakers 1. Mandarin Chinese 874 000 000 16 2. Hindi (India) 366 000 000 17 3. English 341 000 000 104 4. Spanish 322-358 000 000 43 5. Bengali 207 000 000 9 (India and Bangladesh) 6. Portuguese 176 000 000 33 7. Russian 167 000 000 30 8. Japanese 125 000 000 26 9. German (standard) 100 000 000 40 10. Korean 78 000 000 31 11. French 77 000 000 53 12. Wu Chinese 77 000 000 1 13. Javanese 75 000 000 4 14. Yue Chinese 71 000 000 20 15. Telegu (India) 69 000 000 7 Note: These statistics are only rough approximations in most cases. (Source: The World Almanac and Book of Facts, 2003) Credit: Bigfoto Source: http://highered.mcgraw-hill.com/site/dl/free/007248179x/35299/map11.pdf Religions of the World
  • 15. 24 Religion, an important aspect of culture, also has had an effect on the environment. The Western world’s attitudes toward nature were shaped largely by the Judeo- Christian tradition, which stressed the concept of a world created solely for the benefit of humans. According to this tradi- tion, “God planned all [of creation] explic- itly for man’s benefit and rule: no item in the physical creation had any purpose save to serve man’s purposes.” (White 1967). Christianity, and Western civilization as a whole, held a view of nature that separated humans from the rest of the natural world and encouraged exploitation of it for the sole benefit of the human species (Thorn- gren 2003). This cultural philosophy stood in stark contrast to many older, indigenous religious traditions, in which people were seen as part of nature and spirits inhabited animals, plants, and even non-living envi- ronmental components such as mountains and rivers. Much has been said about the expan- sion of Western culture to the detriment of others. It is clear that many individuals aspire to Western lifestyles, while others as- sociate Western cultural values with selfish individualism and excessive consumption. The spread of Western culture is both a cause and an effect of economic globaliza- tion, aided by the far-reaching penetration of information technologies and electronic media. At the same time, there have been nationalist and religious reactions against that culture, sometimes resulting in terror- ist activities and in open warfare within or between nations (UNEP 2002a). Homogenization of culture, whether Western-influenced or not, should improve peoples’ ability to communicate with one another and, in doing so, reduce conflicts. Conversely, variety in all aspects of life has been a source of wonder and celebration for countless centuries, and the loss of that variety is an unfortunate prospect (Gary and Rubino 2001). A natural wonder formed by natural processes, Rainbow Bridge (far left) straddles a tributary of the Colorado River in southern Utah in the United States. Two con- temporary bridges, one from Sydney, Australia (left), and the other from London, England (below left), echo the natural form of Rainbow Bridge, but are the obvious byproducts of modern culture. Credit: Ed Simpson Credit: Bigfoto Credit: BigfotoCredit: USGS
  • 16. 25 2.3 Land Use and Degradation Growing crops, clearing land, planting trees, draining a wetland— these and many other activities fall into the broad category of land use, or how people use land. Land-use intensity is the extent to which land is used. It is an indication of the amount and degree of development in an area, and a reflection of the effects generated by that development (Planning Department 2001). As a measure of activity, land-use intensity can range from very low (for example, a pristine wilderness area) to intermediate (a managed forest ecosystem) to very high (urban and industrial settings) (Lebel and Steffen 1998). From a global change perspec- tive (Figure 2.6), land-use intensity is an important characteristic in assessing change and its impact (Berka et al. 1995). Land-use intensity is determined by the spatial requirements of a land-use activity, relationship to open space, requirements for infrastruc- ture (transportation routes, water, sewer, electricity, and commu- nications), and environmental impact. Parameters for measuring land-use intensity typically include: • type of land-use activity, such as agriculture, grazing, wood production, or residential, commercial or industrial usage, • duration of use, • number of people, animals, plants, structures, or machines that occupy the land during a given period, and • amount of land involved. Figure 2.6: This series of illustrations depicts global land-use change, particularly the expansion of cropland and grazing land, between 1700 and 1990. Credit: Klein Goldewijk, K., 2001. Source: NASA 2002, http://www.gsfc.nasa.gov/topstory/20020926landcover. html Credit: Topfoto tropical evergreen/deciduous forest savana grassland and steppe open shrub land temperate deciduous forest temperate needle-leaf evergreen forest intensive agriculture marginal cropland used for grazing desert
  • 17. 26 Also important in assessing land-use intensity is to examine the relative imper- viousness of the landscape. Impervious surfaces, such as paved roads, inhibit or entirely block the absorption of water by underlying soil (Forney et al. 2001). Once paved or otherwise made impervious, land is not easily reclaimed. As environmentalist Rupert Cutler noted (Brown 2001), “Asphalt is the land’s last crop.” Land-use intensity trends are usually expressed through changes in inputs, management, or number of harvests over a given period of time. Only changes within the same land-use category and on the same area (change of intensity)—as op- posed to changes from one type of land use to another (for example, forest to cropland)—are taken into account when assessing trends (van Lynden et al. n.d.; FAO 2002). The Agro-Ecological Zones (AEZ) methodology (Figure 2.7) is a system devel- oped by the Food and Agriculture Organi- zation of the United Nations (FAO) with the collaboration of the International Insti- tute for Applied Systems Analysis (IIASA), that enables rational land use planning on the basis of an inventory of land resources and evaluation of biophysical limitations and potentials. This methodology utilizes a land resources inventory to assess, for specified management conditions and levels of inputs, all feasible agricultural land-use options and to quantify expected production of cropping activities relevant Figure 2.8: A satellite image reveals a typical “feather” or “fish- bone” pattern of deforestation in Brazil. The pattern follows the construction of a new road through the rain forest. Roads provide easy access for mechanicized logging to clear cut for- est sections. Clear cut sections can then be turned into agricul- tural fields as roads provide easy access to local markets. Source: UNEP/GRID–Sioux Falls B R A Z I L R o n d ô n i a Ariquemmes São Joao Joao Filipe Rio Branco São Cruz Uru-Eu-Wau-Wau Indigenous Area Pacaás Novos National Park Karitiana Indigenous Area RioCandeias RioJamari B R A Z I L R o n d ô n i a 0 10 Kilometers B R A Z I L R o n d ô n i a Ariquemmes São Joao Rio Branco São Cruz ana nous a RioCandeias RioJamari B R A Z I L R o n d ô n i a Figure 2.7: Conceptual framework of the Agro-Ecological Zones methodology Source: FAO 2000, http://www.fao.org/ag/agl/agll/gaez/index.htm 19 Sep 2001
  • 18. 27 in the specific agro-ecological context. The characterization of land resources includes components of climate, soils and landform, which are basic for the supply of water, energy, nutrients and physical sup- port to plants (FAO 2000). Worldwide, the effect people are having on the Earth is substantial and growing. Satellite images reveal in startling detail the signs of human impact on the land- scape. From the herringbone patterns of deforestation etched into once-undis- turbed rain forests (Figure 2.8) to the patchwork patterns of agricultural fields and concrete splotches of urban sprawl, the evidence that people have become a powerful force capable of reshaping the Earth’s environment is everywhere. Scientists estimate that between one- third and one-half of the Earth’s land surface has been transformed by human activities (Figure 2.9) (Herring n.d.). The activity that has had the greatest impact on the global landscape is agriculture. Twelve per cent of the world’s land surface—an area equivalent to that of the South Ameri- can continent—is under permanent cultivation (Ramankutty and Foley 1999; Devitt 2001). Over the next 30 years, the annual rate of growth in global crop production is ex- pected to decrease. However, the Food and Agriculture Organization of the United Nations predicts that production will still exceed demand, despite the world’s grow- ing population. By 2030, 75 per cent of the projected global crop production will oc- cur in developing countries, compared to 50 per cent in the early 1960s. Increases in production will be achieved by improving plant yields and through more intensive land-use activities, including multi-crop- ping or high-cropping intensities (UCS 2004). In light of these projections, contin- ued support of agricultural research and policies in developing countries is vital. Nearly one-third of the world’s crop- land—1 500 million hectares—has been abandoned during the past 40 years because erosion has made it unproductive (Pimentel et al. 1995). Restoring soil lost by erosion is a slow process; it takes rough- ly 500 years for a mere 2.5 cm (1 inch) of soil to form under agricultural Source: http://www.isric.nl/ Global Soil Degradation Map Credit: Topfoto 27 Source: http://www.isric.nl/
  • 19. 28 conditions (Pimentel et al. 1996). Thus the approach to replacing eroded agricultural lands typically has been to clear more and more areas of grassland or forest and con- vert them to cropland. The ever-growing need for agricultural land accounts for 60 to 80 per cent of the world’s deforestation (Figure 2.9). Despite such “replacement” strategies, the amount of available cropland worldwide has declined to 0.27 hectare (0.67 acres) per person (Pimentel et al. 1996). It is possible to feed one adult on a plant diet grown on about 0.2 hectares (0.5 acres) of land (Knee 2003)—and this land-per-person minimum is roughly what will be available when world population reaches 8 000 million—but only if crop yields now being achieved in developed countries are achieved worldwide. To do so requires that most countries’ inputs of fertilizer, and probably pesticides, rise to match those of North America and Europe. Furthermore, any mechanization of crop production will entail additional energy consumption. Increased mechanization is likely given the mass migration from rural areas to cities currently underway on all continents. While agriculture accounts for only about two per cent of energy consumption in North America and Europe, it accounts for roughly ten per cent of energy consumption in the rest of the world (Knee 2003). The shortage of cropland, together with falling productivity, is a significant factor contributing to global food shortages and associated human malnutrition. Political unrest, economic insecurity, and unequal food distribution patterns also contribute to food shortages worldwide (Pimentel et al. 1996). In addition to agriculture, the global trend toward urbanization is another key factor bringing change to the landscape. Historically, forests and grasslands have been converted to cropland. Increasingly, cropland is being converted to urban areas (Ramankutty and Foley 1999; Devitt 2001). Millions of hectares of cropland in the industrial world have been paved to create roads and parking lots. The average car re- quires 0.07 hectares (0.17 acres) of paved land for roads and parking space (Brown 2001). If farmers worldwide fail to meet the challenge of increasing yields on existing cropland, or they cannot access the tools necessary to achieve increased yields, the only alternative will be to clear the world’s remaining forests and grasslands (Green 2001). Yet indications are that the world does not have enough forests to fulfill all the current and future demands being placed on them (Nilsson 1996). As natural forests are exhausted or come under protection, the demand for wood and wood products will be increas- ingly satisfied by tree farms. Between 1980 and 1995, forest plantations in developed countries increased from 45-60 million hectares (111-147 million acres)to 80-100 million hectares (198-247 million acres). Credit: Topfoto Figure 2.9: Human-induced land degradation (severe and very severe) as percentage of total land area Source: World Atlas of Desertification (UNEP 1992) 30 25 20 15 10 5 0 Area(millionsq.km) Total human induced land degradation Total land Sub- Saharan Africa North Africa and Near East North Asia, east of Urals Asia and Pacific South and Central America North America Europe
  • 20. 29 In the developing world, the area in forest plantations doubled from roughly 40 mil- lion to about 81 million hectares (99-200 million acres) over the same period. More than 80 per cent of forest plantations in the developing world are found in Asia, where demand for paper and other wood products continues to grow rapidly. For- est plantations now cover more than 187 million hectares (462 million acres) world- wide. That accounts for less than five per cent of the Earth’s total forested area, but 20 per cent of current global wood pro- duction (Larsen 2003). Land Degradation and Desertification By the beginning of the twenty-first cen- tury, unprecedented global environmental changes had reached sufficient propor- tions to impinge upon human health—si- multaneously and often interactively. These changes include the processes of land degradation and desertification (Menne and Berollini 2000). Land degradation is the decline in the potential of land resources to meet hu- man economic, social, and environmental functions needs (Africa Mountain Forum n.d.). Desertification is soil degradation in arid regions, often to such an extent that it is impossible to make the soil produc- tive again (Table 2.9). Desertification is the result of complex interactions between unpredictable climatic variations and unsustainable land use practices by com- munities who, in their struggle to survive, overexploit agricultural, forest, and water resources (CIDA 2001). Over 3 600 million hectares (8 896 mil- lion acres)—25 per cent of the Earth’s land area—are affected by land degradation. Desertification occurs to some extent on 30 per cent of irrigated lands, 47 per cent of rain-fed agricultural lands, and 73 per cent of rangelands (Figure 2.10). Annually, an estimated 1.5 to 2.5 million hectares (3.7 to 6 million acres) of irrigated land, 3.5 to 4.0 million hectares (8.6 to 9 mil- lion acres) of rain-fed agricultural land, and about 35 million hectares (86 million acres) of rangeland lose all or part of their productivity due to land degradation pro- cesses (Watson et al. 1998). Desertification and drought are prob- lems of global dimension that directly affect more than 900 million people in 100 countries, some of which are among the least developed nations in the world (Watson et al. 1998). The consequences of desertification include (UNEP 2002a): • reduction of the land’s natural resil- ience to recover from climatic distur- bances; • reduction of soil productivity; • damaged vegetation cover, such that edible plants are easily replaced by non-edible ones; • increased downstream flooding, re- duced water quality, sedimentation in rivers and lakes, and siltation of reser- voirs and navigation channels; • aggravated health problems due to wind-blown dust, including eye infec- tions, respiratory illnesses, allergies, and mental stress; • undermined food production; and • loss of livelihoods forcing affected people to migrate. Desertification results from misman- agement of land and thus deals with two interlocking, complex systems: the natural Credit: Topfoto Table 2.9 – Degree of soil degradation by subcontinental regions (per cent of total area) None Light Moderate Strong Extreme Africa 83 6 6 4 0.2 Asia 82 7 5 3 <0.1 Australiasia 88 11 0.5 0.2 <0.1 Europe 77 6 15 1 0.3 North America 93 1 5 1 0 South America 86 6 6 1 0 World: Per centage 85 6 7 2 <0.1 Area (‘000 km2 ) 110 483 7 490 9 106 2 956 92 Source: World Atlas of Desertification (UNEP 1992)
  • 21. 30 ecosystem and the human social system (Eswaran et al. 1998). While much desert- ification is attributed to poor land-use prac- tices, hotter and drier conditions brought about by potential global warming would extend the area prone to desertification northwards to encompass areas currently not at risk. In addition, the rate of deserti- fication would increase due to increases in erosion, salinization, fire hazard, and reductions in soil quality. As a result, the process of desertification is likely to be- come irreversible (Karas n.d.). Worldwide, an estimated 6 to 27 million hectares (15 to 67 million acres) of land are lost each year to desertification. Seven- ty per cent of the world’s dry land is de- graded enough to be vulnerable to deserti- fication (Anon 2002). The amount of land susceptible to desertification (areas known as tension zones) also is increasing. Cur- rently, 7.1 million km2 (2.7 million square miles) of land face low risk of human-in- duced desertification, 8.6 million km2 (3.4 million square miles) are at moderate risk, 15.6 million km2 (6.2 million square miles) are at high risk, and 11.9 million km2 (4.6 million square miles)are at very high risk. Tension zones result from: • excessive and continuous soil erosion resulting from overuse and improper use of lands, especially marginal and sloping lands; • nutrient depletion and/or soil acidi- fication due to inadequate replenish- ment of nutrients or soil pollution from excessive use of organic and inorganic agrichemicals; • reduced water-holding capacity of soils due to reduced soil volume and reduced organic matter content, both of which are a consequence of erosion and reduced infiltration due to crust- ing and compaction; • salinization and water-logging from over-irrigation without adequate drainage; and • unavailability of water stemming from decreased supply of aquifers and drainage bodies. The following negative effects are high- est in the tension zones (Eswaran et al. 1998): • systematic reduction in crop perfor- mance, leading to failure in rain-fed and irrigated systems; • reduction in land cover and biomass production in rangelands, with an accompanying reduction in quality of feed for livestock; • reduction of available woody plants for fuel and increased distances to harvest them; Credit: Topfoto Figure 2.10: Soils are classified according to the proportions of different sized particles they contain. As seen in this figure, the largest percentage of world land area unsuitable for agriculture is land that is too dry. Source: FAO 2000, http://www.fao.org/desertification/default.asp?lang=en
  • 22. 31 Case Study: Mt. Kenya–Diversity in Ecosystems Christian Lambrechts Mount Kenya is located on the equator 180 kilometres north of Nairobi. It is a soli- tary mountain of volcanic origin with the base diam- eter of about 120 km (75 miles). Its broad cone shape reaches an altitude of 5 199 m (17 057 ft) with deeply incised U-shaped valleys in the upper parts. Forest vegetation covers the major part of the mountain, with a total area around 220 000 hectares (548 574 acres). The forests are critical and invaluable national assets that must be protected. High diversity in ecosystems and species The wide range in altitude clines—from 1 200 to 3 400 m (3 900 to 11 000 ft)—and rainfall clines from—from 900 mm/year (35 in/year) in the north to 2 300 mm/year (91 in/year) in the south-eastern slopes—contributes to the highly diverse mosaic patterns of Mount Kenya forests. Mount Kenya adds value to the na- tion by providing tourism potential and local cultural and economic benefits. It also pro- vides important environmental services to the nation such as a water catchment area of the Tana River where 50 per cent of Kenya’s total electricity output is generated. Forest conservation initiative Following a 1999 aerial survey, the entire forest belt of Mount Kenya was gazetted as National Reserve and placed under the management of Kenya Wildlife Services in the year 2000. In 2002, a study was carried out to assess the effec- tiveness of the new management practices put in place in 2000. The study revealed significant improvement in the state of conservation of the forests. This sub-scene of an ASTER satellite image shows sand dunes covering an area roughly 12 km x 15 km (8 x 9 miles) in the Thar Desert of northwestern India and eastern Pakistan. The dunes here shift constantly, taking on new shapes. Approximately 800 km (497 miles) long and 490 km (305 miles) wide, the Thar Desert is bounded on the south by a salt marsh known as the Rann of Kutch, and on the west by the Indus River plain. The desert’s terrain is pri- marily rolling sand hills, with scattered outcroppings of shrub and rock. Source: NASA 2004, http://asterweb.jpl. nasa.gov/gallery/gallery.htm?name=Thar Forest is shown in true color (red) on these images. Note the changes in forest cover in the boxes. Source: UNEP/GRID–Nairobi • significant reduction in water from overland flows or aquifers and a con- comitant reduction in water quality; • encroachment of sand and crop dam- age by sand-blasting and wind erosion; and • increased gully and sheet erosion by torrential rain. Ultimately, desertification processes im- pact about 2 600 million people, or 44 per cent of the world’s population (Eswaran et al. 1998). 31 Credit: NASA/GSFC/METI/ERSDAC/JAROS, and U.S./Japan ASTER Science Team.
  • 23. 32 2.4 Ecoregions and Ecosystems An ecosystem is an organic community of plants and an- imals viewed within its physical environment (habitat); the ecosystem results from the interaction between soil and climate. It is a dynamic complex of plant, animal, and microorganism communities and their non-living environment interacting as a functional unit (UNEP- WCMC 2003). An ecoregion is a cartographical delineation of a relatively large unit of land or water containing a geo- graphically distinct assemblage of species, natural com- munities, and environmental conditions. An ecoregion is often defined by similarity of climate, landform, soil, surface form, potential natural vegetation, hydrology, and other ecologically relevant variables. Ecoregions contain multiple landscapes with different spatial pat- terns of ecosystems. The ecoregion concept is one of the most important in landscape ecology, both for management and un- derstanding (Hargrove and Hoffman 1999). Ecoregion classifications are based on particular environmental conditions and designed for specific purposes, and no single set of ecoregions would be appropriate for all potential uses (Wikipedia n.d.). The environment of an ecoregion in terms of climate, resource endowments, and socioeconomic Credit: Topfoto Tropical rainforest Tropical moist deciduous forest Tropical dry forest Tropical shrubland Tropical desert Tropical mountain Polar Water No Data Subtropical humid forest Subtropical dry forest Subtropical steppe Subtropical desert Subtropical mountain Temperate oceanic forest Temperate continental forest Temperate steppe/prairie Boreal coniferous forest Boreal tundra woodland Boreal mountain Temperate desert Temperate mountain SCALE 1:150,000,000 GLOBAL ECOLOGICAL ZONES Source: USGS National Center for EROS
  • 24. 33 conditions is homogeneous. Specific ad- vantages of using an ecoregion approach for planning and decision-making include: • easier identification of production capa- bilities and constraints; • better targeting of prospective technologies; • improved assessment of responses to new technologies; and • wider adoption and larger impact of research outputs (Saxena et al. 2001). Trends An increase in average global tempera- ture has the potential to bring about dramatic change in ecosystems. Some species may be forced out of their habitats (possibly to extinction) because of chang- ing conditions. Other species may flourish and spread. Few, if any, terrestrial ecore- gions on the Earth are expected to remain unaffected by significant global warming. Since 1970, there has been a 30 per cent decline in the world’s living things and the downward trend is continu- ing at one per cent or more per year (Col- lins 2000; UNEP 1997). Table 2.10 shows an increase in the number of endangered and vulnerable species between the years 2000–2003. Modification of landscapes, loss of native species, introduction of exotic species, monoculture-focused agri- culture, soil enhancement, irrigation, and land degradation have all tended to “sim- plify” ecosystems, leading to a reduction in biodiversity. In aquatic environments, eutrophication and habitat destruction have had a similar effect (Tilman et al. 2001). As ecosystems become simpler, so do ecoregions. Ecoregion and ecosystem fragmenta- tion also contributes to a decline in biodi- versity and threatens many species. Glob- ally, over half of the temperate broadleaf and mixed forests and nearly one quarter of the tropical rain forests have been frag- mented or removed (Wade et al. 2003). Table 2.10 – Loss of biodiversity from 2000 to 2003—expressed as changes in species numbers—in animals and plants classified as critically endangered, endangered, and vulnerable Critically Endangered Endangered Vulnerable Group 2000 2002 2003 2000 2002 2003 2000 2002 2003 Mammals 180 181 184 340 339 337 610 617 609 Birds 182 182 182 321 326 331 680 684 681 Reptiles 56 55 57 74 79 78 161 159 158 Amphibians 25 30 30 38 37 37 83 90 90 Fishes 156 157 162 144 143 144 452 442 444 Insects 45 46 46 118 118 118 392 393 389 Mollusks 222 222 250 237 236 243 479 481 474 Plants 1 014 1 046 1 276 1 266 1 291 1 634 3 311 3 377 3 864 Source: http://www.redlist.org/info/tables/table2.html Credit: Topfoto
  • 25. 34 Impacts Simplification of ecosystems and ecore- gions results in species extinctions and a loss of natural resources (Tilman et al. 2001). Climate change and the way in which ecological communities respond to it have enormous conservation implica- tions. These include developing awareness of the transience of native ranges and plant associations and the significance of population declines and increases, as well as the need to develop targets and refer- ences for restoration, and strategies for dealing with global warming (Millar 2003). For example, changes in the potential dis- tribution of tree and shrub taxa in North America in response to projected climate change are expected to be far-reaching and complex; growing ranges for various species will shift not only northward and upward in elevation but in all directions (Shafer et al. 2001). Some models predict that more than 80 per cent of the world’s ecoregions will suffer extinctions as a result of global warming (Malcolm et al. 2002). Ecoregions expected to be most dramatically altered by climate change include the boreal forests of the North- ern Hemisphere, the fynbos of Southern Africa, and the Terai-Duar savanna and grasslands of northeastern India (Malcolm et al. 2002). Credit: NRCS Credit: Topfoto
  • 26. 35 2.5 Biodiversity, Invasive Species, and Protected Areas Biological diversity, or “biodiversity,” refers to the variety of life on the Earth in all its forms. There are three levels of biodiversity: biodiversity of a landscape or ecosystem, species biodiversity, and genetic biodiversity (IUCN, UNEP, and WWF 1991). These three levels are intimately connected. For example, genetic diversity is often the key to survival for a species, equipping it with the neces- sary resources to adapt to changing environmental conditions. Species diversity, in turn, is typically a measure of ecosystem health (Rosenzweig 1999). We have just begun to identify and fully un- derstand the diverse living things that currently inhabit the Earth. Scientists have discovered and described roughly 1.75 million species to date. That number is expected to increase substantially when all marine organisms, arthropods, bacteria, and viruses are eventually added to the list. Tragi- cally, however, humans are destroying this great diversity at an alarming rate. Rates of human-in- duced species extinction are estimated to be 50 to 100 times the natural background rate; this could Credit: Gyde Lund Credit: www.invasive.org
  • 27. 36 increase to 1 000 to 10 000 times the natu- ral rate in the next 25 years (Lund et al. 2003; Pellew 1996). Why are so many species becoming extinct? Human activities over the last three centuries have significantly trans- formed the Earth’s environment, primarily through the conversion of natural ecosys- tems to agriculture (Ramankutty and Foley 1999). It is estimated that cropland ex- panded from 3-4 million km2 (1.2-1.5 mil- lion square miles) in 1700 to 15-18 million km2 (5.8-6.9 million square miles) in 1990, primarily at the expense of forests. At the same time, grazing lands expanded from 5 million km2 (1.9 million square miles) in 1700 to 31 million km2 (12 million square miles) in 1990, largely via the conversion of native grasslands (Goldewijk and Raman- kutty 2001). In addition to agriculture-driv- en landscape transformations, the move to monoculture-based forms of agriculture has contributed to declining biodiversity. Wild plants and animals are a major source of food. Billions of people still har- vest wild or “bush” food around the world. Between one-fifth and one-half of all food consumed by poor people in developing countries is gathered rather than culti- vated. On a global scale, ocean fish caught in the wild account for 16 per cent of the human diet (Harrison and Pearce 2001). Wild plants are also a major source of medicine, and the loss of biological diver- sity has serious implications in terms of human health. Of the 150 most frequently prescribed drugs, more than half are derived from or patterned after chemical compounds found in plants (Brehm 2003). Moreover, plants are an important source of fuel. Nearly 15 per cent of the world’s energy is derived from the burning of plant materials (De Leo and Levin 1997). Worldwide, people eat only a small frac- tion of the 70 000 plants known to be ed- ible or to have edible parts (Wilson 1989). But retaining biodiversity is still vital for the food supply, since most food crops con- stantly require an infusion of “wild” genes to maintain their resistance to ever-evolv- ing pests (Harrison and Pearce 2001).
  • 28. 37 Despite our dependence on biodi- versity, it has been estimated that 27 000 species are lost every year—roughly three per hour. Other estimates put the number much higher. The greatest loss of bio- diversity is currently taking place in wet tropical regions where rain forest ecosys- tems are being altered dramatically. But loss of biodiversity is also evident in drier regions, due to desertification. Major con- tributors to species extinctions and loss of biodiversity worldwide include: • human population growth; • unsustainable patterns of consump- tion such as over-harvesting of plant and animal resources; • poor agricultural practices; • increased production of wastes and pollutants; • urban development; and • international conflict (UNEP 2002b). Loss of biodiversity occurs hand-in- hand with habitat loss, and habitat loss is generally greatest where human popula- tion density is highest (Harrison 1997). One type of habitat loss is fragmentation. Fragmentation occurs where a once-con- tinuous ecosystem is broken up into many small, poorly connected patches of land, which happens when blocks of trees are removed from a forest. A change in land cover typically accompanies fragmenta- tion. Six categories of fragmentation have been identified (interior, perforated, edge, transitional, patch, and undeter- mined) depending on how a given area of land is broken up (Riitters et al. 2000). Fragmentation may be human-induced or due to natural causes such as fire, floods, or wind. Fragmentation may create more diverse landscapes than were originally present, and while it may destroy habitats of some species, it can also create habitats for others. 37 Left to right: Junipers near near Paulina, Oregon. Without natural fires to control their spread, junipers can become invasive in rangelands (Credit: Gyde Lund). Women herding goats (Credit: Topfoto). Cattle grazing in a bog (Credit: Topfoto). Kudzu taking over the land and trees in the southeastern United States (Credit: Gyde Lund). Photos left to right: A family of elephants in Africa (Credit: Gyde Lund). A clear-cut section of forest (Credit: Topfoto). Yellowstone National Park (Credit: Gyde Lund). People often peel the loose bark off birches for souvenirs. Danforth, ME USA (Credit: Randy Cyr, GREENTREE Technolo- gies, www.forestryimages.org).
  • 29. 38 Invasive Species Most plants and animals exist in places in which they did not originate. They moved or were introduced into new areas over time. While rooted plants cannot them- selves move from place to place, the dis- persion of their seeds by wind, water, and animals has enabled them to spread into many new habitats. An introduced species is one whose existence in a given region is due to some type of human activity. That activity may enable the species to cross natural geo- graphic barriers or it may transform condi- tions in an area as to be in some way favor- able to the species’ growth and spread. Introduced species are also called alien, or exotic, species. Many introduced species have been actively transported by people to new areas for specific purposes and have played important and beneficial roles in human history. Most modern agricultural crops were introduced into the regions they now inhabit. For instance, corn (maize) is thought to have originated in Mexico some 7 000 years ago. Today it is found world- wide. Wheat probably originated in the Middle East. Currently, wheat is grown on more land area worldwide than any other crop and is a close third to rice and corn in total world production. Many modern domesticated animals were also new species introductions at some point in their history. Modern do- mestic cattle evolved from a single early ancestor, the auroch. Cattle were domes- ticated between 10 000 and 15 000 years ago near the boundary of Europe and Asia or Southwest Asia. Cattle are now widely distributed throughout the world. The total world cattle population in the late Figure 2.11: The number and extent of the world’s protected lands increased significantly during the period from 1872 to 2003. The greatest increase has occurred over the past few decades. In 2003, the total number of protected sites surpassed 100 000, while total area increased to more than 18 million km2 (7 million square miles). Source: Chape et al. 2003 100,000 80,000 60,000 40,000 20,000 0 1872 1902 1917 1932 1947 1952 1962 1977 1992 2003 0 2,000,000 4,000,000 6,000,000 8,000,000 10,000,000 12,000,000 14,000,000 16,000,000 18,000,000 Number of sitesArea of Sites Cumulative Growth in Protected Areas by 5 Year Increments: 1872 – 2003 Case Study: Lake Maracaibo, Venezuela Lake Maracaibo in northwestern Venezuela is the largest natural lake in South America at 13 330 km2 (5 146 square miles). At its widest point, it is more than 125 km (78 miles) wide. The lake itself lies in the Maracaibo basin, which is semi-arid in the north, but averages over 1 200 mm (47 in) of annual rainfall in the south. It has been suffering from a serious problem of invasive duckweed, a tiny aquatic plant that grows in freshwater. This first image (left), taken by the Aqua MODIS satellite on 17 December 2003, shows the lake during the winter months, when duckweed is absent from the lake’s waters, and the silvery sunglint is ab- sent. In summer the weed blooms. The true-co- lour image from 26 June 2004 (middle) shows strands of duckweed curling through the lake, floating at the surface, or slightly submerged in the brackish water. A closer look in August 2004 (right) reveals the stranglehold the duck- weed has on port areas, especially along the important oil shipping routes in the neck of Lake Maracaibo. Fish and the fishing industry suffer as thick green mats block photosynthesis and alter fish habitats. The weed also adheres to boats, affects cooling systems, and obstructs travel. In September 2004, Venezuela’s Min- istry of Environment and Natural Resources reported that it had reduced the duckweed area by 75 per cent, using duckweed harvesting machines from the United States. The ministry is investigating using the harvested weed as animal fodder. Credit: (Left, right images) NASA; (middle) LPDAAC – USGS National Center for EROS 38
  • 30. 39 1980s was estimated to be nearly 1.3 bil- lion. Chickens—the world’s most abundant domesticated bird—are generally believed to have descended from jungle fowl in Southeast Asia. They were subsequently introduced into almost every country and region of the world. In stark contrast to such positive species introductions are those where introduced exotic species have become invasive. Scien- tifically speaking, invasive species are those organisms that are unwanted and have a tendency to spread. Invasive species harm, or have the potential to harm, a given ecosystem or peoples’ health or economic well-being (Clinton 1999). Historically, some invasive exotic species have been intentionally introduced into new settings; the introduction of the common starling into the United States and the rabbit into Australia are two classic examples. Intro- ductions of other invasive species have occurred by accident, such as that of zebra mussels into the American Great Lakes as a result of shipping activities. Native or indigenous species are those that occur naturally in an area or habitat. Invasive species often out-compete and dis- place native species because the invaders have no natural enemies and can spread easily and quickly. Both managed and natural ecosystems throughout the world are under siege from increasing numbers of harmful invasive species. These include disease organisms, agricultural weeds, and destructive insects and small mammals that threaten economic productivity, ecological stability, and biodiversity. On a local scale, such invasions decrease diversity of native flora and fauna. Globally, they contribute to making the biosphere more homoge- neous and less resilient. Natural biodiversity helps to maintain ecological resilience in the face of varying environmental conditions (Holling et al. 1995). Invasion by exotic species lessens ecological resilience and can transform ecosystems in unpredictable ways that may have negative consequences for people. This problem is growing in severity and geographic extent as global trade and international travel expand, as markets are liberalized and deregulated, as ecosys- tems are further altered and fragmented, and as global climate continues to change (Brandt 2003; Dalmazzone 2000). Invasions by alien species are set to worsen in the next few decades if the world continues to warm as most scientists predict it will. Longer growing seasons spawned by global warming may give invasive weedy plants time to flower and set seeds where previously they could only spread asexually. This new-found ability could allow the weeds to adapt to new environments more quickly, and better resist attack by insects. Higher levels of carbon dioxide in the atmosphere may also favor plants that can utilize extra carbon dioxide and grow faster. One such example is cheatgrass, an introduced species that now dominates vast areas of the American West (Holmes 1998). In other parts of the world, invasive exotic plant species make up 4 to 44 per cent of the total number of species in ecosystems (Lövei 1997). Invasive exotic species are one of the most significant drivers of environmental change worldwide. They also contribute to social instability and economic hard- ship, and place constraints on sustainable development, economic growth, and en- vironmental conservation. Worldwide, the annual economic impact of invasive species on agriculture, biodiversity, fisheries, for- ests, and industry is enormous. The World Conservation Union (IUCN) estimates that the global economic costs of invasive exotic species are about US$400 billion annually (UNEP 2002a). Alien invaders cost 140 bil- lion dollars a year in the USA alone (Mc- Grath 2005). Less easily measured costs also include unemployment, impacts on infrastructure, shortages of food and water, environmental degradation, increases in the rate and severity of natural disasters, and human illness and death. Invasive ex- otic species represent a growing problem, and one that is here to stay—at least for the foreseeable future (Brandt 2003). Protected and Wilderness Areas Wilderness areas are those areas of land that are relatively untouched by human activities. To qualify as wilderness, an area must have 70 per cent or more of its origi- nal vegetation intact, cover at least 10 000 km2 (3 861 square miles), and be inhab- ited by fewer than five people per km2 (12 people per square mile). Wilderness areas are major storehouses of biodiversity. They also provide critical ecosystem services to the planet, including watershed maintenance, pollination, and carbon sequestration. Wilderness areas currently cover nearly half the Earth’s ter- restrial surface (Mittermeier et al. 2003). While that represents a significant amount of land area, however, most wilderness areas are not protected, and are therefore at risk. Table 2.11 – Growth of protected areas of the world in 1994 and 2004 (in per cent) Ratio 1994 2004 World 7.8 9.5 Developed Countries 11.3 14.1 Commonwealth Independent States (CIS) 2.8 3.0 CIS-ASIA 3.6 3.8 CIS-Europe 2.6 2.8 Developing 7.6 9.1 Northern Africa 3.5 3.9 Sub-Saharan Africa 8.1 8.3 Latin America & the Caribbean 8.0 9.9 Eastern Asia 8.2 14.2 Southern Asia 4.5 5.1 South-eastern Asia 4.8 5.9 Western Asia 21.4 22.0 Oceania 1.0 1.1 Least Developed Countries (LDCs) 7.7 7.9 Landlocked Developing Countries (LLDCs) 8.4 9.6 Small Island Developing States (SIDs) 1.6 2.8 There is considerable variation in the total area protected between regions, ranging from 1.1 per cent in the developing countries of Oceania to 22.0 per cent in Western Asia. The percentage coverage in both Western and Eastern Asia (14.2 per cent) exceeds the coverage of all developed countries (14.1 per cent) representing a significant commitment by these regions to conservation. However, the con- straints imposed upon the data by the criterion for a date of establishment within the Millennium Devel- opment Goals (MDG) reporting period suggest that all figures should be treated cautiously. Source: UNEP-WCMC 2005
  • 31. 40 One of the most effective means for conserving wilderness is through the de- velopment of protected areas. A protected area is an area of land (or water) especially dedicated to the protection and mainte- nance of biological diversity, along with natural and associated cultural resources, that is managed through legal or other effective means (IUCN 1994). Protected areas are managed for a wide variety of purposes, including: • scientific research; • wilderness protection and preservation of species and ecosystems; • maintenance of environmental services; • protection of specific natural and cultural features; • tourism and recreation; • education; • sustainable use of resources from natural ecosystems; and • maintenance of cultural and tradition- al attributes (Green and Paine 1997). The 2003 United Nations List of Pro- tected Areas—compiled by UNEP and the IUCN and released during the Fifth World Parks Congress in Durban, South Africa—reveals that there are now 102 102 protected areas, together representing a total land area roughly equivalent to China and Canada combined, or more than 12 per cent of the Earth’s surface (Chape et al. 2003). That total exceeds the ten per cent called for in the Caracas Action Plan formulated at the Fourth World Parks Congress held in 1992 in Caracas, Venezu- ela. Between 10 and 30 per cent of some of the planet’s vital natural features, such as Amazonian rain forests and tropical savan- nah grasslands, are classified as protected areas. However, ecoregional and habitat representation remains uneven. Currently, almost half of the world’s protected areas are found in regions where agriculture and logging are primary land- use strategies. All indications are that food Source: www.conservation.org World Environmental Hotspots as identified by Conservation International.
  • 32. 41 and timber production will need to in- crease in coming decades to keep up with population growth and increasing demand for wood and wood products. Thus, estab- lishing additional protected areas, while helping to preserve biological diversity, will take land out of production and put more stress on lands elsewhere (Sohngen et al. 1999). Balancing the need to protect wild species and conserve habitat while at the same time increasing agricultural and tim- ber production represents a tremendous challenge (McNeely and Scherr 2001). Of the world’s protected areas, the vast majority—91.3 per cent—are found in ter- restrial ecosystems. Fewer than ten per cent of the world’s lakes and less than 0.5 per cent of the world’s seas and oceans lie within protected areas (SBSTTA 2003). Recognizing that the world’s marine en- vironment remains largely unprotected, the Fifth World Parks Congress put forth the Durban Action Plan. The Plan calls for the establishment of at least 20-30 per cent marine protected areas worldwide by 2012. The Plan also calls for the conservation of all globally threatened or endangered spe- cies by 2010. In the coming years, further develop- ment of global networks of protected areas will need to focus on four areas (Green and Paine 1997): • consolidating existing networks by ad- dressing major gaps; • physically linking protected areas to one another so they function more ef- fectively as networks; • expanding networks by forming or strengthening links with other sectors, notably the private sector; • and improving the effectiveness with which protected areas are managed. Protected areas are often considered a kind of sacrifice, a financial burden rather than an asset. Yet establishing, maintain- ing, and expanding protected areas is a fundamental approach to safe-guarding the environment and conserving biological diversity. Protected areas are also important in other respects, such as helping to maintain freshwater resources. Protected areas may also hold the cures to some of the world’s most devastating diseases in the form of unique chemical compounds and as-yet-un- discovered genetic material. A recent analysis published by Con- servation International identified nine additional sites as areas of extraordinarily high biological diversity, popularly known as hotspots, taking the count of hotspots to 34. These 34 regions worldwide are where 75 per cent of the planet’s most threatened mammals, birds, and amphibians survive. In these 34 hotspots, estimated 50 per cent of all vascular plants and 42 per cent of terrestrial vertebrates exist. Therefore it is critical to protect and preserve these areas (Conservation International 2005). Credit: Christian Lambrechts Credit: Topfoto
  • 33. 42 Case Study: Ranikhet Forests, Sonitpur, India S. P. S. Kushwaha, A. Khan, B. Habib, A. Quadri and A. Singh This is a study of habitat evaluation for sambar (Cervus unicolor var. niger) and muntjak (Munti- acus muntjak var. vaginalis) in the Ranikhet for- ests of Kumaon Himalaya in the northeastern province of Sonitpur, India. Location: The study was carried out in the Chaubatia Re- serve Forest (area 8428 ha) located close to the town of Ranikhet in the Almora district in Ku- maon Himalaya (79°24’ –79°30’ E and 29°35’ – 29°4’ N). Forests dominate the landscape in the study area. The Kumaon region is spread over 21 073 km2 (8 136 square miles) and had extensive tracts of natural forests until a few centuries ago. Though there was no scientific exploration to document the extent of these natural forests and in the faunal populations, old records of naturalists and hunters docu- ment floral and faunal richness in the region. Extensive areas under natural forests were cleared until to late 1940s either for valuable timber or for planting commercially viable species. Five major forest types are found in Ra- nikhet: oak forest, oak-pine forest, chirpine forest, pure deodar and mixed deodar forests. The study area provides diverse and favourable habitats for a wide range of wild animals. The most notable species are: common leopard (Panthera pardus), red fox (Vulpes vulpes), Hima- layan yellow-throated marten (Martes flavigula), hanuman langur (Semnopethicus entellus), rhesus macaque (Macaca mulatta), sambar (Cervus unicolor), muntjak (Muntiacus muntjak) and Kashmir flying squirrel (Hylopetes fimbriatus). Four broad soil categories—red loam, brown forest soil, loam and meadow soil—have been reported from Ranikhet. Habitat suitability analysis is considered important for introduction, rehabilitation, and ex-situ conservation of species and their habitats. Habitat models are based on the relationship between the animal and the environment. Such models are normally animal-centric, in this case the two animals are sambar and muntjak, and usually consistent with the data needs for planning. Studies show that both sambar and muntjak avoid human distur- bance. The low overall suitability of Chaubatia forest for sambar (23.89 per cent) and muntjak (12.60 per cent) can be attributed to distur- bance in their habitat. Hence, human activities in the forests need to be minimized for any effective conservation of these two species. An analysis of the findings indicate a pri- mary preference of sambar to high tree and herb density but low shrub cover, and indiffer- ence for herb diversity found in higher alti- tudes, whereas muntjak seem to prefer regions of high grass density on the same scale found in relatively lower altitudes with higher herb density and diversity. Sambar prefer sites that score low in terms of direct human disturbance and similar conclusions can be drawn for munt- jak. The analysis indicates an indifference of both the species towards logging activities when good grass growth is resultant. Because of increasing disturbance, the wildlife habitats in Kumaon re- gion are shrinking. If the situation is not advertised, a time may come when ungulates, which play important role in vegetation dynamics and form a connect- ing link in the food chain, will disappear from these forests. Hence, necessary steps should be taken to conserve the forests. Source: Kushwaha et al. 2004Habitat loss (1999–2002) Habitat loss (1994–2002) Habitat loss (1994–1999) Credit: Dr. Bibhab Talukdar 42 Sonitpur Map of Study Area
  • 34. 43 2.6 Energy Consumption and Resource Extraction Energy is measured by its capacity to do work (potential energy) or the conversion of this capacity to motion (kinetic energy). Most of the world’s convertible energy comes from fossil fu- els that are burned to produce heat that is then converted to mechanical energy or other means in order to accomplish tasks (EIA 2004a). Energy is essential for the fulfillment of many basic human needs, such as generating electric- ity, heating and cooling living spaces, cooking food, forging steel, and powering engines for many forms of transportation (Harrison and Pearce 2001). Energy use is closely tied to hu- man health and well-being. Worldwide, roughly 2 000 million people do not have access to elec- tricity. Countries in which energy use is low tend to have high infant mortality rates, low literacy rates, and low life expectancies. It is through the utilization of convertible energy sources that the modern world has transcended its agrarian roots and fostered the energy-driven societies that characterize it today. Generating the power to sustain these societies has entailed extract- ing massive amounts of natural resources from the planet. Extraction is the process of obtain- Credit: Topfoto Credit: NOAA, NASANightlight Map of the World
  • 35. 44 ing a useful substance from a raw material (NCR&LB 2003). Such raw materials may include fossil fuels, metals, minerals, water, and biomass, including animals and raw materials from plants and crops (EEA 2001). Resources can be divided into those that are renewable, such as plant and animal material, and those that are not, including coal, oil, and minerals. The Earth has a finite supply of non-renewable resources. Even renewable resources, however, are exhaustible if they are used faster than they can be replenished. Total world energy consumption has risen almost 70 per cent since 1971 (WRI 1998). It is expected to increase by 58 per cent between 2001 and 2025, from 404 quadrillion British thermal units (Btu) in 2001 to 640 quadrillion Btu in 2025 (EIA 2003; EIA 2004b). While a slow, steady in- crease in energy consumption is expected in industrialized nations, where most en- ergy use currently takes place, a meteoric increase in consumption is anticipated in the developing world during that period (Tilford 2000). The tempo at which energy resources are being used to fuel modern societies is rapidly depleting supplies of non-re- newable resources and far exceeding the rate at which renewable resources can be naturally renewed (Ernst 2002). In many least–developed countries, for instance, burning biomass in the form of wood (largely a non-renewable resource) gener- ates 70 to 90 per cent of the energy needed and disregard for the fate of non-renew- able resources is prevalent. In the United States, for example, 72 per cent of the country’s electricity is generated using non- renewable resources. Only about 10 per cent comes from renewable resources, with nuclear power providing the rest. Currently, 85 per cent of world energy consumption comes from the burning of fossil fuels—oil, coal, and natural gas (BP 2003). Although no immediate shortages of these non-renewable energy resources exist, supplies are finite and will not last forever. What took millions of years to Global Natural Resources Affluent countries consume vast quantities of global natural resources, but contribute proportionately less to the extraction of many raw materials. This imbalance is due, in part, to domestic attitudes and policies intended to protect the environment. Ironically, developed nations are often better equipped to extract resources in an environmentally prudent manner than the major suppliers. Thus, although citizens of affluent countries may imagine that preservationist domestic policies are conserving resources and protecting nature, heavy consumption rates necessitate resource extraction elsewhere and oftentimes with weak environmental oversight. A major consequence of this “illusion of natural resource preservation” is greater global environmental degradation than would arise if consumption were reduced and a larger portion of production was shared by affluent countries. Clearly, environmental policy needs to consider the global distribution and consequences of natural resource extraction (Berlik et al. 2002). Case Study: Blackout in United States and Canada 14 August 2003 On 14 August 2003, parts of the northeastern United States and southeastern Canada expe- rienced widespread power blackouts. Among the major urban agglomerations affected by the electrical power outage were the cities of New York City, Albany, and Buffalo in New York, Cleveland and Columbus in Ohio, Detroit in Michigan, and Ottawa and Toronto in Ontario, Canada. Other U.S. states, including New Jersey, Vermont, Pennsylvania, Connecticut, and Massachusetts, were also affected. The blackout resulted in the shutting down of nuclear power plants in New York and Ohio, and air traffic was slowed as flights into affected airports were halted. Approximately 50 mil- lion people were affected by the outage. The change in the nighttime city lights is apparent in this pair of Defense Meteorological Satel- lite Program (DMSP) satellite images. The top image was acquired on 14 August, about 20 hours before the blackout, and the bottom im- age shows the same area on 15 August, roughly seven hours after the blackout. In the bottom scene, notice how the lights in Detroit, Cleveland, Columbus, Toron- to, and Ottowa are either missing or visibly reduced. Previous major black- outs include the 9 November 1965 outage caused by a faulty relay at a power plant in Ontario, which affected a large swath of land stretching from Toronto to New York. Another one followed on 14 July 1977, the result of a lightning strike, affecting New York City. The power supply in nine west- ern states was also affected in August 1996 as a result of a high demand for electricity, a heat wave, and sagging electrical power lines. Source: NASA 2002, http://earthobservatory.nasa. gov/NaturalHazards/natural_hazards_v2.php3?img_ id=11628; GlobalSecurity.org 2003, http://www. globalsecurity.org/eye/blackout_2003.htm Credit Image courtesy Chris Elvidge, U.S. Air Force http://earthobservatory. nasa.gov/NaturalHazards/Archive/Aug2003/NE_US_OLS2003227_lrg.jpg Credit: Topfoto 44
  • 36. 45 Case Study: SWERA, the Solar and Wind Energy Resource Assessment The Solar and Wind Energy Resource Assessment (SWERA)—co-financed by the Global Environ- ment Facility (GEF)—is a project to assist 13 devel- oping countries identify optimal locations for po- tential solar and wind energy production. SWERA assists by creating a global archive of information gathered through a network of international and national agencies. These agencies collect and analyse data on solar and wind energy resources, energy demand, and electrification. Using inputs derived from satellite and surface observations, SWERA partners model wind and solar energy re- source potential and produce maps of wind power density and monthly average and daily total solar radiation of a given area. This information can then be used to facilitate investments and create policies in the participating countries for develop- ing solar and wind energy. Source: UNEP/GRID–Sioux Falls Credit: NREL Credit: NREL 45 Credit: NREL
  • 37. 46 produce will be consumed in the time frame of a century or two (Hawken 1994; Tilford 2000). This rapid, large-scale consumption of a fuel source that took millennia to produce has generated unforeseen complications, several with global implications. Burning fossil fuels produces atmospheric pollutants such as oxides of sulfur and nitrogen and unburned hydrocarbons. Fossil fuel com- bustion also adds one of the most prevalent greenhouse gases—carbon dioxide—to the atmosphere. As a result, world energy use has emerged at the center of the climate change debate. World carbon dioxide emis- sions are projected to rise from 23 900 million metric tonnes in 2001 to 27 700 million metric tonnes in 2010 and 37 100 million metric tonnes in 2025 (EIA 2004b). The Earth’s atmosphere and bio- sphere will not remain unchanged by the combustion of such enormous amounts of these fuels. The relatively sudden release of massive amounts of carbon has the poten- tial not only to disrupt the Earth’s heat balance and climate, but other parts of the global carbon cycle as well, and in unpredictable ways. The Earth cannot sustain existing levels of resource consumption. Furthermore, resource extraction methods are often environmentally destructive. The impact of environmental degradation hits those who are poorest the hardest. Many of the world’s energy sources and other natural resources come from developing countries. Extracting and harvesting these resources can result in air, soil, and water pollution. It also generates waste; the amount of waste associated with extracting minerals, for instance, can be enormous. Disposing of wastes in environmentally friendly ways is a daunting, if not impossible, task in many developing nations. A major challenge for the 21st century is to develop methods of generating and us- ing energy that meet the needs of the popu- lation while protecting the planet (Harri- son and Pearce 2001). Yet most of the world is still without energy policies that direct or restrict consumption patterns. Only through conservation and resource recovery strategies can we hope to reach a sustainable balance between available re- sources and their consumption. The utiliza- Biomass Plant and animal material, or biomass, is a rich source of carbon compounds. When burned to release energy, biomass does not add additional carbon to the natural carbon cycle as do fossil fuels. Fast-growing plants, such as switchgrass, willow, and poplar can be harvested and used as “energy crops.” Biomass wastes, including forest residues, lumber and paper mill waste, crop wastes, garbage, and landfill and sewage gas, can be used for heating, as transportation fuels, and to produce electricity, while at the same time reducing environmental burdens. According to the World Bank, 50 to 60 per cent of the en- ergy used in developing countries in Asia, and 70 to 90 per cent used in developing countries in Africa, comes from wood or other biomass; half the world cooks with wood. Coal Coal is the world’s largest source of fuel for electricity production. The byproducts of coal combustion are also a major source of envi- ronmental damage. Natural Gas Compared to coal and oil, natural gas is a relatively clean-burning fossil fuel. It is used primarily for heating and for powering many industrial processes. Increasingly, natural gas is burned to drive turbines used in the pro- duction of electricity. Oil Although used primarily in the production of transportation fuels, oil is also used for generating electricity, for heating, and in the production of chemical compounds and syn- thetic materials. Sources of Energy Credit: www.freefoto.com Credit: www.freefoto.com Credit: www.freefoto.com Credit: Volker Quaschning Sources: www.freefoto.com, http://www.topfoto.co.uk/, Prof. Dr.-Ing. habil. Volker Quaschning http://www.volker-quaschning.de
  • 38. 47 Wind Wind power is an ancient energy source that has moved into the modern era. Aero- dynamically designed wind turbines can produce electricity more cheaply than coal- burning power plants. Wind power is an ancient energy source Geothermal Geothermal energy is energy contained in intense heat that continually flows outward from deep within the Earth. Geothermal energy is typically used to heat water, which is then used to heat buildings directly or to drive turbines to produce electricity. Solar Solar energy—power from the sun—is readily available and inexhaustible. Hu- mans have used sunlight for heating and drying for thousands of years. Converting the power of sunlight into usable energy forms, such as electricity, is not without cost, but the sunlight itself is free. Solar cells, or photovoltaics, are devices used to transform sunlight into electric current. Hydroelectric Hydroelectric power uses the force of mov- ing water to produce electricity. A large part of the world’s electricity is produced in hydroelectric plants. Many of these plants, however, are associated with large dams that disrupt habitats and displace people. Small- er “run of the river” hydroelectric plants have less environmental impact. tion of non-renewable resources is theoretically not sustainable. But if used wisely, some non-renewable resources can be conserved and recycled for a very long time. To recycle means to make new prod- ucts from old ones. Recycling materials such as paper, aluminum, and glass saves energy, reduces pollution, and conserves natural resources (EPA 2003). Every nation must assume responsibility for recycling its own wastes. Some industrialized West- ern countries “dispose” of their electronic wastes by shipping them to Asia—an in- creasingly common practice (FOEE 2004). To insure that renewable resources can be replenished at a sustainable rate, people must switch to more environmen- tally friendly energy sources and employ new technologies that can help make such sustainability a reality (Ernst 2002). Indeed, new technologies—coupled with effective and efficient use of existing technologies— are essential to increasing the capabilities of countries to achieve sustainable devel- opment on many fronts, as well as sustain- ing the world’s economy, protecting the environment, and alleviating poverty and human suffering (Hay and Noonan 2000). Most changes in the Earth, including changes brought about by increasing ener- gy consumption, can be observed through such tools as remote sensing. Remote sensing is the collection of information about an object without being in physical contact with the object. Aircraft and satel- lites are the common platforms from which remote sensing observations are made. Satellite imagery, a crucial component of this publication, is especially useful for studying changes in our Earth’s environ- ment. Most satellite imagery is collected using multispectral scanners, which record light intensities in different wavelengths in the spectrum from infrared through vis- ible light through ultraviolet light. Satel- lite imagery is useful because of its stable nature (same resolution, same time, same data characteristics). Aided by the global positioning system (GPS), these satellites know their orbital position precisely. Thus, satellite imagery is ideally suited for applica- tions requiring large-area coverage, such as agricultural monitoring, regional mapping, environmental assessment, and infrastruc- ture planning (Krouse et al. 2000). Nuclear Nuclear power harnesses the heat of ra- dioactive materials to produce steam for electricity generation. The use of nuclear power is expected to decline as aging plants are taken out of operation. Credit: Volker Quaschning Credit: www.freefoto.com Credit: Topfoto Credit: Topfoto Credit: Topfoto
  • 39. 48 THE BLACK TRIANGLE, EUROPE MINING The so-called Black Triangle is an area bordered by Germany, Poland, and the Czech Republic and is the site of extensive surface coal mining opera- tions. In the 1975 satellite image above, the gray areas are surface mines located primarily in the Czech Republic. Air-borne pollutants from coal extraction activities tended to become trapped by the mountainous ter- rain to the northeast and were concentrated in the area around the mines, 48 48
  • 40. 49 eventually causing severe deforestation along the border between the Czech Republic and Germany. In the 2000 image, this deforestation is very obvi- ous, appearing as large brownish patches. Interestingly, the 2000 image also reveals somewhat improved vegetation cover—a slight“greening”of the landscape—as compared to conditions in 1975. Some of this improvement may be attributable to actions taken by the three countries bordering the Black Triangle to reduce pollutants produced by the mining operations. The implementation of anti-pollution technologies, including circulating fluid- ized-bed boilers, clean coal technology, and nitrous oxide emission burners, appears to have reversed some, albeit not all, of the environmental damage experienced by the region as a result of the mines. 49
  • 41. 50 COPSA MICA, ROMANIA Copsa Mica is a large industrial city located in the very center of Romania and is classified as an “environmental disaster area.” The en- vironmentally damaged area covers hundreds of square kilometres of land. The main industries in Copsa Mica are non-ferrous metalworking and chemical processing plants, and their effect on the environment has been devastating. Air pollution by heavy metals is 600 times In one year up to 67 000 tonnes of sulfur dioxide, 500 tonnes of lead, 400 tonnes of zinc and 4 tonnes of cadmium can be released by the city’s two ac- tive smelters. The affected area is huge: in excess of 180 000 hectares (445 000 acres) of land are affected by air pollution and 150 000 hectares (371 000 acres) of agricultural land are untenable. 31 000 hectares (77 000 acres) of forest are also unacceptably polluted. 50 MINING Credit: Lorant Czaran ¸ ¸ ¸
  • 42. 51 the allowed levels. To make matters worse, a lead-smelting facility emitted fumes containing sulfur dioxide, lead, cadmium, and zinc on the town and surrounding area for 50 km2 (19 square miles). The entire town and much of the surrounding area were covered with a blanket of black soot daily until the facilities were forced to close in 1993. In 1989 Copsa Mica was exposed as one of the most polluted places in Europe. It has the highest infant mortality rate in Europe, 30.2 per cent of children suffer reduced“lung function”and 10 per cent of the total popula- tion of 20 000 suffer“neurobehavioral problems.” The soil and the local food chain probably will remain contaminated for at least another three decades. 51 ¸
  • 43. 52 ESCONDIDA, CHILE Located at an elevation of 3 050 m (10 006 ft), Chile’s Escondida Mine is an open-pit copper, gold, and silver mine and also the largest cop- per mine in the world. Isolated in the barren, arid Atacama Desert in the country’s far north, the Escondida Mine relies heavily on external well fields for the water used in its mining operations. Unlike similar mining operations, however, Escondida has a redeveloped tailings 52 MINING
  • 44. 53 impoundment, which appears on the 1989 image as a white patch in the lower left corner. Impoundments of this type help reduce water consump- tion and enhance water conservation, two areas where mining activities typically fall short. The Escondida Mine also minimizes the impact of its operation on the environment by means of a 170-km-long (106 miles) un- derground pipeline that carries copper concentrate slurry from the mine to the port of Coloso. This underground scheme is efficient and ecologically sound, as the copper travels downhill without disrupting the environment. The 2003 image shows how the Escondida Mine has grown and expanded while at the same time continues to minimize negative impacts from its mining operations on the environment. 53
  • 45. 54 EKATI, CANADA As of 2001, the Ekati Mine was North America’s only operating dia- mond mine. Located in the north central Northwestern Territories (NWT) of Canada, the mine yields raw diamonds from a sparsely inhabited sub-arctic region. Air transport connects mine personnel and supplies year-round, while a single winter ice road provides the only vehicular access just ten weeks per year. 54 MINING
  • 46. 55 Expanded mining exploration in the 1990s began a new era for this other- wise undeveloped region. Wildlife officials have collared and tracked caribou, in a herd ranging from 350 000 to half a million, to monitor their movement and behavior in proximity to the mines. Historical information about the herds comes from Dogrib and Inuit knowledge obtained from elder natives who still inhabit the NWT, and who have depended on the caribou for centuries. These two images compare the same area, pre-mining and after mine op- erations have commenced. The white patch in the northwest portion of the 2000 image represents the mine and the associated infrastructure. 55
  • 47. 56 OK TEDI MINE, PAPUA NEW GUINEA The controversial Ok Tedi copper mine is located at the headwaters of the Ok Tedi River, a tributary of the Fly River, in extremely rough terrain in the rainforest-covered Star Mountains of Papua New Guinea’s western province. Prior to the opening of the mine in 1984, this area was very isolated, sparsely inhabited, and ecologically pristine. This56 MINING
  • 48. 57 pair of satellite images reveals the tremendous environmental impact the mine has had in 20 years. The uncontrolled discharge of 70 million tonnes of waste rock and mine tailings annually has spread more than 1 000 km (621 miles) down the Ok Tedi and Fly rivers, raising river beds and causing flood- ing, sediment deposition, forest damage, and a serious decline in the area’s biodiversity. In the 1990 image, both the mine and the township of Tabu- bil—developed east of the river in support of the mine—are clearly visible. Lighter patches of green show disturbance of the original forest cover from subsistence agriculture, road clearing, and other infrastructure development. 57
  • 49. 58 POWDER RIVER BASIN, UNITED STATES The Powder River basin, located in northeast Wyoming and southeast Montana, is a core area of coal and natural gas production in the United States. Coal mining activities in the basin date back to 1975. In recent years surface mining in Wyoming has mush- roomed, making it the leading coal producer in America58 MINING
  • 50. 59 at almost 300 000 tonnes per year. Similarly, coal bed methane gas develop- ment in this region is unrivaled in the U.S. The images show areas under coal exploitation. Notable is the remarkable increase in mining operations in the 2001 image. Reasons for the expansion include improvements in the area’s rail network, the high grade of the coal deposits, and the depletion of high-grade deposits in other major coal min- ing areas such as West Virginia and Kentucky. The open cast coal mines appear as white-purplish while the reddish brown areas are bare ground. Vegetated areas are green. 59
  • 51. 60 WEIPA BAUXITE MINE, AUSTRALIA Mining of bauxite (aluminum ore) began at Weipa, on the Cape York Pennisula in Queensland, Australia, in 1963. The mine produces 8.5 metric tonnes of ore annually, making it one of the world’s largest open-cut bauxite mines. Under current mining practices, vegetation is cleared and the topsoil is removed and either stockpiled for later use or immediately 60 MINING