SlideShare una empresa de Scribd logo
1 de 8
Descargar para leer sin conexión
Quarterly Result Update

Cairn India Ltd.
 Strong performance, Positive triggers to drive future growth
  Outlook                                                                                                             Recommendation (Rs)
                                                                                                                      CMP                         346
  Current macro- economic situation favours our bullish stance on crude oil, Cairn India post the completion of       Rating                      BUY
  Cairn Vedanta deal seems the best candidate in the Indian E&P story to benefit from it. With reducing light-
  heavy spreads and strong petroleum product prices, the realizations for the Cairn crude have jumped and are at      Index Details
  8.3% discount to the Brent compared to 10-15% previously. In light of current oil embargo, refinery shutdowns       Sensex                     17,077
  across the globe, we expect the spreads to remain at current levels thus benefiting Cairn India.                    Nifty                       5,158
                                                                                                                      Industry                   E&P
  Further, with Bhagyam field commencing production and Aishwarya slated to commence production in H2CY12 ,
  we expect Cairn volumes to spurt up. In addition the company commitment to ramp up production to 2,40,000           Scrip Details
  bopd by FY13 further enhances the value proposition. However, Cairn has outperformed the Nifty index by 20.4%       Mkt Cap (Rs cr)            65,803
  in the past 3 months, thus we expect the stock move side-ways in the near term. However, we reaffirm our bullish    Eq Shares O/s (Cr)          190
  stance on Cairn with a revised price objective of Rs 415. At a CMP of Rs. 346, the stock is trading at a ~19.9%     Avg Vol (Lakhs)              2.1
  discount to its net asset value at an average Brent oil price of $108 per barrel.                                   52 Week H/L               372/250
                                                                                                                      Dividend Yield (%)            0
  Key Takeaways                                                                                                       Face Value (Rs)              10
      Forex gain to the tune of Rs 301.5 crore and lower effective tax rate helped Cairn India (Cairn) post 12.5 %
                                                                                                                      Latest shareholding pattern (%)
      yoy growth in net profit to Rs.2261.9 crore v/s Rs 2010.1 crore reported in the previous corresponding
      quarter. The net revenues reported for the quarter post profit petroleum and royalty expense stood flat at Rs   Promoters                     59
                                                                                                                      Indian Institutions            6
      3096.8 crore on qoq basis but rose significantly by 16.8% on a yoy basis.
                                                                                                                      FII’s                          6
                                                                                                                      Public                         8
      During the quarter, Mangala Field continued to produce at the current rate of 1,25,000 bopd, with the           Total                        100
      management continuing to pursue higher offtake of 1,50,000 bopd. However, with light- heavy differentials
      narrowing to $ 3.23 / bbl due to weak Naphtha cracks (- $ 9.9/bbl) and strong fuel oils, the company’s crude    Stock performance (%)
      realisation jumped to $100.3/bbl for RJ crude, a discount of 8.3% to Brent v/s average discount of 10-15% to                  1m    3m       6m
      Brent.                                                                                                          Cairn        11.4 21.0       8.3
                                                                                                                      Nifty         8.8   0.6      -8.9
      Bhagyam field commenced production in January 2012. The present reservoir and facilities will help the          BSE – Oil     4.4  -5.9      -9.9
      company gradual ramp to currently approved plateau rate of 40,000 bopd by March end. The company plans
      to exit FY12, with RJ field producing at the rate of 1,75,000 bopd. Development work is on progress for the
      Aishwarya Field with the company expecting to start producing by H2CY12. Management seems to be


                                                                                                                                           th
                                                                                                                            Wednesday, 25 Jan, 2012
                  .
Quarterly Result Update

    committed to ramp the production from the MBA fields to 2,40,000 bopd by 2013. EOR activities at the MBA
    field continues to progress at an expected rate with encouraging results. However, with the current pipeline
    capacity of 175,000 bopd, the company would require further investments or would have to rationalize
    production.

    Exploration charge for the quarter was at Rs 176.3 crore, much higher than Rs 38.9 crore reported in
    previous quarter majorly on account of plugged and abandoned well in Sri Lanka. Resultantly, EBITDA (Excl.
    OI) for the quarter stood at Rs 2369.2 crore v/s Rs 2541.8 crore, down by 6.8% yoy. However, other income
    of Rs 112.4 crore and foreign exchange gain on account of depreciating rupee (Rs 53.21) at Rs 301.5 crore
    helped the company post better profits. Lower interest and effective tax rate further helped uplift profit
    numbers.

    Cairn has guided for $1.0 - $1.25 billion for FY13 which would cover majority of investments including
    investments pertaining to ramp up of production in the MBA field, pipeline capacity expansion, investments in
    Barmer field, other satellite fields in RJ Block, EOR as well as exploratory activities in other blocks. Cairn
    India has commenced exploratory activities in 3 blocks in KG D6 Basin. Cairn Lanka has completed the first
    phase of the exploration campaign in Sri Lanka and are planning to enter the second phase. Net Cash at the
    end of the quarter stood at Rs 6460.2 crore, slightly lower on the back payment of debentures and other
    liabilities.


                                                                                                                                  th
                                                                                                                     Wednesday, 25 Jan, 2012
Quarterly Result Update

Description                   Q3FY12   Q3FY11   % Chg.   Q3FY12   Q2FY12    % Chg.   9M201112 9M201012   % Chg.
Net Sales                     3096.8   3096.4      0.0   3096.8    2652.2    16.8      9461.6  6623.5      42.9
Other operational Income         0.0      0.0      0.0      0.0       0.0     0.0         0.0     0.0       0.0
Total Oper. Income(TOI)       3096.8   3096.4      0.0   3096.8    2652.2    16.8      9461.6  6623.5      42.9
Raw Materials Cons.-              -       0.0       -        -         -       -           -      0.0        -
% to TOI                          -       0.0       -        -         -       -           -      0.0        -
Stock adj. (-)Inc / (+)Dec-    -11.4      4.9       -     -11.4        -    -207.8       -9.5   -35.2     -73.1
% to TOI                        -0.4      0.2       -      -0.4      -0.1                -0.1    -0.5        -
Net Raw Mat adj. for stock     -11.4      4.9       -     -11.4      -3.7   -207.8       -9.5   -35.2     -73.1
% to TOI                        -0.4      0.2       -      -0.4      -0.1                -0.1    -0.5        -
Other expenses                 711.7    518.2     37.3    711.7     567.3    25.4      1810.9  1289.5      40.4
% to TOI                        23.0     16.7       -      23.0      21.4                19.2    20.5        -
Contribution Net_Sales        2396.5   2573.3     -6.9   2396.5    2088.6    14.7      7659.5  5304.4      44.4
Personnel                       27.3     31.5    -13.5     27.3      23.5    16.2        69.8    80.4     -13.1
% to TOI                         0.9      1.0       -       0.9       0.9                 0.7     1.2        -
Total expenditure              727.5    554.6     31.2    727.5     587.1    23.9      1871.2  1334.7      40.2
Operating Profit              2369.2   2541.8     -6.8   2369.2    2065.1    14.7      7590.4  5288.8      43.5
% to TOI                        76.5     82.1       -      76.5      77.9                80.2    78.9        -
Non-Operating Income           413.8     34.2   1111.4    413.8     593.0   -30.2      1059.6    90.4    1071.8
Interest                        24.0     74.2    -67.7     24.0     122.8   -80.5       191.4   251.6     -23.9
Exceptional Items                0.0      0.0      0.0      0.0   -1355.2   100.0     -1354.4    64.8        -
Gross Profit                  2759.1   2501.8     10.3   2759.1    3890.5   -29.1      9813.0  5062.8      93.8
Depreciation                   378.7    287.1     31.9    378.7     314.2    20.5      1039.0   728.6      42.6
PBT before Extra-ord          2380.3   2214.7      7.5   2380.3     865.9   174.9      6063.7  4334.2      39.9
% to TOI                        76.9     71.5       -      76.9      32.7     -          64.1    65.4        -
Extraordinary Items                       0.0       -        -         -      -                   0.0        -
PBT                           2380.3   2214.7      7.5   2380.3     865.9   174.9      6063.7  4334.2      39.9
Tax Rate                         5.0      9.2    -46.2      5.0      11.9   -58.2         5.2    10.6     -51.2
Prov. for Tax                  118.4    204.6    -42.1    118.4     102.9    15.1       312.2   457.6     -31.8
% to TOI                         3.8      6.6       -       3.8       3.9     -           3.3     6.9        -
Profit after Tax              2261.9   2010.1     12.5   2261.9     763.0   196.4      5751.5  3876.6      48.4
% to TOI                        73.0     64.9       -      73.0      28.8     -          60.8    58.5        -
Minority Interest                 -        -        -        -         -      -            -      0.0        -
PAT (adj. For MI)             2261.9   2010.1     12.5   2261.9     763.0   196.4      5751.5  3876.6      48.4
Face Value                      10.0     10.0       -      10.0      10.0     -          10.0    10.0        -
Equity Share capital          1903.0   1900.7       -    1903.0    1902.6     -        1903.0  1900.7        -
EPS (Rs.)                       11.9     10.6     12.4     11.9       4.0   196.5        30.2    20.4      48.2
CEPS (Rs.)                      13.9     12.1     14.8     13.9       5.7   145.2        35.7    24.2      47.3


                                                                                                                               th
                                                                                                                  Wednesday, 25 Jan, 2012
Quarterly Result Update


                    P/E Bands                                               P/B Bands                                                                          EV/EBITDA Bands
  450                                                    700                                                       120000
  400
                                                         600                                                       100000
  350
  300                                                    500                                                        80000
  250                                                    400                                                        60000
  200
  150                                                    300                                                        40000
  100                                                    200                                                        20000
   50
                                                         100                                                            0
    0
  -50                                                     0                                                             Jan-07
                                                                                                                   -20000                                           Jan-09             Jan-11                   Jan-13
    Jan-07           Jan-09             Jan-11
                                                          Jan-07           Jan-09        Jan-11           Jan-13
        CMP    7X      8X     9X      10X        11X           CMP    1X      1.25X    1.5X       1.75X    2X                                         EV       3X          4.5X       6X       7.5X            9X


              NIFTY Comparison                                       BSE- OIL Comparison                                                                            Rating Chart
120.0                                                  120.0                                                                                 24


                                                                                                                    EXPECTED 2YR EPS CAGR%
110.0                                                  110.0
                                                                                                                                             20
100.0                                                  100.0
 90.0                                                   90.0                                                                                 16                                                   CAIRN
 80.0                                                   80.0
                                                                                                                                             12                                                   ONGC
 70.0                                                   70.0
 60.0                                                   60.0                                                                                 8                                                    RIL
 50.0                                                   50.0                                                                                 4
 40.0                                                   40.0
                                                                                                                                             0
    Jan-11 Mar-11 May-11 Jul-11 Sep-11 Nov-11              Jan-11 Mar-11 May-11 Jul-11    Sep-11 Nov-11                                           0        1           2          3        4               5         6

                     Cairn    Nifty                                         Cairn     BSE Oil                                                                               RATING SCORE


                                                                                                                                                                                                      th
                                                                                                                                                                             Wednesday, 25 Jan, 2012
Quarterly Result Update


            Price Realization & Gas Production                                        Production Profile of Rajasthan Block
    200
                                                                                Q1 FY12
    180                                                                         Q2 FY12
    160                                                                         Q3 FY12
    140                                                                         Q4 FY12
    120                                                                         Q1 FY13
                                                                                Q2 FY13


                                                                        (bdp)
    100
     80                                                                         Q3 FY13
     60                                                                         Q4 FY13
                                                                                Q1 FY14
     40
                                                                                Q2 FY14
     20
                                                                                Q3 FY14
      0
          Q2 FY11   Q3 FY11   Q4 FY11   Q1 FY12   Q2 FY12   Q3 FY12                       0        50000      100000      150000      200000    250000

          Price Realization (USD/boe)    Gas Production (Kbopd)                                   Production Profile of Rajasthan Block


                                                            Rajasthan (Block RJ-ON-90/1)
                Particulars                                             Q3 FY 12              Q3 FY11 Y-o-Y (%)          Q2 FY 12 Q-o-Q (%)
                Average daily gross operated Production (bopd)           125,122               124,861      0.2           125,251      -0.1
                Average daily working Interest (bopd)                     87,585                87,403      0.2             87676      -0.1


                                  Eastern India (Block PKGM-I- PKGM- Ravva Filed) – Krishna Godavari Block Basin
                Particulars                                             Q3 FY 12              Q3 FY11 Y-o-Y (%)          Q2 FY 12 Q-o-Q (%)
                Average daily gross operated Production (boepd)         36,567                39,434          -7          36,185            1
                Average daily oil production (bopd)                     26,254                29,667         -12          26,965           -3
                Average daily Gas production (mmscfd)                     62                    59             5            55             12
                Average daily working Interest Production (boepd)       8,228                 8,873           -7          8,142             1


                                                                                                                                                             th
                                                                                                                                                Wednesday, 25 Jan, 2012
Quarterly Result Update


                                               Western (Block CB/OS-2) – Cambay Basin
         Particulars                                               Q3 FY 12    Q3 FY11 Y-o-Y (%)   Q2 FY 12 Q-o-Q (%)
         Average daily gross operated Production (boepd)            7,890       9,988      -21      8,508          -7
         Average daily oil production (bopd)                        4,795       6,279      -24      5,390         -11
         Average daily Gas production (mmscfd)                        19          22       -17        19            -
         Average daily working Interest Production (boepd)          3,156       3,995      -21      3,403          -7


                                                     Sensitivity Analysis
                                                                       Crude Oil ($/bbl)
                                TP (Rs)         80       90      100      108        120   130     140      150
                                          43   265      299      333      360        401   435     470      504
                                          44   272      307      342      369        411   446     481      516
                                          45   279      314      350      379        422   457     493      529
                Exchange Rate


                                          46   286      322      359      388        432   468     505      541
                                          47   293      330      367      397        442   479     516      554
                                          48   300      338      376      406        452   490     528      566
                                          49   306      345      384      415        462   501     540      579
                                          50   313      353      393      425        472   512     551      591
                                          51   320      361      401      434        482   523     563      604
                                          52   327      369      410      443        492   534     575      616
                                          53   334      376      418      452        503   545     587      629


                                                                                                                                     th
                                                                                                                        Wednesday, 25 Jan, 2012
Quarterly Result Update


                                                            Financials & Projections
    Y/E March, Fig in Rs. Cr       FY 2010    FY 2011    FY 2012e FY 2013e    Y/E March, Fig in Rs. Cr            FY 2010    FY 2011    FY 2012e    FY 2013e
    Profit & Loss Statement                                                   Per Share Data (Rs)
    Net Sales                        1623.0    10277.9    13466.8   17860.9   EPS                                      5.5       33.3        57.5        60.3
    % Chg.                                       533.3       31.0      32.6   Cash EPS                                 5.6       36.5        50.8        70.1
    Total Expenditure                 988.7     2614.5     2928.5    3843.3   DPS                                      0.0        0.0         0.0         0.0
    % Chg.                                       164.4       12.0      31.2   Book Value                             178.1      211.9       269.4       329.7
    EBDITA                            634.3     7663.4    10538.3   14017.6   Capital, Liquidity, Returns Ratio
    EBDITA Margin %                    39.1       74.6       78.3      78.5   Debt / Equity (x)                        0.1        0.1         0.0         0.0
    Other Income                      407.7      128.8     1255.5     353.0   Current Ratio (x)                        1.5        2.7         4.8         5.8
    PBDIT                            1042.0     7792.2    11793.8   14370.5   ROE (%)                                  3.1       15.7        16.1        18.3
    Depreciation                       10.9      611.3     1431.6    1856.5   ROCE (%)                                 2.8       17.9        22.1        22.2
    Interest                           14.8      290.9      208.3     313.2   Dividend Yield (%)                       0.0        0.0         0.0         0.0
    Exceptional Items                                     -1355.2             Valuation Ratio (x)
    PBT                              1016.3     6890.0     8798.7   12200.8   P/E                                     62.6       10.4         6.0         5.7
    Tax Provisions                    -34.8      555.6      575.5     732.0   P/BV                                     1.9        1.6         1.3         1.0
    Reported PAT                     1051.1     6334.4     8223.3   11468.8   EV/Sales                                39.4        6.2         4.8         3.6
    PAT Margin (%)                     64.8       61.6       61.1      64.2   EV/EBIDTA                              100.9        8.4         6.1         4.6
                                                                              Efficiency Ratio (x)
    Operational Exp. / Sales (%)       26.2       14.8       15.7      15.7   Inventory (days)                        65.4       11.6        10.6         9.3
    Manpower cost / Sales (%)           6.8        1.1        0.8       0.7   Debtors (days)                          69.0       52.7        55.0        55.0
    Tax Rate (%)                       -3.4        8.1        6.5       6.0   Creditors (days)                       194.6       37.3        40.6        40.6

    Balance Sheet                                                             Cash Flow statement
    Share Capital                    1943.4     1957.4     1962.5    1962.5   Profit After Tax                      1051.1     6334.4     10933.6     11468.8
    Reserves & Surplus              31925.0    38335.8    49269.5   60738.2   Depreciation                            10.9      611.3      1431.6      1856.5
    Minority Interest & Others          0.0        0.0        0.0       0.0   Working Capital Changes               -660.5     -761.4     -1935.9      -747.2
    Total Loans                      3400.7     2678.2     1670.0    1562.4   Others                                -264.5      305.7        92.4         0.0
    Deferred Tax Liability            445.3      561.2      568.3     568.3   Operating Cash Flow                    137.0     6490.0     10521.8     12578.0
    Total Liabilities               37714.4    43532.6    53470.2   64831.4   Capital Expenditure                  -3238.1    -2835.1     -2015.4     -3128.3
    Goodwill                        25319.3    25319.3    25319.3   25319.3   Change in Investment                 -1541.1      618.0      -109.4      -120.4
    Gross Block                       222.8     6653.9     7319.3    8197.7   Cash Flow from Investing             -4779.3    -2217.1     -2124.8     -3248.7
    Less: Acc. Depreciation            95.8      730.4     2162.0    4018.5   Proceeds from equity issue               0.3        4.9         5.1         0.0
    Net Block                         127.0     5923.6     5157.3    4179.2   Inc/ Dec in Debt                      -955.7     -722.5     -1008.2      -107.7
    Capital Work in Progress         9662.9     6066.8     7416.8    9666.8   Dividend and DDT                         0.0        0.0         0.0         0.0
    Investments                      1712.4     1094.4     1203.9    1324.3   Cash Flow from Financing              -955.4     -717.6     -1003.1      -107.7
    Net Current Assets                717.6     5034.3    14371.0   24340.0   Net Change in Cash                   -5597.6     3555.3      7393.8      9221.7
    Misc Expenses                     175.2       94.3        1.9       1.9   Opening Cash Balance                  6527.1      929.4      4484.7     11885.7
    Total Assets                    37714.4    43532.6    53470.2   64831.4   Closing Cash Balance                   929.4     4484.7     11878.5     21107.3


                                                                                                                                                                th
                                                                                                                                              Wednesday, 25 Jan, 2012
Quarterly Result Update


Ventura Securities Limited

Corporate Office: C-112/116, Bldg No. 1, Kailash Industrial Complex, Park Site, Vikhroli (W), Mumbai – 400079

This report is neither an offer nor a solicitation to purchase or sell securities. The information and views expressed herein are believed to be reliable, but no
responsibility (or liability) is accepted for errors of fact or opinion. Writers and contributors may be trading in or have positions in the securities mentioned in their
articles. Neither Ventura Securities Limited nor any of the contributors accepts any liability arising out of the above information/articles. Reproduction in whole or
in part without written permission is prohibited. This report is for private circulation.


                                                                                                                                                              th
                                                                                                                                             Wednesday, 25 Jan, 2012

Más contenido relacionado

La actualidad más candente

raytheon Q4 Earnings Presentation
raytheon Q4 Earnings Presentationraytheon Q4 Earnings Presentation
raytheon Q4 Earnings Presentationfinance12
 
EQUITY RESEARCH: RESULT UPDATE LARSEN & TOUBRO LIMITED
EQUITY RESEARCH: RESULT UPDATE LARSEN & TOUBRO LIMITEDEQUITY RESEARCH: RESULT UPDATE LARSEN & TOUBRO LIMITED
EQUITY RESEARCH: RESULT UPDATE LARSEN & TOUBRO LIMITEDBMA Wealth Creators
 
raytheonQ1 Earnings Release
raytheonQ1 Earnings ReleaseraytheonQ1 Earnings Release
raytheonQ1 Earnings Releasefinance12
 
Ongc ru4 qfy2010-280510
Ongc ru4 qfy2010-280510Ongc ru4 qfy2010-280510
Ongc ru4 qfy2010-280510Angel Broking
 
Concor ru2 qfy2011-201010
Concor ru2 qfy2011-201010Concor ru2 qfy2011-201010
Concor ru2 qfy2011-201010Angel Broking
 
Cadila ru2 qfy2011-191010
Cadila ru2 qfy2011-191010Cadila ru2 qfy2011-191010
Cadila ru2 qfy2011-191010Angel Broking
 
goodrich 4Q06_Slides
goodrich  4Q06_Slidesgoodrich  4Q06_Slides
goodrich 4Q06_Slidesfinance44
 
Earnings release 1 q09 presentation
Earnings release 1 q09 presentationEarnings release 1 q09 presentation
Earnings release 1 q09 presentationBrasilEcodiesel
 
Bharat forge ru4 qfy2010-210510
Bharat forge ru4 qfy2010-210510Bharat forge ru4 qfy2010-210510
Bharat forge ru4 qfy2010-210510Angel Broking
 
Ajain Dabur 07mar05
Ajain Dabur 07mar05Ajain Dabur 07mar05
Ajain Dabur 07mar05Ginni Mehta
 
meadwestvaco 4Q07_Earnings_Slides
 meadwestvaco 4Q07_Earnings_Slides meadwestvaco 4Q07_Earnings_Slides
meadwestvaco 4Q07_Earnings_Slidesfinance33
 
advance auto parts 2004_ar
advance auto parts 2004_aradvance auto parts 2004_ar
advance auto parts 2004_arfinance48
 

La actualidad más candente (17)

raytheon Q4 Earnings Presentation
raytheon Q4 Earnings Presentationraytheon Q4 Earnings Presentation
raytheon Q4 Earnings Presentation
 
GAIL
GAILGAIL
GAIL
 
EQUITY RESEARCH: RESULT UPDATE LARSEN & TOUBRO LIMITED
EQUITY RESEARCH: RESULT UPDATE LARSEN & TOUBRO LIMITEDEQUITY RESEARCH: RESULT UPDATE LARSEN & TOUBRO LIMITED
EQUITY RESEARCH: RESULT UPDATE LARSEN & TOUBRO LIMITED
 
raytheonQ1 Earnings Release
raytheonQ1 Earnings ReleaseraytheonQ1 Earnings Release
raytheonQ1 Earnings Release
 
Ongc ru4 qfy2010-280510
Ongc ru4 qfy2010-280510Ongc ru4 qfy2010-280510
Ongc ru4 qfy2010-280510
 
Concor ru2 qfy2011-201010
Concor ru2 qfy2011-201010Concor ru2 qfy2011-201010
Concor ru2 qfy2011-201010
 
Cadila ru2 qfy2011-191010
Cadila ru2 qfy2011-191010Cadila ru2 qfy2011-191010
Cadila ru2 qfy2011-191010
 
ONGC
ONGCONGC
ONGC
 
Thermax
ThermaxThermax
Thermax
 
goodrich 4Q06_Slides
goodrich  4Q06_Slidesgoodrich  4Q06_Slides
goodrich 4Q06_Slides
 
Earnings release 1 q09 presentation
Earnings release 1 q09 presentationEarnings release 1 q09 presentation
Earnings release 1 q09 presentation
 
Bharat forge ru4 qfy2010-210510
Bharat forge ru4 qfy2010-210510Bharat forge ru4 qfy2010-210510
Bharat forge ru4 qfy2010-210510
 
AES 4Q 06
AES  4Q 06AES  4Q 06
AES 4Q 06
 
Ajain Dabur 07mar05
Ajain Dabur 07mar05Ajain Dabur 07mar05
Ajain Dabur 07mar05
 
meadwestvaco 4Q07_Earnings_Slides
 meadwestvaco 4Q07_Earnings_Slides meadwestvaco 4Q07_Earnings_Slides
meadwestvaco 4Q07_Earnings_Slides
 
advance auto parts 2004_ar
advance auto parts 2004_aradvance auto parts 2004_ar
advance auto parts 2004_ar
 
CBS Q4 06
CBS Q4 06CBS Q4 06
CBS Q4 06
 

Destacado (14)

Cerrando Capitulos
Cerrando CapitulosCerrando Capitulos
Cerrando Capitulos
 
Tata motors update
Tata motors updateTata motors update
Tata motors update
 
Grazie a Tutti CRF
Grazie a Tutti  CRFGrazie a Tutti  CRF
Grazie a Tutti CRF
 
Biebwatch: leesbevordering in het VMBO
Biebwatch: leesbevordering in het VMBOBiebwatch: leesbevordering in het VMBO
Biebwatch: leesbevordering in het VMBO
 
Hadoop java tdc 2014
Hadoop java   tdc 2014Hadoop java   tdc 2014
Hadoop java tdc 2014
 
Hadoop - TDC FLN 2013
Hadoop - TDC FLN 2013Hadoop - TDC FLN 2013
Hadoop - TDC FLN 2013
 
Vivimed labs ltd
Vivimed labs ltdVivimed labs ltd
Vivimed labs ltd
 
PanMediaNEWS_2009_23_Railvision.pdf
PanMediaNEWS_2009_23_Railvision.pdfPanMediaNEWS_2009_23_Railvision.pdf
PanMediaNEWS_2009_23_Railvision.pdf
 
Sunshine Coast Tourism Reseach Sept 2009
Sunshine Coast Tourism Reseach Sept 2009Sunshine Coast Tourism Reseach Sept 2009
Sunshine Coast Tourism Reseach Sept 2009
 
First insights cairn india ltd
First insights  cairn india ltdFirst insights  cairn india ltd
First insights cairn india ltd
 
Sunshine Coast Tourism Reseach June 2009
Sunshine Coast Tourism Reseach June 2009Sunshine Coast Tourism Reseach June 2009
Sunshine Coast Tourism Reseach June 2009
 
Ocl India - Explosive Growth Ahead
Ocl India - Explosive Growth AheadOcl India - Explosive Growth Ahead
Ocl India - Explosive Growth Ahead
 
Presentasi Pestisida 2)
Presentasi Pestisida 2)Presentasi Pestisida 2)
Presentasi Pestisida 2)
 
South Indian Bank
South Indian BankSouth Indian Bank
South Indian Bank
 

Similar a Cairn India Q3FY12 Results: Strong Performance, Outlook Remains Positive

Similar a Cairn India Q3FY12 Results: Strong Performance, Outlook Remains Positive (20)

Wockhardt ltd result update
Wockhardt ltd result updateWockhardt ltd result update
Wockhardt ltd result update
 
Gail ru4 qfy2010-18-05-10
Gail ru4 qfy2010-18-05-10Gail ru4 qfy2010-18-05-10
Gail ru4 qfy2010-18-05-10
 
RIL Result Update
RIL Result UpdateRIL Result Update
RIL Result Update
 
Cairn India
Cairn IndiaCairn India
Cairn India
 
Dishman ru4 qfy2010-310510
Dishman ru4 qfy2010-310510Dishman ru4 qfy2010-310510
Dishman ru4 qfy2010-310510
 
RIL - result Update
RIL - result UpdateRIL - result Update
RIL - result Update
 
Rallis India - RU2QFY2011
Rallis India - RU2QFY2011Rallis India - RU2QFY2011
Rallis India - RU2QFY2011
 
Hindalco
Hindalco Hindalco
Hindalco
 
Rallis Result Update
Rallis Result UpdateRallis Result Update
Rallis Result Update
 
Igl ru4 qfy2010-260510
Igl ru4 qfy2010-260510Igl ru4 qfy2010-260510
Igl ru4 qfy2010-260510
 
Concor -Result Update
Concor -Result UpdateConcor -Result Update
Concor -Result Update
 
Graphite india ru4 qfy2010-140510
Graphite india ru4 qfy2010-140510Graphite india ru4 qfy2010-140510
Graphite india ru4 qfy2010-140510
 
Hindalco Novelis
Hindalco Novelis Hindalco Novelis
Hindalco Novelis
 
Gdl result update 4 qfy2010-300410
Gdl  result update 4 qfy2010-300410Gdl  result update 4 qfy2010-300410
Gdl result update 4 qfy2010-300410
 
Reliance q12011
Reliance q12011Reliance q12011
Reliance q12011
 
Anant raj ru4 qfy2010-280510
Anant raj ru4 qfy2010-280510Anant raj ru4 qfy2010-280510
Anant raj ru4 qfy2010-280510
 
Gipcl ru4 qfy2010-260510
Gipcl ru4 qfy2010-260510Gipcl ru4 qfy2010-260510
Gipcl ru4 qfy2010-260510
 
Hindustan Zinc
Hindustan ZincHindustan Zinc
Hindustan Zinc
 
Tata motors ru4 qfy2010-280510
Tata motors  ru4 qfy2010-280510Tata motors  ru4 qfy2010-280510
Tata motors ru4 qfy2010-280510
 
Orchid chemical ru4 qfy2010-270510
Orchid chemical ru4 qfy2010-270510Orchid chemical ru4 qfy2010-270510
Orchid chemical ru4 qfy2010-270510
 

Más de Vinit Bolinjkar LION bolinjkar.vinit@gmail.com

Más de Vinit Bolinjkar LION bolinjkar.vinit@gmail.com (20)

Burger King Equity Research & Valuation Webinar Slide Deck| School of Market ...
Burger King Equity Research & Valuation Webinar Slide Deck| School of Market ...Burger King Equity Research & Valuation Webinar Slide Deck| School of Market ...
Burger King Equity Research & Valuation Webinar Slide Deck| School of Market ...
 
Varun Beverages Equity Research & Valuation | School of Market Studies Webina...
Varun Beverages Equity Research & Valuation | School of Market Studies Webina...Varun Beverages Equity Research & Valuation | School of Market Studies Webina...
Varun Beverages Equity Research & Valuation | School of Market Studies Webina...
 
Voltas Equity Research & Valuation | School of Market Studies Webinar Learnin...
Voltas Equity Research & Valuation | School of Market Studies Webinar Learnin...Voltas Equity Research & Valuation | School of Market Studies Webinar Learnin...
Voltas Equity Research & Valuation | School of Market Studies Webinar Learnin...
 
HUL Equity Research & Valuation | School of Market Studies Webinar Learning S...
HUL Equity Research & Valuation | School of Market Studies Webinar Learning S...HUL Equity Research & Valuation | School of Market Studies Webinar Learning S...
HUL Equity Research & Valuation | School of Market Studies Webinar Learning S...
 
Get LinkedIn₹ - Ask Me Anything
Get LinkedIn₹ - Ask Me AnythingGet LinkedIn₹ - Ask Me Anything
Get LinkedIn₹ - Ask Me Anything
 
#Coronavirus Important Facts We Should Know
#Coronavirus Important Facts We Should Know#Coronavirus Important Facts We Should Know
#Coronavirus Important Facts We Should Know
 
Metal Pipe Stocks - Technical Analysis (Weekly Charts)
Metal Pipe Stocks - Technical Analysis (Weekly Charts)Metal Pipe Stocks - Technical Analysis (Weekly Charts)
Metal Pipe Stocks - Technical Analysis (Weekly Charts)
 
Webinar: 10 Businesses With Superlative Moats
Webinar: 10 Businesses With Superlative MoatsWebinar: 10 Businesses With Superlative Moats
Webinar: 10 Businesses With Superlative Moats
 
Multibagger stock picking_using_8_criteria_elimination
Multibagger stock picking_using_8_criteria_eliminationMultibagger stock picking_using_8_criteria_elimination
Multibagger stock picking_using_8_criteria_elimination
 
Dematerialization: A Silent Revolution in the Indian Capital Markets
Dematerialization: A Silent Revolution in the Indian Capital MarketsDematerialization: A Silent Revolution in the Indian Capital Markets
Dematerialization: A Silent Revolution in the Indian Capital Markets
 
India Union Budget 2014-15 | A Holistic Plan of Action
India Union Budget 2014-15 | A Holistic Plan of ActionIndia Union Budget 2014-15 | A Holistic Plan of Action
India Union Budget 2014-15 | A Holistic Plan of Action
 
Technical analysis-select-commodities-april-2013
Technical analysis-select-commodities-april-2013Technical analysis-select-commodities-april-2013
Technical analysis-select-commodities-april-2013
 
India budget-2013-14
India budget-2013-14India budget-2013-14
India budget-2013-14
 
Indian_Pharma_Sector_Technical_Outlook_Dec_2012
Indian_Pharma_Sector_Technical_Outlook_Dec_2012Indian_Pharma_Sector_Technical_Outlook_Dec_2012
Indian_Pharma_Sector_Technical_Outlook_Dec_2012
 
Initiating coverage gmdc_ltd_buy_for_36_per_appreciation
Initiating coverage gmdc_ltd_buy_for_36_per_appreciationInitiating coverage gmdc_ltd_buy_for_36_per_appreciation
Initiating coverage gmdc_ltd_buy_for_36_per_appreciation
 
Divis' lab ltd
Divis' lab ltdDivis' lab ltd
Divis' lab ltd
 
Petronet lng
Petronet lngPetronet lng
Petronet lng
 
Initiating coverage Mahindra & Mahindra ltd
Initiating coverage  Mahindra & Mahindra ltdInitiating coverage  Mahindra & Mahindra ltd
Initiating coverage Mahindra & Mahindra ltd
 
Wockhardt ltd
Wockhardt ltdWockhardt ltd
Wockhardt ltd
 
Initiating coverage tata motors ltd
Initiating coverage tata motors ltdInitiating coverage tata motors ltd
Initiating coverage tata motors ltd
 

Último

Malad Call Girl in Services 9892124323 | ₹,4500 With Room Free Delivery
Malad Call Girl in Services  9892124323 | ₹,4500 With Room Free DeliveryMalad Call Girl in Services  9892124323 | ₹,4500 With Room Free Delivery
Malad Call Girl in Services 9892124323 | ₹,4500 With Room Free DeliveryPooja Nehwal
 
03_Emmanuel Ndiaye_Degroof Petercam.pptx
03_Emmanuel Ndiaye_Degroof Petercam.pptx03_Emmanuel Ndiaye_Degroof Petercam.pptx
03_Emmanuel Ndiaye_Degroof Petercam.pptxFinTech Belgium
 
Solution Manual for Principles of Corporate Finance 14th Edition by Richard B...
Solution Manual for Principles of Corporate Finance 14th Edition by Richard B...Solution Manual for Principles of Corporate Finance 14th Edition by Richard B...
Solution Manual for Principles of Corporate Finance 14th Edition by Richard B...ssifa0344
 
The Economic History of the U.S. Lecture 30.pdf
The Economic History of the U.S. Lecture 30.pdfThe Economic History of the U.S. Lecture 30.pdf
The Economic History of the U.S. Lecture 30.pdfGale Pooley
 
Independent Call Girl Number in Kurla Mumbai📲 Pooja Nehwal 9892124323 💞 Full ...
Independent Call Girl Number in Kurla Mumbai📲 Pooja Nehwal 9892124323 💞 Full ...Independent Call Girl Number in Kurla Mumbai📲 Pooja Nehwal 9892124323 💞 Full ...
Independent Call Girl Number in Kurla Mumbai📲 Pooja Nehwal 9892124323 💞 Full ...Pooja Nehwal
 
The Economic History of the U.S. Lecture 21.pdf
The Economic History of the U.S. Lecture 21.pdfThe Economic History of the U.S. Lecture 21.pdf
The Economic History of the U.S. Lecture 21.pdfGale Pooley
 
(DIYA) Bhumkar Chowk Call Girls Just Call 7001035870 [ Cash on Delivery ] Pun...
(DIYA) Bhumkar Chowk Call Girls Just Call 7001035870 [ Cash on Delivery ] Pun...(DIYA) Bhumkar Chowk Call Girls Just Call 7001035870 [ Cash on Delivery ] Pun...
(DIYA) Bhumkar Chowk Call Girls Just Call 7001035870 [ Cash on Delivery ] Pun...ranjana rawat
 
VIP Call Girls Service Dilsukhnagar Hyderabad Call +91-8250192130
VIP Call Girls Service Dilsukhnagar Hyderabad Call +91-8250192130VIP Call Girls Service Dilsukhnagar Hyderabad Call +91-8250192130
VIP Call Girls Service Dilsukhnagar Hyderabad Call +91-8250192130Suhani Kapoor
 
The Economic History of the U.S. Lecture 19.pdf
The Economic History of the U.S. Lecture 19.pdfThe Economic History of the U.S. Lecture 19.pdf
The Economic History of the U.S. Lecture 19.pdfGale Pooley
 
Dividend Policy and Dividend Decision Theories.pptx
Dividend Policy and Dividend Decision Theories.pptxDividend Policy and Dividend Decision Theories.pptx
Dividend Policy and Dividend Decision Theories.pptxanshikagoel52
 
The Economic History of the U.S. Lecture 17.pdf
The Economic History of the U.S. Lecture 17.pdfThe Economic History of the U.S. Lecture 17.pdf
The Economic History of the U.S. Lecture 17.pdfGale Pooley
 
The Economic History of the U.S. Lecture 23.pdf
The Economic History of the U.S. Lecture 23.pdfThe Economic History of the U.S. Lecture 23.pdf
The Economic History of the U.S. Lecture 23.pdfGale Pooley
 
The Economic History of the U.S. Lecture 18.pdf
The Economic History of the U.S. Lecture 18.pdfThe Economic History of the U.S. Lecture 18.pdf
The Economic History of the U.S. Lecture 18.pdfGale Pooley
 
00_Main ppt_MeetupDORA&CyberSecurity.pptx
00_Main ppt_MeetupDORA&CyberSecurity.pptx00_Main ppt_MeetupDORA&CyberSecurity.pptx
00_Main ppt_MeetupDORA&CyberSecurity.pptxFinTech Belgium
 
The Economic History of the U.S. Lecture 20.pdf
The Economic History of the U.S. Lecture 20.pdfThe Economic History of the U.S. Lecture 20.pdf
The Economic History of the U.S. Lecture 20.pdfGale Pooley
 
Best VIP Call Girls Noida Sector 18 Call Me: 8448380779
Best VIP Call Girls Noida Sector 18 Call Me: 8448380779Best VIP Call Girls Noida Sector 18 Call Me: 8448380779
Best VIP Call Girls Noida Sector 18 Call Me: 8448380779Delhi Call girls
 
Stock Market Brief Deck (Under Pressure).pdf
Stock Market Brief Deck (Under Pressure).pdfStock Market Brief Deck (Under Pressure).pdf
Stock Market Brief Deck (Under Pressure).pdfMichael Silva
 
VVIP Pune Call Girls Katraj (7001035870) Pune Escorts Nearby with Complete Sa...
VVIP Pune Call Girls Katraj (7001035870) Pune Escorts Nearby with Complete Sa...VVIP Pune Call Girls Katraj (7001035870) Pune Escorts Nearby with Complete Sa...
VVIP Pune Call Girls Katraj (7001035870) Pune Escorts Nearby with Complete Sa...Call Girls in Nagpur High Profile
 
The Economic History of the U.S. Lecture 22.pdf
The Economic History of the U.S. Lecture 22.pdfThe Economic History of the U.S. Lecture 22.pdf
The Economic History of the U.S. Lecture 22.pdfGale Pooley
 

Último (20)

Malad Call Girl in Services 9892124323 | ₹,4500 With Room Free Delivery
Malad Call Girl in Services  9892124323 | ₹,4500 With Room Free DeliveryMalad Call Girl in Services  9892124323 | ₹,4500 With Room Free Delivery
Malad Call Girl in Services 9892124323 | ₹,4500 With Room Free Delivery
 
03_Emmanuel Ndiaye_Degroof Petercam.pptx
03_Emmanuel Ndiaye_Degroof Petercam.pptx03_Emmanuel Ndiaye_Degroof Petercam.pptx
03_Emmanuel Ndiaye_Degroof Petercam.pptx
 
Solution Manual for Principles of Corporate Finance 14th Edition by Richard B...
Solution Manual for Principles of Corporate Finance 14th Edition by Richard B...Solution Manual for Principles of Corporate Finance 14th Edition by Richard B...
Solution Manual for Principles of Corporate Finance 14th Edition by Richard B...
 
The Economic History of the U.S. Lecture 30.pdf
The Economic History of the U.S. Lecture 30.pdfThe Economic History of the U.S. Lecture 30.pdf
The Economic History of the U.S. Lecture 30.pdf
 
Independent Call Girl Number in Kurla Mumbai📲 Pooja Nehwal 9892124323 💞 Full ...
Independent Call Girl Number in Kurla Mumbai📲 Pooja Nehwal 9892124323 💞 Full ...Independent Call Girl Number in Kurla Mumbai📲 Pooja Nehwal 9892124323 💞 Full ...
Independent Call Girl Number in Kurla Mumbai📲 Pooja Nehwal 9892124323 💞 Full ...
 
The Economic History of the U.S. Lecture 21.pdf
The Economic History of the U.S. Lecture 21.pdfThe Economic History of the U.S. Lecture 21.pdf
The Economic History of the U.S. Lecture 21.pdf
 
(DIYA) Bhumkar Chowk Call Girls Just Call 7001035870 [ Cash on Delivery ] Pun...
(DIYA) Bhumkar Chowk Call Girls Just Call 7001035870 [ Cash on Delivery ] Pun...(DIYA) Bhumkar Chowk Call Girls Just Call 7001035870 [ Cash on Delivery ] Pun...
(DIYA) Bhumkar Chowk Call Girls Just Call 7001035870 [ Cash on Delivery ] Pun...
 
VIP Call Girls Service Dilsukhnagar Hyderabad Call +91-8250192130
VIP Call Girls Service Dilsukhnagar Hyderabad Call +91-8250192130VIP Call Girls Service Dilsukhnagar Hyderabad Call +91-8250192130
VIP Call Girls Service Dilsukhnagar Hyderabad Call +91-8250192130
 
The Economic History of the U.S. Lecture 19.pdf
The Economic History of the U.S. Lecture 19.pdfThe Economic History of the U.S. Lecture 19.pdf
The Economic History of the U.S. Lecture 19.pdf
 
Dividend Policy and Dividend Decision Theories.pptx
Dividend Policy and Dividend Decision Theories.pptxDividend Policy and Dividend Decision Theories.pptx
Dividend Policy and Dividend Decision Theories.pptx
 
The Economic History of the U.S. Lecture 17.pdf
The Economic History of the U.S. Lecture 17.pdfThe Economic History of the U.S. Lecture 17.pdf
The Economic History of the U.S. Lecture 17.pdf
 
The Economic History of the U.S. Lecture 23.pdf
The Economic History of the U.S. Lecture 23.pdfThe Economic History of the U.S. Lecture 23.pdf
The Economic History of the U.S. Lecture 23.pdf
 
(Vedika) Low Rate Call Girls in Pune Call Now 8250077686 Pune Escorts 24x7
(Vedika) Low Rate Call Girls in Pune Call Now 8250077686 Pune Escorts 24x7(Vedika) Low Rate Call Girls in Pune Call Now 8250077686 Pune Escorts 24x7
(Vedika) Low Rate Call Girls in Pune Call Now 8250077686 Pune Escorts 24x7
 
The Economic History of the U.S. Lecture 18.pdf
The Economic History of the U.S. Lecture 18.pdfThe Economic History of the U.S. Lecture 18.pdf
The Economic History of the U.S. Lecture 18.pdf
 
00_Main ppt_MeetupDORA&CyberSecurity.pptx
00_Main ppt_MeetupDORA&CyberSecurity.pptx00_Main ppt_MeetupDORA&CyberSecurity.pptx
00_Main ppt_MeetupDORA&CyberSecurity.pptx
 
The Economic History of the U.S. Lecture 20.pdf
The Economic History of the U.S. Lecture 20.pdfThe Economic History of the U.S. Lecture 20.pdf
The Economic History of the U.S. Lecture 20.pdf
 
Best VIP Call Girls Noida Sector 18 Call Me: 8448380779
Best VIP Call Girls Noida Sector 18 Call Me: 8448380779Best VIP Call Girls Noida Sector 18 Call Me: 8448380779
Best VIP Call Girls Noida Sector 18 Call Me: 8448380779
 
Stock Market Brief Deck (Under Pressure).pdf
Stock Market Brief Deck (Under Pressure).pdfStock Market Brief Deck (Under Pressure).pdf
Stock Market Brief Deck (Under Pressure).pdf
 
VVIP Pune Call Girls Katraj (7001035870) Pune Escorts Nearby with Complete Sa...
VVIP Pune Call Girls Katraj (7001035870) Pune Escorts Nearby with Complete Sa...VVIP Pune Call Girls Katraj (7001035870) Pune Escorts Nearby with Complete Sa...
VVIP Pune Call Girls Katraj (7001035870) Pune Escorts Nearby with Complete Sa...
 
The Economic History of the U.S. Lecture 22.pdf
The Economic History of the U.S. Lecture 22.pdfThe Economic History of the U.S. Lecture 22.pdf
The Economic History of the U.S. Lecture 22.pdf
 

Cairn India Q3FY12 Results: Strong Performance, Outlook Remains Positive

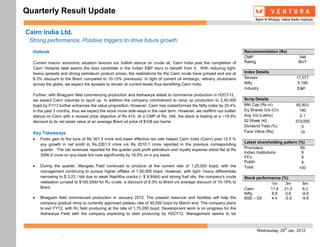
  • 1. Quarterly Result Update Cairn India Ltd. Strong performance, Positive triggers to drive future growth Outlook Recommendation (Rs) CMP 346 Current macro- economic situation favours our bullish stance on crude oil, Cairn India post the completion of Rating BUY Cairn Vedanta deal seems the best candidate in the Indian E&P story to benefit from it. With reducing light- heavy spreads and strong petroleum product prices, the realizations for the Cairn crude have jumped and are at Index Details 8.3% discount to the Brent compared to 10-15% previously. In light of current oil embargo, refinery shutdowns Sensex 17,077 across the globe, we expect the spreads to remain at current levels thus benefiting Cairn India. Nifty 5,158 Industry E&P Further, with Bhagyam field commencing production and Aishwarya slated to commence production in H2CY12 , we expect Cairn volumes to spurt up. In addition the company commitment to ramp up production to 2,40,000 Scrip Details bopd by FY13 further enhances the value proposition. However, Cairn has outperformed the Nifty index by 20.4% Mkt Cap (Rs cr) 65,803 in the past 3 months, thus we expect the stock move side-ways in the near term. However, we reaffirm our bullish Eq Shares O/s (Cr) 190 stance on Cairn with a revised price objective of Rs 415. At a CMP of Rs. 346, the stock is trading at a ~19.9% Avg Vol (Lakhs) 2.1 discount to its net asset value at an average Brent oil price of $108 per barrel. 52 Week H/L 372/250 Dividend Yield (%) 0 Key Takeaways Face Value (Rs) 10 Forex gain to the tune of Rs 301.5 crore and lower effective tax rate helped Cairn India (Cairn) post 12.5 % Latest shareholding pattern (%) yoy growth in net profit to Rs.2261.9 crore v/s Rs 2010.1 crore reported in the previous corresponding quarter. The net revenues reported for the quarter post profit petroleum and royalty expense stood flat at Rs Promoters 59 Indian Institutions 6 3096.8 crore on qoq basis but rose significantly by 16.8% on a yoy basis. FII’s 6 Public 8 During the quarter, Mangala Field continued to produce at the current rate of 1,25,000 bopd, with the Total 100 management continuing to pursue higher offtake of 1,50,000 bopd. However, with light- heavy differentials narrowing to $ 3.23 / bbl due to weak Naphtha cracks (- $ 9.9/bbl) and strong fuel oils, the company’s crude Stock performance (%) realisation jumped to $100.3/bbl for RJ crude, a discount of 8.3% to Brent v/s average discount of 10-15% to 1m 3m 6m Brent. Cairn 11.4 21.0 8.3 Nifty 8.8 0.6 -8.9 Bhagyam field commenced production in January 2012. The present reservoir and facilities will help the BSE – Oil 4.4 -5.9 -9.9 company gradual ramp to currently approved plateau rate of 40,000 bopd by March end. The company plans to exit FY12, with RJ field producing at the rate of 1,75,000 bopd. Development work is on progress for the Aishwarya Field with the company expecting to start producing by H2CY12. Management seems to be th Wednesday, 25 Jan, 2012 .
  • 2. Quarterly Result Update committed to ramp the production from the MBA fields to 2,40,000 bopd by 2013. EOR activities at the MBA field continues to progress at an expected rate with encouraging results. However, with the current pipeline capacity of 175,000 bopd, the company would require further investments or would have to rationalize production. Exploration charge for the quarter was at Rs 176.3 crore, much higher than Rs 38.9 crore reported in previous quarter majorly on account of plugged and abandoned well in Sri Lanka. Resultantly, EBITDA (Excl. OI) for the quarter stood at Rs 2369.2 crore v/s Rs 2541.8 crore, down by 6.8% yoy. However, other income of Rs 112.4 crore and foreign exchange gain on account of depreciating rupee (Rs 53.21) at Rs 301.5 crore helped the company post better profits. Lower interest and effective tax rate further helped uplift profit numbers. Cairn has guided for $1.0 - $1.25 billion for FY13 which would cover majority of investments including investments pertaining to ramp up of production in the MBA field, pipeline capacity expansion, investments in Barmer field, other satellite fields in RJ Block, EOR as well as exploratory activities in other blocks. Cairn India has commenced exploratory activities in 3 blocks in KG D6 Basin. Cairn Lanka has completed the first phase of the exploration campaign in Sri Lanka and are planning to enter the second phase. Net Cash at the end of the quarter stood at Rs 6460.2 crore, slightly lower on the back payment of debentures and other liabilities. th Wednesday, 25 Jan, 2012
  • 3. Quarterly Result Update Description Q3FY12 Q3FY11 % Chg. Q3FY12 Q2FY12 % Chg. 9M201112 9M201012 % Chg. Net Sales 3096.8 3096.4 0.0 3096.8 2652.2 16.8 9461.6 6623.5 42.9 Other operational Income 0.0 0.0 0.0 0.0 0.0 0.0 0.0 0.0 0.0 Total Oper. Income(TOI) 3096.8 3096.4 0.0 3096.8 2652.2 16.8 9461.6 6623.5 42.9 Raw Materials Cons.- - 0.0 - - - - - 0.0 - % to TOI - 0.0 - - - - - 0.0 - Stock adj. (-)Inc / (+)Dec- -11.4 4.9 - -11.4 - -207.8 -9.5 -35.2 -73.1 % to TOI -0.4 0.2 - -0.4 -0.1 -0.1 -0.5 - Net Raw Mat adj. for stock -11.4 4.9 - -11.4 -3.7 -207.8 -9.5 -35.2 -73.1 % to TOI -0.4 0.2 - -0.4 -0.1 -0.1 -0.5 - Other expenses 711.7 518.2 37.3 711.7 567.3 25.4 1810.9 1289.5 40.4 % to TOI 23.0 16.7 - 23.0 21.4 19.2 20.5 - Contribution Net_Sales 2396.5 2573.3 -6.9 2396.5 2088.6 14.7 7659.5 5304.4 44.4 Personnel 27.3 31.5 -13.5 27.3 23.5 16.2 69.8 80.4 -13.1 % to TOI 0.9 1.0 - 0.9 0.9 0.7 1.2 - Total expenditure 727.5 554.6 31.2 727.5 587.1 23.9 1871.2 1334.7 40.2 Operating Profit 2369.2 2541.8 -6.8 2369.2 2065.1 14.7 7590.4 5288.8 43.5 % to TOI 76.5 82.1 - 76.5 77.9 80.2 78.9 - Non-Operating Income 413.8 34.2 1111.4 413.8 593.0 -30.2 1059.6 90.4 1071.8 Interest 24.0 74.2 -67.7 24.0 122.8 -80.5 191.4 251.6 -23.9 Exceptional Items 0.0 0.0 0.0 0.0 -1355.2 100.0 -1354.4 64.8 - Gross Profit 2759.1 2501.8 10.3 2759.1 3890.5 -29.1 9813.0 5062.8 93.8 Depreciation 378.7 287.1 31.9 378.7 314.2 20.5 1039.0 728.6 42.6 PBT before Extra-ord 2380.3 2214.7 7.5 2380.3 865.9 174.9 6063.7 4334.2 39.9 % to TOI 76.9 71.5 - 76.9 32.7 - 64.1 65.4 - Extraordinary Items 0.0 - - - - 0.0 - PBT 2380.3 2214.7 7.5 2380.3 865.9 174.9 6063.7 4334.2 39.9 Tax Rate 5.0 9.2 -46.2 5.0 11.9 -58.2 5.2 10.6 -51.2 Prov. for Tax 118.4 204.6 -42.1 118.4 102.9 15.1 312.2 457.6 -31.8 % to TOI 3.8 6.6 - 3.8 3.9 - 3.3 6.9 - Profit after Tax 2261.9 2010.1 12.5 2261.9 763.0 196.4 5751.5 3876.6 48.4 % to TOI 73.0 64.9 - 73.0 28.8 - 60.8 58.5 - Minority Interest - - - - - - - 0.0 - PAT (adj. For MI) 2261.9 2010.1 12.5 2261.9 763.0 196.4 5751.5 3876.6 48.4 Face Value 10.0 10.0 - 10.0 10.0 - 10.0 10.0 - Equity Share capital 1903.0 1900.7 - 1903.0 1902.6 - 1903.0 1900.7 - EPS (Rs.) 11.9 10.6 12.4 11.9 4.0 196.5 30.2 20.4 48.2 CEPS (Rs.) 13.9 12.1 14.8 13.9 5.7 145.2 35.7 24.2 47.3 th Wednesday, 25 Jan, 2012
  • 4. Quarterly Result Update P/E Bands P/B Bands EV/EBITDA Bands 450 700 120000 400 600 100000 350 300 500 80000 250 400 60000 200 150 300 40000 100 200 20000 50 100 0 0 -50 0 Jan-07 -20000 Jan-09 Jan-11 Jan-13 Jan-07 Jan-09 Jan-11 Jan-07 Jan-09 Jan-11 Jan-13 CMP 7X 8X 9X 10X 11X CMP 1X 1.25X 1.5X 1.75X 2X EV 3X 4.5X 6X 7.5X 9X NIFTY Comparison BSE- OIL Comparison Rating Chart 120.0 120.0 24 EXPECTED 2YR EPS CAGR% 110.0 110.0 20 100.0 100.0 90.0 90.0 16 CAIRN 80.0 80.0 12 ONGC 70.0 70.0 60.0 60.0 8 RIL 50.0 50.0 4 40.0 40.0 0 Jan-11 Mar-11 May-11 Jul-11 Sep-11 Nov-11 Jan-11 Mar-11 May-11 Jul-11 Sep-11 Nov-11 0 1 2 3 4 5 6 Cairn Nifty Cairn BSE Oil RATING SCORE th Wednesday, 25 Jan, 2012
  • 5. Quarterly Result Update Price Realization & Gas Production Production Profile of Rajasthan Block 200 Q1 FY12 180 Q2 FY12 160 Q3 FY12 140 Q4 FY12 120 Q1 FY13 Q2 FY13 (bdp) 100 80 Q3 FY13 60 Q4 FY13 Q1 FY14 40 Q2 FY14 20 Q3 FY14 0 Q2 FY11 Q3 FY11 Q4 FY11 Q1 FY12 Q2 FY12 Q3 FY12 0 50000 100000 150000 200000 250000 Price Realization (USD/boe) Gas Production (Kbopd) Production Profile of Rajasthan Block Rajasthan (Block RJ-ON-90/1) Particulars Q3 FY 12 Q3 FY11 Y-o-Y (%) Q2 FY 12 Q-o-Q (%) Average daily gross operated Production (bopd) 125,122 124,861 0.2 125,251 -0.1 Average daily working Interest (bopd) 87,585 87,403 0.2 87676 -0.1 Eastern India (Block PKGM-I- PKGM- Ravva Filed) – Krishna Godavari Block Basin Particulars Q3 FY 12 Q3 FY11 Y-o-Y (%) Q2 FY 12 Q-o-Q (%) Average daily gross operated Production (boepd) 36,567 39,434 -7 36,185 1 Average daily oil production (bopd) 26,254 29,667 -12 26,965 -3 Average daily Gas production (mmscfd) 62 59 5 55 12 Average daily working Interest Production (boepd) 8,228 8,873 -7 8,142 1 th Wednesday, 25 Jan, 2012
  • 6. Quarterly Result Update Western (Block CB/OS-2) – Cambay Basin Particulars Q3 FY 12 Q3 FY11 Y-o-Y (%) Q2 FY 12 Q-o-Q (%) Average daily gross operated Production (boepd) 7,890 9,988 -21 8,508 -7 Average daily oil production (bopd) 4,795 6,279 -24 5,390 -11 Average daily Gas production (mmscfd) 19 22 -17 19 - Average daily working Interest Production (boepd) 3,156 3,995 -21 3,403 -7 Sensitivity Analysis Crude Oil ($/bbl) TP (Rs) 80 90 100 108 120 130 140 150 43 265 299 333 360 401 435 470 504 44 272 307 342 369 411 446 481 516 45 279 314 350 379 422 457 493 529 Exchange Rate 46 286 322 359 388 432 468 505 541 47 293 330 367 397 442 479 516 554 48 300 338 376 406 452 490 528 566 49 306 345 384 415 462 501 540 579 50 313 353 393 425 472 512 551 591 51 320 361 401 434 482 523 563 604 52 327 369 410 443 492 534 575 616 53 334 376 418 452 503 545 587 629 th Wednesday, 25 Jan, 2012
  • 7. Quarterly Result Update Financials & Projections Y/E March, Fig in Rs. Cr FY 2010 FY 2011 FY 2012e FY 2013e Y/E March, Fig in Rs. Cr FY 2010 FY 2011 FY 2012e FY 2013e Profit & Loss Statement Per Share Data (Rs) Net Sales 1623.0 10277.9 13466.8 17860.9 EPS 5.5 33.3 57.5 60.3 % Chg. 533.3 31.0 32.6 Cash EPS 5.6 36.5 50.8 70.1 Total Expenditure 988.7 2614.5 2928.5 3843.3 DPS 0.0 0.0 0.0 0.0 % Chg. 164.4 12.0 31.2 Book Value 178.1 211.9 269.4 329.7 EBDITA 634.3 7663.4 10538.3 14017.6 Capital, Liquidity, Returns Ratio EBDITA Margin % 39.1 74.6 78.3 78.5 Debt / Equity (x) 0.1 0.1 0.0 0.0 Other Income 407.7 128.8 1255.5 353.0 Current Ratio (x) 1.5 2.7 4.8 5.8 PBDIT 1042.0 7792.2 11793.8 14370.5 ROE (%) 3.1 15.7 16.1 18.3 Depreciation 10.9 611.3 1431.6 1856.5 ROCE (%) 2.8 17.9 22.1 22.2 Interest 14.8 290.9 208.3 313.2 Dividend Yield (%) 0.0 0.0 0.0 0.0 Exceptional Items -1355.2 Valuation Ratio (x) PBT 1016.3 6890.0 8798.7 12200.8 P/E 62.6 10.4 6.0 5.7 Tax Provisions -34.8 555.6 575.5 732.0 P/BV 1.9 1.6 1.3 1.0 Reported PAT 1051.1 6334.4 8223.3 11468.8 EV/Sales 39.4 6.2 4.8 3.6 PAT Margin (%) 64.8 61.6 61.1 64.2 EV/EBIDTA 100.9 8.4 6.1 4.6 Efficiency Ratio (x) Operational Exp. / Sales (%) 26.2 14.8 15.7 15.7 Inventory (days) 65.4 11.6 10.6 9.3 Manpower cost / Sales (%) 6.8 1.1 0.8 0.7 Debtors (days) 69.0 52.7 55.0 55.0 Tax Rate (%) -3.4 8.1 6.5 6.0 Creditors (days) 194.6 37.3 40.6 40.6 Balance Sheet Cash Flow statement Share Capital 1943.4 1957.4 1962.5 1962.5 Profit After Tax 1051.1 6334.4 10933.6 11468.8 Reserves & Surplus 31925.0 38335.8 49269.5 60738.2 Depreciation 10.9 611.3 1431.6 1856.5 Minority Interest & Others 0.0 0.0 0.0 0.0 Working Capital Changes -660.5 -761.4 -1935.9 -747.2 Total Loans 3400.7 2678.2 1670.0 1562.4 Others -264.5 305.7 92.4 0.0 Deferred Tax Liability 445.3 561.2 568.3 568.3 Operating Cash Flow 137.0 6490.0 10521.8 12578.0 Total Liabilities 37714.4 43532.6 53470.2 64831.4 Capital Expenditure -3238.1 -2835.1 -2015.4 -3128.3 Goodwill 25319.3 25319.3 25319.3 25319.3 Change in Investment -1541.1 618.0 -109.4 -120.4 Gross Block 222.8 6653.9 7319.3 8197.7 Cash Flow from Investing -4779.3 -2217.1 -2124.8 -3248.7 Less: Acc. Depreciation 95.8 730.4 2162.0 4018.5 Proceeds from equity issue 0.3 4.9 5.1 0.0 Net Block 127.0 5923.6 5157.3 4179.2 Inc/ Dec in Debt -955.7 -722.5 -1008.2 -107.7 Capital Work in Progress 9662.9 6066.8 7416.8 9666.8 Dividend and DDT 0.0 0.0 0.0 0.0 Investments 1712.4 1094.4 1203.9 1324.3 Cash Flow from Financing -955.4 -717.6 -1003.1 -107.7 Net Current Assets 717.6 5034.3 14371.0 24340.0 Net Change in Cash -5597.6 3555.3 7393.8 9221.7 Misc Expenses 175.2 94.3 1.9 1.9 Opening Cash Balance 6527.1 929.4 4484.7 11885.7 Total Assets 37714.4 43532.6 53470.2 64831.4 Closing Cash Balance 929.4 4484.7 11878.5 21107.3 th Wednesday, 25 Jan, 2012
  • 8. Quarterly Result Update Ventura Securities Limited Corporate Office: C-112/116, Bldg No. 1, Kailash Industrial Complex, Park Site, Vikhroli (W), Mumbai – 400079 This report is neither an offer nor a solicitation to purchase or sell securities. The information and views expressed herein are believed to be reliable, but no responsibility (or liability) is accepted for errors of fact or opinion. Writers and contributors may be trading in or have positions in the securities mentioned in their articles. Neither Ventura Securities Limited nor any of the contributors accepts any liability arising out of the above information/articles. Reproduction in whole or in part without written permission is prohibited. This report is for private circulation. th Wednesday, 25 Jan, 2012