Equity Research Shows Strong Mar Media Adex Unsustainable
•
1 recomendación•399 vistas

This document provides a sector update and analysis of the media industry in Malaysia. Some key points: 1) Advertising expenditure (adex) in March 2009 contracted only 1% year-over-year, a much better showing than previous months, driven by a 13% increase in TV adex. 2) However, the analyst maintains a cautious outlook due to difficult year-over-year comparisons and lack of major events in 2009 that boosted adex in 2008. 3) The analyst downgrades their recommendation on Media Prima and Star to Sell, as their share prices have risen ahead of underlying fundamentals in the weak economy. The media sector outlook is downgraded to Underweight.

Recomendados
Más contenido relacionado
La actualidad más candente
La actualidad más candente (19)
Destacado
Similar a Equity Research Shows Strong Mar Media Adex Unsustainable
Similar a Equity Research Shows Strong Mar Media Adex Unsustainable (20)
Más de Boyboy cute
Más de Boyboy cute (20)
Último
Último (20)
Equity Research Shows Strong Mar Media Adex Unsustainable
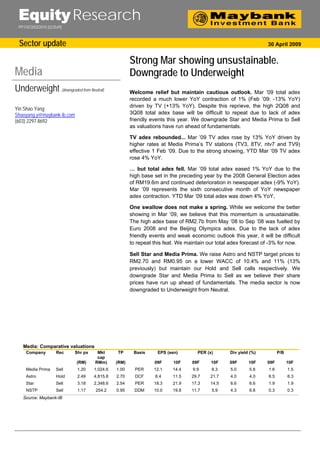
- 1. Equity Research PP11072/03/2010 (023549) Sector update 30 April 2009 Strong Mar showing unsustainable. Media Downgrade to Underweight Underweight (downgraded from Neutral) Welcome relief but maintain cautious outlook. Mar ’09 total adex recorded a much lower YoY contraction of 1% (Feb ’09: -13% YoY) driven by TV (+13% YoY). Despite this reprieve, the high 2Q08 and Yin Shao Yang 3Q08 total adex base will be difficult to repeat due to lack of adex Shaoyang.y@maybank-ib.com friendly events this year. We downgrade Star and Media Prima to Sell (603) 2297 8692 as valuations have run ahead of fundamentals. TV adex rebounded... Mar ’09 TV adex rose by 13% YoY driven by higher rates at Media Prima’s TV stations (TV3, 8TV, ntv7 and TV9) effective 1 Feb ‘09. Due to the strong showing, YTD Mar ’09 TV adex rose 4% YoY. … but total adex fell. Mar ’09 total adex eased 1% YoY due to the high base set in the preceding year by the 2008 General Election adex of RM19.6m and continued deterioration in newspaper adex (-9% YoY). Mar ’09 represents the sixth consecutive month of YoY newspaper adex contraction. YTD Mar ’09 total adex was down 4% YoY, One swallow does not make a spring. While we welcome the better showing in Mar ’09, we believe that this momentum is unsustainable. The high adex base of RM2.7b from May ’08 to Sep ’08 was fuelled by Euro 2008 and the Beijing Olympics adex. Due to the lack of adex friendly events and weak economic outlook this year, it will be difficult to repeat this feat. We maintain our total adex forecast of -3% for now. Sell Star and Media Prima. We raise Astro and NSTP target prices to RM2.70 and RM0.95 on a lower WACC of 10.4% and 11% (13% previously) but maintain our Hold and Sell calls respectively. We downgrade Star and Media Prima to Sell as we believe their share prices have run up ahead of fundamentals. The media sector is now downgraded to Underweight from Neutral. Media: Comparative valuations Company Rec Shr px Mkt TP Basis EPS (sen) PER (x) Div yield (%) P/B cap (RM) RMm) (RM) 09F 10F 09F 10F 09F 10F 09F 10F Media Prima Sell 1.20 1,024.6 1.00 PER 12.1 14.4 9.9 8.3 5.0 5.8 1.6 1.5 Astro Hold 2.49 4,815.8 2.70 DCF 8.4 11.5 29.7 21.7 4.0 4.0 6.5 6.3 Star Sell 3.18 2,348.6 2.54 PER 18.3 21.9 17.3 14.5 6.6 6.6 1.9 1.9 NSTP Sell 1.17 254.2 0.95 DDM 10.0 19.8 11.7 5.9 4.3 6.8 0.3 0.3 Source: Maybank-IB
- 2. Media Details of Mar ’09 adex Adex YoY change Television Newspapers Total adex 60.0% 50.0% 40.0% 30.0% 20.0% 10.0% 0.0% Nov-08 Dec-08 Oct-08 Jan-08 Jun-08 Jan-09 May-08 Feb-08 Mar-08 Feb-09 Mar-09 Jul-08 Apr-08 Aug-08 Sep-08 -10.0% -20.0% Source: Nielsen Media Research Table 1: Mar ’09 adex (RMm) Mar-09 Mar-08 YoY chg Feb-09 MoM chg Television 164.8 146.4 12.5% 121.7 35.3% Newspapers 264.7 292.0 -9.4% 207.6 27.5% Magazines 10.7 12.9 -16.9% 9.0 19.2% Radio 25.3 20.7 21.9% 16.9 49.8% Cinema 1.1 1.0 9.5% 1.3 -10.9% Outdoor 8.0 8.2 -2.9% 8.0 0.6% Point Of Sale 6.5 6.3 3.5% 6.1 6.6% Internet 3.2 2.6 25.5% 2.0 62.0% Total 484.3 490.2 -1.2% 372.5 30.0% Source: Nielsen Media Research Narrower contraction. Mar ’09 total adex of RM484.3m was only 1% lower YoY but 30% higher MoM as adex sentiment recovered from the post-Chinese New Year trough in Feb ‘09. Excluding the 2008 General Election adex of RM19.6m, Mar ’09 total adex was actually 3% higher YoY. We expected Mar ’09 total adex to continue declining markedly due to the weak economic environment. TV shone but newspapers continued to fade. Mar ’09 TV adex of RM164.8m was 13% higher YoY and 35% higher MoM. We understand the outperformance was due to rate card increases at Media Prima’s TV stations. Mar ’09 newspaper adex of RM264.7m was 9% lower YoY, representing the sixth consecutive month of YoY contraction. Table 2: YTD Mar ’09 adex (RMm) YTD Mar-09 YTD Mar-08 YoY chg Television 431.6 416.0 3.7% Newspapers 731.0 802.9 -9.0% Magazines 30.2 33.5 -9.8% Radio 66.8 61.2 9.2% Cinema 5.0 5.2 -3.8% Outdoor 24.5 23.9 2.6% Point Of Sale 19.7 18.9 4.7% Internet 7.3 6.7 9.3% Total 1,316.2 1,368.2 -3.8% Source: Nielsen Media Research 30 April 2009 Page 2 of 5
- 3. Media YTD total adex down 3.8% YoY. Due to its strong showing in Mar ’09, YTD Mar ’09 TV adex of RM431.6m was 4% higher YoY. YTD Mar ’09 newspaper adex of RM731.0m was 9% lower YoY. The deterioration in newspaper adex poses earnings risk to Star and NSTP. We estimate that every 1% contraction in newspaper adex will reduce our full-year EPS estimates by 2%. Table 3: Mar ’09 top 10 advertisers (RMm) Categories Mar-09 Categories Mar-08 Categories Feb-09 Government Institutions-Local 24.2 Mobile Line Services 21.4 Government Institutions-Local 16.9 Mobile Line Services 23.5 Political Parties 19.6 Mobile Line Services 13.3 Face Care-Woman 15.3 Government Institutions-Local 14.0 Face Care-Woman 10.1 University 13.8 Face Care-Woman 10.8 Tonic & Vitamin 8.2 Fast Food Centre 11.0 University 10.2 Fast Food Centre 7.7 Hair Shampoo & Conditioner 9.0 Hair Shampoo & Conditioner 9.6 Airline 7.6 Tonic & Vitamin 8.5 Bank/Finance-Corporate 7.8 Hypermarket 7.0 Hypermarket 8.3 College/Institution 7.7 Hair Shampoo & Conditioner 6.9 Cinema Advertising 7.3 Cinema Advertising 7.7 Mobile Interactive Services 6.7 Amusement Centre 7.0 Dessert 7.0 Cinema Advertising 6.4 Top 10 total 128.0 Top 10 total 115.8 Top 10 total 90.8 % of total adex 26.4% % of total adex 23.6% % of total adex 24.4% Source: Nielsen Media Research Table 4: YTD Mar ’09 top 10 advertisers (continued) (RMm) Categories YTD Categories YTD Mar-09 Mar-08 Mobile Line Services 58.1 Mobile Line Services 63.6 Government Institutions-Local 55.9 Government Institutions-Local 54.3 Absent in 2009 – the 2008 Face Care-Woman 37.0 Political Parties 30.8 General Elections effect Hypermarket 30.4 Face Care-Woman 29.5 Fast Food Centre 27.5 Hair Shampoo & Conditioner 27.6 University 26.5 Residential Estate 23.7 Tonic & Vitamin 24.7 Cinema Advertising 23.0 Mobile Interactive Services 21.9 Airline 20.5 Hair Shampoo & Conditioner 20.7 Tonic & Vitamin 19.9 Cinema Advertising 20.5 University 19.8 Top 10 total 323.3 Top 10 total 312.7 % of total adex 24.6% % of total adex 22.9% Source: Nielsen Media Research Table 5: Share of total adex Mar-09 Mar-08 Feb-09 YTD Mar-09 YTD Mar-08 Markedly higher Television 34.0% 29.9% 32.7% 32.8% 30.4% Newspapers 54.7% 59.6% 55.7% 55.5% 58.7% Magazines 2.2% 2.6% 2.4% 2.3% 2.5% Radio 5.2% 4.2% 4.5% 5.1% 4.5% Cinema 0.2% 0.2% 0.3% 0.4% 0.4% Outdoor 1.7% 1.7% 2.1% 1.9% 1.7% Point Of Sale 1.3% 1.3% 1.6% 1.5% 1.4% Internet 0.7% 0.5% 0.5% 0.6% 0.5% Total 100.0% 100.0% 100.0% 100.0% 100.0% Source: Nielsen Media Research High 2Q08 and 3Q08 base difficult to repeat. While we are relieved that Mar ’09 total adex recorded a much narrower YoY contraction (Feb ’09: -13% YoY), we take the view that this momentum is unsustainable. The high adex base of RM2.7b from May ’08 to Sep ’08 was fuelled by Euro 2008 and the Beijing Olympics adex. Due to the lack of adex friendly events and weak economic prospects this year, we opine that it is difficult to repeat this feat. 30 April 2009 Page 3 of 5
- 4. Media Valuation and recommendation Upgrading Astro TP, maintain Hold. We apply a lower WACC of 10.4% to Astro (13% previously) as we lower our risk free rate assumption to 4% (5% previously; 10-year Malaysian Government Securities yield fell from 5% to 3.9% over the last year) and equity risk premium to 7.5% (8% previously), and as Astro assumes more debt. We upgrade our DCF derived target price from RM2.00 to RM2.70 as we also remove previous 20% discount to end-FY10 DCF (previously RM2.50). The risk on potential losses from its five lawsuits in Indonesia is now reflected in the relatively higher risk premium for Astro (vis-à-vis NSTP, see below); this was previously reflected as a discount to TP. Upgrading NSTP TP, maintain Sell. We apply a lower WACC of 11% to NSTP on lower risk free rate of 4% and lower equity risk premium of 6.5% (previously 13%, 5% and 8% respectively)). Although we understand that 1Q09 will be loss making as NSTP consumes newsprint purchased in 4Q08 at above USD900/t, earnings will likely recover going forward on lower newsprint prices. We upgrade our NSTP TP based on dividend discount model from RM0.82 to RM0.95. Table 6: Astro & NSTP – WACC assumptions Astro NSTP New Old New Old Risk free rate 4.0% 5.0% 4.0% 5.0% Market risk premium 7.5% 8.0% 6.5% 8.0% Beta 1.1 1.0 1.1 1.0 Cost of equity 12.3% 13.0% 11.0% 13.0% Cost of debt 4.5% n.a. n.a. n.a. Target Debt-to-Capital 25% 0% 0% 0% Target Equity-to-Capital 75% 100% 100% 100% WACC 10.4% 13.0% 11.0% 13.0% Source: Maybank-IB Star’s valuations expensive, downgrade to Sell. According to Nielsen Media Research, Star’s YTD Mar ’09 adex contraction has been severe (>20% YoY) and valuations remain rich at 17x 2009 PER. As we factored only 3% adex contraction in 2009, we expect 1Q09 results to disappoint. If earnings continue to weaken, dividends (2008: 21sen) will likely disappoint as well. We downgrade Star from Fully Valued to Sell. RM2.54 TP unchanged on 10x 2010 PER ex-cash. Primedia-ABC5 concerns overhang at Media Prima, downgrade to Sell. We are concerned that the RM5m per month expense to support its Philippine investment Primedia-ABC5 (until it is disposed to a media fund) will impair its ability to pay dividends and pare debt. Media Prima is trading at par to the regional average of 8x 2010 PER but we believe it should trade at a discount as it has yet to dispose Primedia-ABC5 to the media fund after more than a year. We ascribe 7x 2010 PER (6x previously) or 1x discount to regional average and arrive at RM1.00 target price (RM0.86 previously). Downgrade from Fully Valued to Sell. Media Prima: Peer comparison Company Country CY09 PER CY10 PER ABS-CBN Broadcasting Philippines 10.3 10.7 BEC World Thailand 13.4 12.6 GMA Network Philippines 8.6 7.8 Media Nusantara Citra Indonesia 3.9 4.2 Surya Citra Media Indonesia 5.5 6.6 Average 8.3 8.4 Media Prima Malaysia 9.9 8.3 Source: Bloomberg 30 April 2009 Page 4 of 5
- 5. Media Definition of Ratings Maybank Investment Bank Research uses the following rating system: STRONG BUY Total return is expected to exceed 20% in the next 12 months; high conviction call BUY Total return is expected to be above 10% in the next 12 months HOLD Total return is expected to be between above 0% to 10% in the next 12 months FULLY VALUED Total return is expected to be between -10% and 0% in the next 12 months SELL Total return is expected to be below -10% in the next 12 months TRADING BUY Total return is expected to be between 10-20% in the next 6 months arising from positive newsflow e.g. mergers and acquisition, corporate restructuring, and potential of obtaining new projects. However, the upside may or may not be sustainable Applicability of Ratings The respective analyst maintains a coverage universe of stocks, the list of which may be adjusted according to needs. Investment ratings are only applicable to the stocks which form part of the coverage universe. Reports on companies which are not part of the coverage do not carry investment ratings as we do not actively follow developments in these companies. Some common terms abbreviated in this report (where they appear): Adex = Advertising Expenditure FCF = Free Cashflow PE = Price Earnings BV = Book Value FV = Fair Value PEG = PE Ratio To Growth CAGR = Compounded Annual Growth Rate FY = Financial Year PER = PE Ratio Capex = Capital Expenditure FYE = Financial Year End QoQ = Quarter-On-Quarter CY = Calendar Year MoM = Month-On-Month ROA = Return On Asset DCF = Discounted Cashflow NAV = Net Asset Value ROE = Return On Equity DPS = Dividend Per Share NTA = Net Tangible Asset ROSF = Return On Shareholders’ Funds EBIT = Earnings Before Interest And Tax P = Price WACC = Weighted Average Cost Of Capital EBITDA = EBIT, Depreciation And Amortisation P.A. = Per Annum YoY = Year-On-Year EPS = Earnings Per Share PAT = Profit After Tax YTD = Year-To-Date EV = Enterprise Value PBT = Profit Before Tax Disclaimer This report is for information purposes only and under no circumstances is it to be considered or intended as an offer to sell or a solicitation of an offer to buy the securities referred to herein. Investors should note that income from such securities, if any, may fluctuate and that each security’s price or value may rise or fall. Opinions or recommendations contained herein are in form of technical ratings and fundamental ratings. Technical ratings may differ from fundamental ratings as technical valuations apply different methodologies and are purely based on price and volume-related information extracted from Bursa Malaysia Securities Berhad in the equity analysis. Accordingly, investors may receive back less than originally invested. Past performance is not necessarily a guide to future performance. This report is not intended to provide personal investment advice and does not take into account the specific investment objectives, the financial situation and the particular needs of persons who may receive or read this report. Investors should therefore seek financial, legal and other advice regarding the appropriateness of investing in any securities or the investment strategies discussed or recommended in this report. The information contained herein has been obtained from sources believed to be reliable but such sources have not been independently verified by Maybank Investment Bank Bhd and consequently no representation is made as to the accuracy or completeness of this report by Maybank Investment Bank Bhd and it should not be relied upon as such. Accordingly, no liability can be accepted for any direct, indirect or consequential losses or damages that may arise from the use or reliance of this report. Maybank Investment Bank Bhd, its affiliates and related companies and their officers, directors, associates, connected parties and/or employees may from time to time have positions or be materially interested in the securities referred to herein and may further act as market maker or may have assumed an underwriting commitment or deal with such securities and may also perform or seek to perform investment banking services, advisory and other services for or relating to those companies. Any information, opinions or recommendations contained herein are subject to change at any time, without prior notice. This report may contain forward looking statements which are often but not always identified by the use of words such as “anticipate”, “believe”, “estimate”, “intend”, “plan”, “expect”, “forecast”, “predict” and “project” and statements that an event or result “may”, “will”, “can”, “should”, “could” or “might” occur or be achieved and other similar expressions. Such forward looking statements are based on assumptions made and information currently available to us and are subject to certain risks and uncertainties that could cause the actual results to differ materially from those expressed in any forward looking statements. Readers are cautioned not to place undue relevance on these forward- looking statements. Maybank Investment Bank Bhd expressly disclaims any obligation to update or revise any such forward looking statements to reflect new information, events or circumstances after the date of this publication or to reflect the occurrence of unanticipated events. This report is prepared for the use of Maybank Investment Bank Bhd's clients and may not be reproduced, altered in any way, transmitted to, copied or distributed to any other party in whole or in part in any form or manner without the prior express written consent of Maybank Investment Bank Bhd and Maybank Investment Bank Bhd accepts no liability whatsoever for the actions of third parties in this respect. This report is not directed to or intended for distribution to or use by any person or entity who is a citizen or resident of or located in any locality, state, country or other jurisdiction where such distribution, publication, availability or use would be contrary to law or regulation. Published / Printed by Maybank Investment Bank Berhad (15938-H) (Formerly known as Aseambankers Malaysia Berhad) (A Participating Organisation of Bursa Malaysia Securities Berhad) 33rd Floor, Menara Maybank, 100 Jalan Tun Perak, 50050 Kuala Lumpur Tel: (603) 2059 1888; Fax: (603) 2078 4194 Stockbroking Business: Level 8, MaybanLife Tower, Dataran Maybank, No.1, Jalan Maarof 59000 Kuala Lumpur Tel: (603) 2297 8888; Fax: (603) 2282 5136 http://www.maybank-ib.com 30 April 2009 Page 5 of 5