

Recomendados
Más contenido relacionado
La actualidad más candente
La actualidad más candente (19)
Similar a Lab 1 and_2
Similar a Lab 1 and_2 (19)
Lab 1 and_2
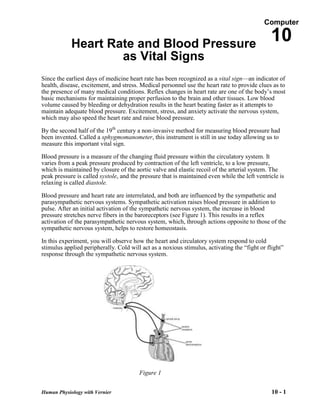
- 1. Computer Heart Rate and Blood Pressure 10 as Vital Signs Since the earliest days of medicine heart rate has been recognized as a vital sign—an indicator of health, disease, excitement, and stress. Medical personnel use the heart rate to provide clues as to the presence of many medical conditions. Reflex changes in heart rate are one of the body’s most basic mechanisms for maintaining proper perfusion to the brain and other tissues. Low blood volume caused by bleeding or dehydration results in the heart beating faster as it attempts to maintain adequate blood pressure. Excitement, stress, and anxiety activate the nervous system, which may also speed the heart rate and raise blood pressure. By the second half of the 19th century a non-invasive method for measuring blood pressure had been invented. Called a sphygmomanometer, this instrument is still in use today allowing us to measure this important vital sign. Blood pressure is a measure of the changing fluid pressure within the circulatory system. It varies from a peak pressure produced by contraction of the left ventricle, to a low pressure, which is maintained by closure of the aortic valve and elastic recoil of the arterial system. The peak pressure is called systole, and the pressure that is maintained even while the left ventricle is relaxing is called diastole. Blood pressure and heart rate are interrelated, and both are influenced by the sympathetic and parasympathetic nervous systems. Sympathetic activation raises blood pressure in addition to pulse. After an initial activation of the sympathetic nervous system, the increase in blood pressure stretches nerve fibers in the baroreceptors (see Figure 1). This results in a reflex activation of the parasympathetic nervous system, which, through actions opposite to those of the sympathetic nervous system, helps to restore homeostasis. In this experiment, you will observe how the heart and circulatory system respond to cold stimulus applied peripherally. Cold will act as a noxious stimulus, activating the ―fight or flight‖ response through the sympathetic nervous system. Figure 1 Human Physiology with Vernier 10 - 1
- 2. Heart Rate and Blood Pressure as Vital Signs OBJECTIVES In this experiment, you will Obtain graphical representation of heart rate and blood pressure. Compare heart rate and blood pressure before and after exposure to cold stimulus. Observe an example of sympathetic nervous system activation (―fight or flight response‖). MATERIALS computer Vernier Blood Pressure Sensor Vernier computer interface ice water bath Logger Pro towel Vernier Hand-Grip Heart Rate Monitor or saline solution in dropper bottle Vernier Exercise Heart Rate Monitor (only for use with Exercise HR Monitor) PROCEDURE Part I Baseline Blood Pressure Determination 1. Connect the Blood Pressure Sensor to Channel 1 of the Vernier computer interface. There are two rubber tubes connected to the pressure cuff. One tube has a black Luer-lock connector at the end and the other tube has a bulb pump attached. Connect the Luer-lock connector to the stem on the Blood Pressure Sensor with a gentle half turn if it is not already attached. 2. Open the file ―10a Heart Rate and BP‖ from the Human Physiology with Vernier folder. 3. Attach the Blood Pressure cuff firmly around the upper arm, approximately 2 cm above the elbow. The two rubber hoses from the cuff should be positioned over the biceps muscle (brachial artery) and not under the arm (see Figure 2). 4. Have the subject sit quietly in a chair with forearms resting on his/her lap, or on a table surface. The person having his or her blood pressure measured must remain still during data collection; there should be no movement of the arm or hand during measurements. Figure 2 5. Click to begin data collection. Immediately begin to pump until the cuff pressure reaches at least 160 mm Hg. Stop pumping. The cuff will slowly deflate and the pressure will fall. During this time, the systolic, diastolic, and mean arterial pressures and the pulse will be calculated by the software. These values will be displayed on the computer screen. When the cuff pressure drops below 50 mm Hg, the program will stop calculating blood pressure. At this point, you can terminate data collection by clicking . Release the pressure from the cuff, but do not remove it. 6. Enter the systolic, diastolic, and mean arterial pressures in Table 1. Part II Heart Rate and Blood Pressure Response to Cold 7. Connect the receiver module of the Heart Rate Monitor to Channel 2 of the Vernier computer interface. Open the file ―10b Heart Rate and BP‖ from the Human Physiology with Vernier folder. Human Physiology with Vernier 10 - 2
- 3. Heart Rate and Blood Pressure as Vital Signs 8. Set an ice water bath on the floor, next to the subject’s feet. 9. Prepare to collect data. a. Sit in a chair. b. Prepare to submerge your foot in the ice water bath by removing your shoe and sock. c. Position your foot adjacent to the ice water bath, but do not put it in the bath yet. 10. Set up the Heart Rate Monitor. Follow the directions for your type of Heart Rate Monitor. Using a Hand-Grip Heart Rate Monitor a. The receiver and one of the handles are marked with a white alignment arrow as shown in Figure 3. Locate these two arrows. b. Have the subject grasp the handles of the Hand-Grip Heart Rate Monitor so that their fingers are in the reference areas indicated in Figure 4. Hold the handles vertically. c. Have someone else hold the receiver near the handles so that the two alignment arrows are pointing in the same direction and are at approximately the same Figure 3 Figure 4 height as shown in Figure 3.Note: The receiver must stay within 60 cm of the handles during data collection. 11. With the subject sitting quietly, click to begin data collection. a. At 40 s, instruct the subject to submerge his/her foot in the ice water bath. b. Immediately pump the bulb pump of the Blood Pressure Sensor until the cuff pressure reaches at least 160 mm Hg. Stop pumping. c. At 70 s instruct the subject to remove his/her foot from the ice water bath. d. As data collection continues, the cuff will slowly deflate and the pressure will fall. During this time, the systolic, diastolic, and mean arterial pressures will be calculated by the software. When the cuff pressure drops below 50 mm Hg, the program will stop calculating blood pressure. e. The subject should remain seated and allow data collection to continue for the full 240 s data-collection period. 12. Enter the systolic, diastolic, and mean arterial pressures in Table 2. 13. Click and drag over the area of the heart rate graph where the resting (―baseline‖) heart rate is displayed (15–40 s). Click the Statistics button, . The Statistics box will appear with the statistics calculated for the selected region. Record the mean resting heart rate, to the nearest whole number, in Table 3. Human Physiology with Vernier 10 - 3
- 4. Heart Rate and Blood Pressure as Vital Signs 14. Move the statistics brackets to highlight the region of the graph beginning at 40 s (when the foot was immersed in the ice water bath) and ending at the first peak (see Figure 6). Record the maximum heart rate value to the nearest whole number in Table 3. In the corresponding Time column record (to the nearest whole number) the x value displayed at the lower left corner of the graph. Figure 6 Figure 7 15. Move the Statistics brackets to enclose the region of the graph beginning at the first peak and ending at the lowest point in the valley that follows (see Figure 7). Record the minimum heart rate value to the nearest whole number as the Rebound heart rate in Table 3. Record the x value in the corresponding Time column. Human Physiology with Vernier 10 - 4
- 5. Heart Rate and Blood Pressure as Vital Signs DATA Table 1–Baseline Blood Pressure Systolic pressure Diastolic pressure Mean arterial pressure (mm Hg) (mm Hg) (mm Hg) 119mm Hg 63mm Hg 91mm Hg Table 2–Blood Pressure Response to Cold Systolic pressure Diastolic pressure Mean arterial pressure (mm Hg) (mm Hg) (mm Hg) 159 mm Hg 76 mmHg 96 mm Hg Table 3 Heart rate Time Condition (bpm) (s) Resting heart rate 75 bpm Maximum heart rate 91 bpm 6.8 s Rebound heart rate 63 bpm 99 s DATA ANALYSIS 1. Describe the trends that occurred in the systolic pressure, diastolic pressure, mean arterial pressure, and heart rate with cold stimulus. How might these responses be useful in a ―fight or flight‖ situation? More adrenaline was released when he submerged his foot in the water. 2. As a vital sign, blood pressure is an indicator of general health. A high blood pressure (140/90 or higher) increases the risk of cardiovascular disease and strokes. Collect the systolic and diastolic pressures for the class and calculate the average for each. Rate the class average blood pressure using the follow scale:139/70 143/77 Blood Pressure Category 140/90 or higher High 120–139/80–89 Pre-hypertension 119/79 or below Normal Human Physiology with Vernier 10 - 5
- 6. Heart Rate and Blood Pressure as Vital Signs 3. How long after immersion did your heart rate reach its maximum value? Explain the physiologic mechanism that led to this change in heart rate. Right after he immersed his foot into the water, his heart rate shot up. What should have happened was a noticeable increase over the 30-second period. What causes the heart to increase when the foot is immersed in the water, is blood is trying to rush down to keep homeostasis. 4. Describe the changes in heart rate that occurred after the maximum value. How can you explain the minimum heart rate value? How would you explain the heart rate variations seen in the remainder of the experiment? The changes in the heart rate that occurred after the maximum value, the rate slowly decreased trying to reach rebound rate. The minimum heart rate value is the “resting” heart rate, where the body is calm and relaxed. 5. How long after the maximum heart rate did it take to arrive at your rebound heart rate? What can you say about the relative speed of physiologic response to a stimulus vs. the speed of mechanisms that are designed to maintain homeostasis? It took approximately 100 second to reach the rebound heart rate. 6. If the heart rate is too slow there is inadequate blood pressure to maintain perfusion to the brain. This can lead to loss of consciousness (fainting). Keeping in mind the autonomic nervous system responses that you observed in this experiment, explain the sequence of events that results in a severely frightened person fainting. If you become extremely frightened, your ANS will stimulate the vessels in your muscles of your body to *dilate*--legs, arms, and core, to prepare you to "fight or flight." Basically, you are expanding the amount of blood and oxygen for your limbs to use to get you out of the situation. Human Physiology with Vernier 10 - 6
- 7. Heart Rate and Blood Pressure as Vital Signs Heart Rate, Blood Pressure, and Exercise The adaptability of the heart can be observed during exercise, when the metabolic activity of skeletal muscles increases. The cardiovascular system, consisting of the heart and blood vessels, responds to exercise with an increase in heart rate and strength of contraction with each beat, resulting in a higher cardiac output (cardiac output = quantity of blood pumped through the heart per unit of time) and blood pressure. Positive pressure is created by forceful contraction of the left ventricle of the heart, measured as systole. It is maintained during relaxation of the ventricle by closure of the aortic valve and recoil of arteries, measured as diastole (see Figure 1). Mean arterial pressure (MAP) is a useful measure of the adequacy of tissue perfusion, and is not a simple average of systolic and diastolic blood pressures. This is because diastole continues for twice as long as systole. MAP can be reasonably approximated using the equation: ( systole 2(diastole)) MAP 3 The mean arterial pressure is directly proportional to cardiac output and inversely proportional to total peripheral resistance, where: Cardiac output is the amount of blood pumped out of the heart with each beat (called the stroke volume), multiplied by the number of beats per minute. Total peripheral resistance depends on blood viscosity, length of the arterial system, diameter and elasticity of the blood vessels, and the pressure entering versus leaving the arterial system (systolic pressure minus the pressure in the venous system). Figure 1 Human Physiology with Vernier 10 - 7
- 8. Heart Rate and Blood Pressure as Vital Signs In this experiment, you will observe how the heart responds to the increased metabolic demand of muscles during exercise. You will compare heart rate and blood pressure readings taken before and after exercise and measure changes in systolic, diastolic and mean arterial pressures. You will also consider the effect that exercise has on cardiac output and peripheral vascular resistance. Important: Do not attempt this experiment if physical exertion will aggravate a health problem. Inform your instructor of any possible health problems that might be exacerbated if you participate in this exercise. OBJECTIVES In this experiment, you will Obtain graphic representation of heart rate and blood pressure. Determine the effect of exercise on heart rate, and systolic, diastolic and mean arterial pressures. Use blood pressure readings and pulse to infer changes in cardiac output and peripheral vascular resistance with exercise. Correlate the fitness level of individuals with amount of daily exercise. MATERIALS computer Vernier Hand-Grip Heart Rate Monitor or Vernier computer interface Vernier Exercise Heart Rate Monitor Logger Pro saline solution in dropper bottle Vernier Blood Pressure Sensor (only for use with the Exercise HR Monitor) PROCEDURE Part I Baseline Blood Pressure 1. Connect the Blood Pressure Sensor to Channel 1 of the Vernier computer interface. Open the file ―11a Heart Rate BP Exercise‖ from the Human Physiology with Vernier folder. 2. Attach the Blood Pressure Sensor to the blood pressure cuff if it is not already attached. There are two rubber tubes connected to the cuff. One tube has a black Luer-lock connector at the end and the other tube has a bulb pump attached. Connect the Luer-lock connector to the stem on the Blood pressure Sensor with a gentle half turn. 3. Attach the Blood Pressure cuff to the upper arm, approximately 2 cm above the elbow. The two rubber hoses from the cuff should be positioned over the biceps muscle (brachial artery) and not under the arm (see Figure 2). Figure 2 4. The subject should sit quietly in a chair and avoid moving his or her arm or hand during blood pressure measurements. Human Physiology with Vernier 10 - 8
- 9. Heart Rate and Blood Pressure as Vital Signs 5. Click to begin data collection. Immediately begin to pump until the cuff pressure reaches at least 160 mm Hg. Stop pumping. 6. During this time the systolic, diastolic, and mean arterial pressures will be calculated by the software. These values will be displayed on the computer screen. When the blood pressure readings have stabilized (after the pressure drops to 50 mm Hg), the program will stop calculating blood pressure. At this point, you can terminate data collection by clicking . Release the pressure from the cuff, but do not remove it. 7. Enter the pulse and the systolic, diastolic, and mean arterial pressures in Table 1. Part II Heart Rate and Blood Pressure after Exercise 8. Connect the receiver module of the Heart Rate Monitor to Channel 2 of the Vernier computer interface. Open the file ―11b Heart Rate BP Exercise‖ from the HumanPhysiology with Vernier folder. 9. Set up the Heart Rate Monitor. Follow the directions for your type of Heart Rate Monitor. Using a Hand-Grip Heart Rate Monitor a. The receiver and one of the handles are marked with a white alignment arrow as shown in Figure 3. Locate these two arrows. b. Have the subject grasp the handles of the Hand-Grip Heart Rate Monitor so that their fingers are in the reference areas indicated in Figure 4. Hold the handles vertically. c. Have someone else hold the receiver near the handles so that the two alignment arrows are pointing in the same direction and are at approximately the same Figure 3 Figure 4 height as shown in Figure 3. Note: The receiver must stay within 60 cm of the handles during data collection. 10. Stand quietly facing your table or lab bench. 11. To determine that everything is set up correctly, click to begin monitoring heart rate. Note that there may be up to a 30 second delay before data are seen. The readings should be within the normal range of the individual, usually between 55 and 80 beats per minute. Click when you have determined that the equipment is operating properly, and proceed to Step 12. 12. Click to begin data collection. If the baseline appears stable, begin to run in place at 40 s. Continue data collection while running in place for the next 2 minutes. 13. At approximately 160 s, stop running. Stand still. Do not move during blood pressure measurement. 14. Immediately begin to pump the blood pressure cuff until the cuff pressure reaches at least 160 mm Hg. Stop pumping. 15. During this time the systolic, diastolic, and mean arterial pressures will be calculated by the software. These values will be displayed on the computer screen. When the blood pressure readings have stabilized (after the pressure drops to 50 mm Hg), the program will stop calculating blood pressure. At this point, release the pressure from the cuff. Human Physiology with Vernier 10 - 9
- 10. Heart Rate and Blood Pressure as Vital Signs 16. Enter the systolic, diastolic, and mean arterial pressures in Table 2. 17. The subject should continue to stand in place while his/her heart rate slows toward its resting pre-exercise value. Data will be collected for 280 s. 18. Click and drag over the area of the graph where the resting heart rate is displayed (from 0 to approximately 40 s). This will highlight the region of interest. 19. Click the Statistics button, . Record the mean resting heart rate in Table 3. 20. Drag the right hand bracket to the right edge of the graph, until all the data points are highlighted. The values in the Statistics box will be adjusted based on the data within the brackets. Record the maximum heart rate in Table 2 (under ―pulse‖) and in Table 3. 21. Move the statistics brackets to highlight the area of the graph beginning with the maximum heart rate and ending with the first data point that matches the initial baseline value (or the last point graphed, if baseline is not achieved). Record the x value displayed at the lower left corner of the graph as the recovery time in Table 3. Human Physiology with Vernier 10 - 10
- 11. Heart Rate and Blood Pressure as Vital Signs DATA Table 1–Baseline Blood Pressure Systolic pressure Diastolic pressure Mean arterial pressure Pulse (mm Hg) (mm Hg) (mm Hg) (bpm) 125 55 76 75 Table 2–Blood Pressure After Exercise Systolic pressure Diastolic pressure Mean arterial pressure Pulse (mm Hg) (mm Hg) (mm Hg) (bpm) 126 85 93 99 Table3–Heart Rate Condition Resting heart rate (bpm) 68 Maximum heart rate (bpm) 108.7 Recovery time (s) 1 min 9 sec DATA ANALYSIS 1. Describe the trends that occurred in the systolic pressure, diastolic pressure, mean arterial pressure and pulse with exercise. Assume that the stroke volume increased from 75 mL/beat to 100 mL/beat. Use this information and the change in pulse with exercise to calculate the change in cardiac output (stroke volume × heart rate) that occurred per minute. The systolic, diastolic, and mean arterial pressure increases during running along with the pulse rate. The systolic, diastolic and mean arterial pressures, and pulse rate return to normal a little over a minute because our person is in soccer and they have a faster recovery time than someone who doesn’t exercise or is active. The cardio output before running in pace is 2225 per minute and 1,775 per minute after running. 2. Pulse pressure is the difference between systolic pressure (peak pressure during active contraction of the ventricles) and diastolic pressure (the pressure that is maintained even while the left ventricle is relaxing). Describe the change in pulse pressure seen with exercise. Which component of the blood pressure is most responsible for this change? The pulse pressure in the beginning of the exercise is less than after running. The left ventricle ejects blood which causes aorta pressure. The change is caused by the stroke volume of the ventricle. (6) Human Physiology with Vernier 10 - 11
- 12. Heart Rate and Blood Pressure as Vital Signs 3. A change in pulse pressure can be seen in a variety of medical conditions. What would you expect to happen to the pulse pressure in the following examples? (a) In atherosclerosis there is a hardening of the arterial walls. It blocks the flow the blood in which decreases the amount of blood the left ventricle ejects, which lowers the stoke volume. The stroke volume determines the pulse pressure, so atherosclerosis hinders the stoke volume. (b) A damaged aortic valve does not seal properly and allows blood to flow back into the ventricle during diastole. The pulse pressure increases because the aortic valve is leaky and the systolic pressure increases as the diastolic pressure decreases. (7) 4. Normal resting heart rates range from 55−100 beats per minute. What was your/the subject’s resting heart rate? How much did your/the subject’s heart rate increase above resting rate with exercise? What percent increase was this? Our subjects resting heart rate was 68 bpm. Her heart rate increased 41 bpm with performing the exercise. 5. How does your/the subject’s maximum heart rate compare with other students in your group/class? Is this what you expected? It is average compared to the other results. During exercise the heart rate increases to supply the body with enough oxygenated blood. 6. Recovery time has been shown to correlate with degree of physical fitness. How does your/the subject’s recovery rate compare to that of your classmates? Is this what you expected? Compared to other results, her recovery time was quicker. Our subject runs for the schools cross country team and I expected to see this. 7. Congestive heart failure is a condition in which the strength of contraction with each beat may be significantly reduced. For example, the ventricle may pump only half the usual volume of blood with each beat. Would you expect a person with congestive heart failure to have a faster or slower heart rate at rest? With exercise? A person with congestive heart failure would have a slower resting heart rate because the strength of the contraction is reduced which would cause a decrease in heart rate. 8. Medications are available which can slow the heart or speed it up. If a patient complains of feeling poorly and has a heart rate of 120 beats per minute, should you administer a medicine to slow the rate? I would administer a medicine to slow the rate because having that high of a heart rate at rest, will possibly cause damage heart problems. Human Physiology with Vernier 10 - 12