Logistics Market Snapshot July 2011
•
0 recomendaciones•350 vistas

List of the best Logistics Key Performance Indicators (KPI) for the month of July 2011.

Recomendados
Más contenido relacionado
Destacado
Destacado (18)
Similar a Logistics Market Snapshot July 2011
Similar a Logistics Market Snapshot July 2011 (20)
Último
Último (20)
Logistics Market Snapshot July 2011
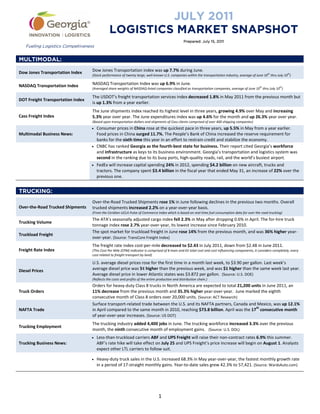
- 1. JULY 2011 LOGISTICS MARKET SNAPSHOT Prepared: July 15, 2011 Fueling Logistics Competiveness MULTIMODAL: Dow Jones Transportation Index Dow Jones Transportation index was up 7.7% during June. th th (Stock performance of twenty large, well-known U.S. companies within the transportation industry, average of June 10 thru July 10 ) NASDAQ Transportation Index NASDAQ Transportation Index was up 6.9% in June. th th (Averaged share weights of NASDAQ-listed companies classified as transportation companies, average of June 10 thru July 10 ) The USDOT's freight transportation services index decreased 1.8% in May 2011 from the previous month but DOT Freight Transportation Index is up 1.3% from a year earlier. The June shipments index reached its highest level in three years, growing 4.9% over May and increasing Cass Freight Index 5.3% year over year. The June expenditures index was up 4.6% for the month and up 26.3% year over year. (Based upon transportation dollars and shipments of Cass clients comprised of over 400 shipping companies) • Consumer prices in China rose at the quickest pace in three years, up 5.5% in May from a year earlier. Multimodal Business News: Food prices in China surged 11.7%. The People’s Bank of China increased the reserve requirement for banks for the sixth time this year in an effort to restrain credit and stabilize the economy. • CNBC has ranked Georgia as the fourth-best state for business. Their report cited Georgia’s workforce and infrastructure as keys to its business environment. Georgia’s transportation and logistics system was second in the ranking due to its busy ports, high-quality roads, rail, and the world’s busiest airport. • FedEx will increase capital spending 24% in 2012, spending $4.2 billion on new aircraft, trucks and tractors. The company spent $3.4 billion in the fiscal year that ended May 31, an increase of 22% over the previous one. TRUCKING: Over-the-Road Trucked Shipments rose 1% in June following declines in the previous two months. Overall Over-the-Road Trucked Shipments trucked shipments increased 2.2% on a year-over-year basis. (From the Ceridian-UCLA Pulse of Commerce Index which is based on real-time fuel consumption data for over the road trucking) The ATA’s seasonally adjusted cargo index fell 2.3% in May after dropping 0.6% in April. The for-hire truck Trucking Volume tonnage index rose 2.7% year-over-year, its lowest increase since February 2010. The spot market for truckload freight in June rose 14% from the previous month, and was 36% higher year- Truckload Freight over-year. (Source: TransCore Freight Index) The freight rate index cost-per-mile decreased to $2.43 in July 2011, down from $2.48 in June 2011. Freight Rate Index (This Cost Per Mile (CPM) indicator is comprised of 8 main and 65 total cost and cost influencing components, it considers completely, every cost related to freight transport by land) U.S. average diesel prices rose for the first time in a month last week, to $3.90 per gallon. Last week’s Diesel Prices average diesel price was 5¢ higher than the previous week, and was $1 higher than the same week last year. Average diesel price in lower Atlantic states was $3.872 per gallon. (Source: U.S. DOE) (Reflects the costs and profits of the entire production and distribution chain.) Orders for heavy-duty Class 8 trucks in North America are expected to total 21,200 units in June 2011, an Truck Orders 11% decrease from the previous month and 35.3% higher year-over-year. June marked the eighth consecutive month of Class 8 orders over 20,000 units. (Source: ACT Research) Surface transport-related trade between the U.S. and its NAFTA partners, Canada and Mexico, was up 12.1% th NAFTA Trade in April compared to the same month in 2010, reaching $73.8 billion. April was the 17 consecutive month of year-over-year increases. (Source: US DOT) The trucking industry added 4,400 jobs in June. The trucking workforce increased 3.3% over the previous Trucking Employment month, the ninth consecutive month of employment gains. (Source: U.S. DOL) • Less-than-truckload carriers ABF and UPS Freight will raise their non-contract rates 6.9% this summer. Trucking Business News: ABF’s rate hike will take effect on July 25 and UPS Freight’s price increase will begin on August 1. Analysts expect other LTL carriers to follow suit. • Heavy-duty truck sales in the U.S. increased 68.3% in May year-over-year, the fastest monthly growth rate in a period of 17-straight monthly gains. Year-to-date sales grew 42.3% to 57,421. (Source: WardsAuto.com) 1
- 2. JULY 2011 LOGISTICS MARKET SNAPSHOT Fueling Logistics Competiveness Prepared: July 15, 2011 RAIL: Railroad bulk carload freight decreased 0.7% in June 2011 over May. June’s freight traffic increased 0.9% U.S. Freight Rail Traffic over June 2010, and was up 11.6% over June 2009. (Source: AAR) (Report includes rail car-loadings by 19 different major commodity categories as well as intermodal units) Intermodal rail traffic in June 2011 was 4.6% higher than June 2010, but 0.3% lower than May 2011 totals. U.S. Intermodal Rail Traffic Intermodal loadings have experienced year-over-year gains for 19 straight months. (Source: AAR) (Report includes rail car-loadings by 19 different major commodity categories as well as intermodal units) The index of average railroad fuel prices in May was 628.7, down 4.6% from the previous month, but 42% Railroad Fuel Price Index higher than the previous year. (Source: AAR) (Average monthly price for gallons purchased by freight railroads; Includes federal excise taxes, transportation, and handling expenses) The number of freight cars in storage has decreased to 276,236 (18.2% of the fleet) on July 1, up 2,847 cars Freight Cars in Storage from a month earlier. (Source: AAR) (A freight car is "in storage" if it has had a loaded revenue move since 2005, but not in the past 60 days. Decrease here = more demand) Railroad employment was up 745 employees to 157,522 employees in May 2011 over the previous month. Class 1 Railroad Employment (Source: U.S. STB, AAR) • The U.S. Surface Transportation Board has dramatically cut fees for shippers to file a railroad rate or unreasonable practice complaint from $20,000 to $350. The STB hopes that the lower rate will provide Railroad Business News: greater public access to its processes and allow it to better investigate and address potential rate violations and unlawful practices. • Greenbrier Companies, the North American builder of freight railcars and barges, reported revenue increases of 153% in its fiscal 3Q. The company returned to profit before paying a $10 million debt refinance fee. Greenbrier posted a final net loss of $3.3 million, down from a $4.6 million loss last year. AIR FREIGHT: Global air freight in May fell 4.3% from one year ago and was up 1.2% over the previous month. North Air Cargo Traffic American air freight decreased 1.2% in May year-over-year. (Source: IATA) (Global air freight covers international scheduled air traffic; domestic traffic is not included. North American traffic includes only domestic freight traffic.) In May, Hartsfield-Jackson Atlanta International Airport transported 54,796 metric tons of cargo, a 6% Atlanta Air Cargo Traffic increase over April and a 1.42% decrease year-over-year. (Source: HJIA) Average international air cargo prices were relatively stable in May with a 0.7% drop. Air freight rates were Air Freight Price Index down 17% year-over-year, the seventh straight year-over-year decline. (Source: JOC) (The Drewry Air Freight Price Index is based on the average of rates ($US per kg) for cargoes of 100+kg to 1,000+kg cargoes from Shanghai to London, Moscow, Prague, New York, and Los Angeles.) Jet Fuel Prices As of July 8, 2011, the global average jet fuel price was $126 per barrel; down 5.1% from the previous month, and 45.7% higher year-over-year. (Source: IATA) (The weekly index and price data shows the global average price paid at the refinery for aviation jet fuel) • The world’s freighter fleet is expected to double from 1,760 to 3,500 aircraft in the next 20 years. In its 2011 Market Outlook, Boeing projected the air cargo market to grow by 5.6% annually through 2030, Air Freight Business News: outpacing passenger growth of 5.1%. Freighter fleet additions will include approximately 970 new planes with a market value of $250 billion and nearly 2,000 conversions of passenger jets. • The International Air Transport Association expects airline net profits in 2011 to total $4 billion, 78% lower than the $18 billion earned last year. Revenues for the airline industry will increase 7.9% in 2011, but fuel expenses are also projected to increase 26.6% for the year. Archives of these monthly snapshots are posted to: snapshot.georgialogistics.org For more information about the Logistics Market Snapshot or the many other resources and activities of the Georgia Center of Innovation for Logistics please contact: Page Siplon, Executive Director – psiplon@georgia.org – 912.966.7867 2
- 3. JULY 2011 LOGISTICS MARKET SNAPSHOT Fueling Logistics Competiveness Prepared: July 15, 2011 OCEAN FREIGHT: In May 2011, the U.S. imported more than $67 billion of cargo via ocean. May U.S. ocean imports have Import Volumes increased 7% in terms of value over the previous month. (Source: US Census) In May 2011, the U.S. exported about $48 billion of cargo via ocean. May U.S. ocean exports have decreased Export Volumes 1% in terms of value over the previous month and grew 27% year-over-year. (Source: US Census) U.S. import prices decreased 0.5% in June, the first monthly decline since June 2010. The price index for U.S. Import & Export Price Index exports rose 0.1% in June after rising 0.2% the previous month. Import cargo volume at the nation’s major retail container ports is slightly lower (about 1.5% lower) than last year this summer. Strong increases are expected to return in September as retailers begin to stock up for Retail Freight Volumes the holiday season. The National Retail Federation is expecting retail volumes in September to increase 10%, October to increase 18%, and November to increase 19%. (Source: NRF) The July 11, 2011 average spot market rate was $1,636 per FEU. The latest container spot market rate is Container Rates $118 lower than the previous week, and $988 (37.7%) lower than the rate for the same week last year. (Source: JOC & Drewry Inc.) (Based on Drewry Shipping Consultants' research and derived from shipping rates from Hong Kong to Los Angeles. The rate is based on a full 40-foot container load or FEU, excluding terminal-handling charges in Hong Kong.) th The July 8 SCFI rate was $1,030.64 per FEU; down steady with the previous week, and 34.8% lower year- Shanghai Containerized over-year. The spot rate for shipments to the U.S. East Coast was $3105 per FEU, down 0.3% from the Freight Index previous week. (Source: JOC) (The Shanghai Containerized Freight Index is a weekly reported average export spot rate from Shanghai for 15 different trade lanes.) The Baltic Dry Index decreased 4.36% in June, ending with a cost of $1,422. The BDI has decreased 0.5% for Ocean Bulk Freight Rates the first half of July. (Source: The Baltic Exchange) (The Baltic Dry Index is an index that tracks and averages worldwide international shipping prices of various dry bulk cargoes.) Average bunker fuel price was down 0.3% or $2.29/MT to $814.89/MT in June 2011. By mid-July, bunker Bunker Fuel Prices fuel prices were up 2.5% to $835.10/MT. (Source: Bunker Index) (The Bunker Index is the average global bunker fuel price from individual ports; measure in $US per MT or megaton) In May 2011, container traffic was up 10.1% year-over-year, totaling 254,329 TEUs. The port’s loaded export Port of Savannah container volume increased 16.7% over the previous year, and breakbulk cargo handled at Savannah’s Ocean Terminal was up 45.7% as it moved 106,782 tons. (Source: GPA) In May 2011, the Port of Brunswick posted its highest monthly volume ever as 43,843 automobile and Port of Brunswick machinery units were moved, a 21.8% increase year-over-year. Brunswick’s Roll-on/Roll-off volume in May was 43.6% higher year-over-year. (Source: GPA) • There were 36% more international pirate attacks in the first half of 2011 compared to the same period in Ocean Freight Business News: 2010, but Somali pirates’ hijacking success has fallen, managing only to hijack 21 ships in the first half of 2011 compared with 27 in the same period last year. • Spot container freight rates from Asia to the U.S. plunged 6.7% over the past week, a sign that excess capacity is wearing down shipping prices. Rates fell to $1,636 in the week ending July 11, down from $1,753 the week before. The latest rate is the lowest since January 2010. Drewry Maritime Research is forecasting average east-west ocean freight rates will drop 20.8% in 2011 from 2010 despite strong container volumes. • Maersk is planning to charge its customers a fee for booked containers that fail to appear at the port of departure. Currently, 30% of containers that are booked with the carrier are not showing up. Maersk hopes that a “load protection fee” of $100 per dry container and $500 per refrigerated container will discourage waste in the industry. The Danish carrier plans to test the fee system before it takes effect. • U.S. steel imports increased by 5.6% in May from the previous month. Total steel imports were 2.7 million tons in May compared to 2.5 million tons in April 2011. Year-to-date imports increased 20.6% compared to 2010 and reflect steady improvement in the market with strong demand and pricing. • The PierPass program that operates in the Ports of Los Angeles and Long Beach, California implemented a th fee increase of 20% on July 4 . The fee for cargo pickups and deliveries at the port during daytime business hours was raised to $60. 3
- 4. JULY 2011 LOGISTICS MARKET SNAPSHOT Fueling Logistics Competiveness Prepared: July 15, 2011 WAREHOUSING & DISTRIBUTION: The U.S. average industrial vacancy rate was 9.3% during Q2 2011, down from 9.5% in the previous quarter. Industrial Vacancy Overall vacancy was 11.3% in the South and 15.2% in Atlanta during the second quarter. (Source: Cassidy Turley) In Q2 2011, warehouse and distribution rental rates in the US averaged $5.09 per square foot, up from Warehouse Rent Rates $5.05/square foot in the previous quarter. Rental rates for warehouse space averaged $4.47/square foot in the South and $3.44/square foot in Atlanta. (Source: Cassidy Turley) Net absorption in the US during Q2 2011 totaled +21.9 million square feet. Absorption in the South led the Industrial Absorption regions with +10.6 million square feet, more than doubling the industrial absorption of any other region. (Source: Cassidy Turley) (Absorption is the net change in occupied space between two points in time. Positive absorption means that previously unoccupied space is being occupied.) The National PMI increased 1.8 points to 55.3 in June 2011, and indicates expansion in the manufacturing rd Purchasing Managers Index sector for the 23 consecutive month. New orders increased 0.6 points to 51.6 and production increased 0.5 points to 54.5. (Source: ISM) (The PMI combines data on new orders, inventory, production, supplier deliveries, and employment. A reading above 50 indicates that the manufacturing economy is generally expanding.) Georgia’s PMI decreased 7.7 points to 56.9 in June, but was still 1.6 points higher than the national PMI. Purchasing Managers Index New orders in Georgia were down 9.6 points to 58.3 and production was down 8.2 points to 59.7. in Georgia (Source: Kennesaw State University) (The PMI combines data on new orders, inventory, production, supplier deliveries, and employment. A reading above 50 indicates that the manufacturing economy is generally expanding.) • Hyundai Construction Equipment Americas, an arm of South Korea-based Hyundai Heavy Industries Co, will invest $10 million to move its American headquarters from Chicago, Illinois to Norcross, Georgia. The W&D Business News: headquarters will include a warehouse and office space for the company’s finance, sales and service operations. • Kuehne + Nagel was the largest international freight forwarder in 2010, handling nearly 10% of the world’s air and sea freight business by revenue. The Switzerland-based forwarder reported $21.3 billion in revenue in 2010. Expeditors International, the top U.S. forwarder, ranked fifth on the list. The top 10 freight forwarders’ business accounted for 44% of the market. U.S. MARKET: The U.S. GDP increased 1.9% in the first quarter 2011 according to the third estimate released by the BEA. Gross Domestic Product (Source: US BEA) The U.S. trade deficit increased by 15.1% in May to $50.2 billion, as exports decreased 0.5% to $175 billion U.S. Trade Deficit and imports increased 2.6% to $225.1 billion. (Source: US DOC & Census Bureau) Decreased to 58.5% in June 2011 from 61.7% in May 2011, the second straight monthly decline. Consumer Confidence (Source: The Conference Board) (The consumer confidence index is based on a monthly survey of 5,000 U.S. households. It is designed to gauge the financial health, spending power, and confidence of the average U.S. consumer.) The unemployment rate in America rose to 9.2% in June 2011, the third monthly increase in a row and the Unemployment Rate highest rate in six months. Approximately 18,000 jobs were created in June, an unexpectedly low amount. (Source: US DOL) The Leading Economic Index for the U.S. increased 0.8% in May to 114.7 (2004=100), following a 0.4% decrease Leading Economic Index in April and a 0.7% increase in March. (Source: Conference Board) (The LEI is a composite of 10 economic indicators that together create an analytic system designed to signal peaks and troughs in the business cycle. The LEI reveals patterns in economic data in a clearer and more convincing manner than any individual component alone.) Retail and food service sales rose in June to $387.8 Billion, up 0.1% from the previous month, and up 8.1% Retail Sales from June 2010. Non-store retailer sales were up 12.3% from June 2010. (Source: US Census) Total combined sales and manufacturing shipments totaled $1.184 Trillion in May 2011, down 0.1% from Manufacturing & Trade Sales April and up 11.6% from the previous year. (Source: US Census) Total value of inventory on hand is estimated at $1.514 Trillion in May 2011, up 1% from April and up 11.6% Manufacturing & Trade Inventory from May 2010. (Source: US Census) In May, housing starts increased 3.5% to an annual rate of 560,000 units. Building permits (an indicator of Housing Starts future housing starts) increased 8.7% to an annual rate of 612,000. 4