Caitlin de boer.tampaspreadsheet.cs102 02final.21april2011
•Descargar como XLSX, PDF•
0 recomendaciones•193 vistas


Recomendados
Más contenido relacionado
Destacado
Similar a Caitlin de boer.tampaspreadsheet.cs102 02final.21april2011
Similar a Caitlin de boer.tampaspreadsheet.cs102 02final.21april2011 (12)
Último
Último (16)
Caitlin de boer.tampaspreadsheet.cs102 02final.21april2011
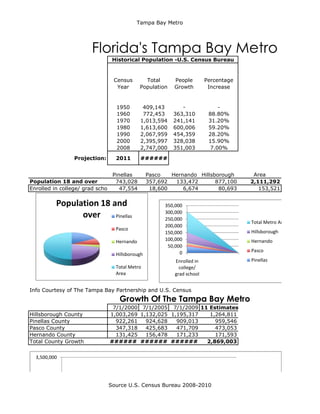
- 1. Tampa Bay Metro Florida's Tampa Bay Metro Historical Population -U.S. Census Bureau Census Total People Percentage Year Population Growth Increase 1950 409,143 - - 1960 772,453 363,310 88.80% 1970 1,013,594 241,141 31.20% 1980 1,613,600 600,006 59.20% 1990 2,067,959 454,359 28.20% 2000 2,395,997 328,038 15.90% 2008 2,747,000 351,003 7.00% Projection: 2011 ###### Total Metro Pinellas Pasco Hernando Hillsborough Area Population 18 and over 743,028 357,692 133,472 877,100 2,111,292 Enrolled in college/ grad school 47,554 18,600 6,674 80,693 153,521 Population 18 and 350,000 300,000 over Pinellas 250,000 Total Metro Area 200,000 Pasco 150,000 Hillsborough Hernando 100,000 Hernando 50,000 0 Pasco Hillsborough Enrolled in Pinellas Total Metro college/ Area grad school Info Courtesy of The Tampa Bay Partnership and U.S. Census Growth Of The Tampa Bay Metro 7/1/2000 7/1/2005 7/1/2009 11 Estimates Hillsborough County 1,003,269 1,132,025 1,195,317 1,264,811 Pinellas County 922,261 924,628 909,013 959,546 Pasco County 347,318 425,683 471,709 473,053 Hernando County 131,425 156,478 171,233 171,593 Total County Growth ###### ###### ###### 2,869,003 3,500,000 Source U.S. Census Bureau 2008-2010
- 2. Tampa Bay Metro 3,000,000 2,869,003 2,500,000 2,404,273 2,000,000 7/1/2000 7/1/2005 1,500,000 1,264,811 7/1/2009 11 Estimates 1,003,269 1,000,000 922,261 959,546 473,053 500,000 347,318 131,425 171,593 0 Hillsborough Pinellas County Pasco County Hernando Total County County County Growth Source: U.S. Census Bureau, 2005-2009 American Community Survey Source U.S. Census Bureau 2008-2010
- 3. Tampa Bay Metro Source U.S. Census Bureau 2008-2010
- 4. Tampa Bay Metro etro Total Metro Area Source U.S. Census Bureau 2008-2010
- 5. Tampa Bay Metro Source U.S. Census Bureau 2008-2010
- 6. Tampa Bay Metro Source U.S. Census Bureau 2008-2010
- 7. Tampa Bay Metro College Students Bringing Business To Tampa Bay M Number of Year Years In Students Students Enrollment Opporatio Enrolled Currentl Began n First Year y Enrolled University of South Florida 1960 51 1,993 46,000 University of Tampa 1931 80 67 6,500 Hillsborough Community College 1968 43 1,600 22,621 St. Petersburg College 1927 84 102 65,000 Clearwater Christian College 1966 45 15 600 Eckerd College 1958 53 155 2,508 Other colleges and grad schools - - 10,292 TOTALS 3,932 153,521 Years In Operation RANGE MIN 43 MAX 84 AVER 59.3 IF Then 153520.576 As of 2010, Tampa-St. Petersburg-Clearwater Metro Area's population is 2,785,301 people. Since 2000, it has had a population growth of 16.20 percent and an additional 9% increase is being Residents in the Tampa Bay Metro AGE Percent of Metro 18-24 10% 25-34 15% 35-54 36% 55-64 16% 65+ 23% Age Distribution of Adults in the Tampa Bay Source U.S. Census Bureau 2008-2010
- 8. Tampa Bay Metro Age Distribution of Adults in the Tampa Bay Metro 10% 23% 15% 16% 36% History of Resident Growth 1950 1960 1970 1980 1990 2000 Number of Residents 409,143 772,453 1,013,594 1,613,600 ###### ###### Population Growth Since 1950 3,500,000 3,000,000 2011 2009 2,500,000 2000 2,000,000 1990 1980 Number of Residents 1,500,000 1,000,000 1970 Source U.S. Census Bureau 2008-2010
- 9. Tampa Bay Metro 1,000,000 1970 1960 500,000 1950 0 1950 1960 1970 1980 1990 2000 2009 2011 Source U.S. Census Bureau 2008-2010
- 10. Tampa Bay Metro s To Tampa Bay Metro Growth Annual Economic Since Impact Start 44,007 $3,200,000,000 6,433 $600,000,000 21,021 $866,000,000 64,898 not avail. 585 not avail. 2,353 not avail. 14,224 not avail. 153,521 ############ 85,301 people. Since % increase is being Bay Metro he Tampa Bay Source U.S. Census Bureau 2008-2010
- 11. Tampa Bay Metro he Tampa Bay 18-24 25-34 35-54 55-64 65+ wth 2009 2011 ###### 2,869,003 GROWTH FROM 1950-60 363,310 1960-70 241,141 1970-80 600,006 1980-90 454,359 1990-2000 336,314 2000-2009 342,999 2011 121,731 Number of Residents Source U.S. Census Bureau 2008-2010
- 12. Tampa Bay Metro Source U.S. Census Bureau 2008-2010