Infographic: United States Wealth Report 2014
•
12 recomendaciones•5,536 vistas

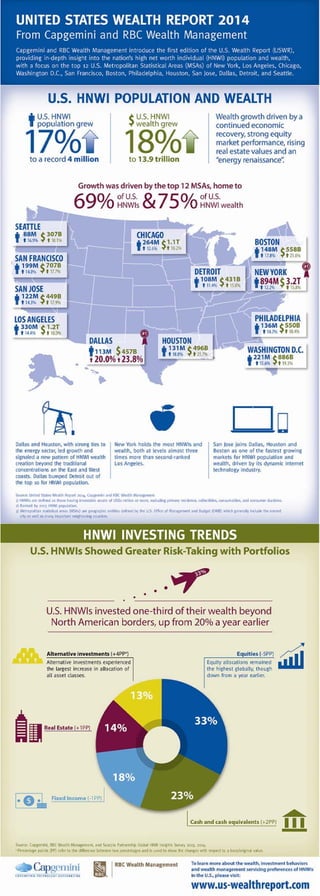
The infographic summarizes key figures from the first edition of the U.S. Wealth Report 2014 from Capgemini and RBC Wealth Management. Built from the World Wealth Report 2014 and its Global High Net Worth Insights Survey, the report highlights the growth of high net worth individuals (HNWIs) and their wealth in the U.S. The infographic reviews key figures from the report and provides a map of the U.S. with the top 12 U.S. Metropolitan Statistical Areas (MSAs) for HNWIs.
Recomendados

Recomendados
Más contenido relacionado
Destacado
Destacado (17)
Similar a Infographic: United States Wealth Report 2014
Similar a Infographic: United States Wealth Report 2014 (20)
Más de Capgemini
Más de Capgemini (20)
Último
Último (20)
Infographic: United States Wealth Report 2014
- 1. UNITED STATES WEALTH REPORT 2014 From Capgemini and RBC Wealth Management Capgemini and RBC Wealth Management introduce the first edition of the U.S. Wealth Report (USWR), providing in-depth insight into the nation’s high net worth individual (HNWI) population and wealth, with a focus on the top 12 U.S. Metropolitan Statistical Areas (MSAs) of New York, Los Angeles, Chicago, Washington D.C., San Francisco, Boston, Philadelphia, Houston, San Jose, Dallas, Detroit, and Seattle. U.S. HNWI POPULATION AND WEALTH U.S. HNWI 17% wealth grew to a record 4 million Growth was driven by the top 12 MSAs, home to CHICAGO 264K 12.6% 1.1T 16.2% HOUSTON 131K 18.0% 496B 21.7% SAN FRANCISCO 199K 14.0% 707B 17.7% PHILADELPHIA 136K 14.7% 550B 18.4% LOS ANGELES 330K 14.4% 1.2T 18.0% SAN JOSE 122K 14.3% 449B 17.9% DETROIT 108K 11.4% 431B 15.0% SEATTLE 88K 16.9% 307B 18.1% BOSTON 148K 17.8% 558B 21.6% NEW YORK 894K 12.2% 3.2T 15.8% U.S. HNWI population grew Wealth growth driven by a continued economic recovery, strong equity market performance, rising real estate values and an “energy renaissance”. WASHINGTON D.C. 221K 15.6% #1 Source: United States Wealth Report 2014, Capgemini and RBC Wealth Management 1) HNWIs are defined as those having investable assets of US$1 million or more, excluding primary residence, collectibles, consumables, and consumer durables. 2) Ranked by 2013 HNWI population. 3) Metropolitan statistical areas (MSAs) are geographic entities defined by the U.S. Office of Management and Budget (OMB) which generally include the named city as well as many important neighboring counties. HNWI INVESTING TRENDS U.S. HNWIs Showed Greater Risk-Taking with Portfolios Alternative investments (+4PP4) Alternative investments experienced the largest increase in allocation of all asset classes. Real Estate (+1PP) Fixed Income (-1PP) Equities (-5PP) Equity allocations remained the highest globally, though down from a year earlier. 33% Cash and cash equivalents (+2PP) 13% 33% 23% 14% 18% Source: Capgemini, RBC Wealth Management, and Scorpio Partnership Global HNW Insights Survey 2013, 2014. 4 Percentage points (PP) refer to the difference between two percentages and is used to show the changes with respect to a base/original value. 886B 19.3% Dallas and Houston, with strong ties to the energy sector, led growth and signaled a new pattern of HNWI wealth creation beyond the traditional concentrations on the East and West coasts. Dallas bumped Detroit out of the top 10 for HNWI population. New York holds the most HNWIs and wealth, both at levels almost three times more than second-ranked Los Angeles. San Jose joins Dallas, Houston and Boston as one of the fastest growing markets for HNWI population and wealth, driven by its dynamic internet technology industry. 18% to 13.9 trillion 69%of U.S. HNWIs &75% of U.S. HNWI wealth To learn more about the wealth, investment behaviors and wealth management servicing preferences of HNWIs in the U.S., please visit: www.us-wealthreport.com DALLAS 113K 20.0% 457B 23.8% #1 U.S. HNWIs invested one-third of their wealth beyond North American borders, up from 20% a year earlier