
![REPORTS
(3). Using existing knowledge of his time (6), opportunity now exists to use phylogenetic in- of zoogeographic regions and these previous
mostly on the distributions and taxonomic rela- formation for grouping assemblages of species classifications is the lack of support for previ-
tionships of broadly defined vertebrate families, into biogeographic units on a global scale. In ad- ous Palearctic boundaries, which restricted this
Wallace divided the world into six terrestrial dition to permitting a sound delimitation of bio- biogeographic region to the higher latitudes of
zoogeographic units largely delineated by what we geographic regions, phylogenetic information the Eastern Hemisphere. The regions of central
now know as the continental plates. Despite rely- allows quantifying phylogenetic affinities among and eastern Siberia are phylogenetically more
ing on limited information and lacking a statistical regions (e.g., 10). Newly developed statistical similar to the arctic parts of the Nearctic region,
basis, Wallace’s original map is still in use today. frameworks facilitate the transparent character- as traditionally defined, than to other parts of
Wallace’s original zoogeographic regional- ization of large biogeographic data sets while min- the Palearctic (fig. S2). As a result, our newly
ization scheme considered ancestral relationships imizing the need for subjective decisions (11). defined Palearctic realm extends across the
among species, but subsequent schemes generally Here, we delineated the terrestrial zoogeo- arctic and into the northern part of the Western
used data only on the contemporary distribu- graphic realms and regions of the world (12) by Hemisphere (Fig. 1 and fig. S1). These results
tions of species without explicitly considering integrating data on the global distributions and bear similarities with the zoogeographic map of
phylogenetic relationships (7–9). Phylogenetic phylogenetic relationships of the world’s am- (11) derived from data on the global distribution
trees contain essential information on the evolu- phibians (6110 species), nonpelagic birds (10,074 of mammal families. In addition, our results sug-
tionary relationships of species and have be- species), and nonmarine mammals (4853 species), gest that the Saharo-Arabian realm is interme-
come increasingly available in recent decades, a total of 21,037 vertebrates species [see (13) for diate between the Afrotropical and Sino-Japanese
permitting the delineation of biogeographic re- details]. Pairwise phylogenetic beta diversity (pb) realms [see the nonmetric multidimensional scaling
Downloaded from www.sciencemag.org on January 3, 2013
gions as originally envisioned by Wallace. The metrics were used to quantify change in phyloge- (NMDS) plot in fig. S2]. Finally, we newly define
netic composition among species assemblages the Panamanian, Sino-Japanese, and Oceanian
1
Center for Macroecology, Evolution, and Climate, Depart- across the globe. Analyses of combined taxa pb realms [but see the Oceanian realm of Udvardy
ment of Biology, University of Copenhagen, 2100 Copenhagen values identified a total of 20 zoogeographic re- in (14) derived from data on plants].
Ø, Denmark. 2Biodiversity and Climate Research Centre (BiK-F)
and Senckenberg Gesellschaft für Naturforschung, Sencken- gions, nested within 11 larger realms, and quan- Our classification of vertebrate assemblages
berganlage 25, 60325 Frankfurt, Germany. 3Department of Bio- tified phylogenetic relatedness among all pairs of into zoogeographic units exhibits some interest-
geography and Global Change, National Museum of Natural realms and regions (Fig. 1, figs. S1 and S2, and ing similarities with Wallace’s original classi-
Sciences, Consejo Superior de Investigaciones Científicas, Calle de tables S1 and S2). We also used pb to quantify fication, as well as some important differences
José Gutiérrez Abascal, 2, 28006 Madrid, Spain. 4Centro de
Investigação em Biodiversidade e Recursos Genéticos, Universi-
the uniqueness of regions, with the Australian (fig. S3). For example, Wallace classified islands
dade de É vora, Largo dos Colegiais, 7000 É vora, Portugal. (mean pb = 0.68), Madagascan (mean pb = 0.63), east of Borneo and Bali in his Australian region
5
Center for Macroecology, Evolution, and Climate, Natural History and South American (mean pb = 0.61) regions (fig. S3), which is analogous to our Oceanian and
Museum of Denmark, University of Copenhagen, 2100 being the most phylogenetically distinct assem- Australian realms combined (Fig. 1 and fig. S1).
Copenhagen Ø, Denmark. 6Department of Ecology and Evolution,
blages of vertebrates (Fig. 2). These evolutiona- In contrast, we find that at least some of these
Stony Brook University, Stony Brook, NY 11794–5245, USA.
7
Department of Vertebrate Zoology, MRC-116, National Mu- rily unique regions harbor radiations of species islands (e.g., Sulawesi) belong to our Oriental
seum of Natural History, Smithsonian Institution, Post Office from several clades that are either restricted to a realm, which spans Sundaland, Indochina, and
Box 37012, Washington, DC 20013–7012, USA. 8Biodiversity given region or found in only a few regions. India (Fig. 1 and fig. S1). Moreover, our Ocean-
Research Group, School of Geography and the Environment, Our combined taxa map (Fig. 1) contrasts ian realm is separate from the Australian realm and
Oxford University Centre for the Environment, South Parks Road,
Oxford OX1 3QY, UK. with some previously published global zoogeo- includes New Guinea together with the Pacific
*These authors contributed equally to this work.
graphic maps derived exclusively from data on Islands (14), whereas Wallace lumped these
†To whom correspondence should be addressed. E-mail: the distribution of vertebrate species (8, 9, 11). two biogeographic units into the Australian re-
jplessard@bio.ku.dk The key discrepancy between our classification gion. Wallace further argued that the Makassar
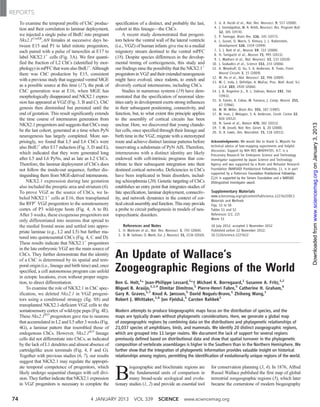
Fig. 1. Map of the terrestrial zoogeographic realms and regions of the world. lines group these regions into 11 broad-scale realms, which are named. Color
Zoogeographic realms and regions are the product of analytical clustering of differences depict the amount of phylogenetic turnover among realms. (For more
phylogenetic turnover of assemblages of species, including 21,037 species of details on relationships among realms, see the dendrogram and NMDS plot in
amphibians, nonpelagic birds, and nonmarine mammals worldwide. Dashed fig. S1.) Dotted regions have no species records, and Antarctica is not included in
lines delineate the 20 zoogeographic regions identified in this study. Thick the analyses.
www.sciencemag.org SCIENCE VOL 339 4 JANUARY 2013 75](data:image/gif;base64,R0lGODlhAQABAIAAAAAAAP///yH5BAEAAAAALAAAAAABAAEAAAIBRAA7)
Recomendados
Recomendados
Más contenido relacionado
La actualidad más candente
La actualidad más candente (20)
Destacado
Destacado (20)
Similar a An update of wallace´s zoogeographic regions of the world
Similar a An update of wallace´s zoogeographic regions of the world (20)
An update of wallace´s zoogeographic regions of the world
- 1. REPORTS To examine the temporal profile of ChC produc- specification of a distinct, and probably the last, 3. G. A. Ascoli et al., Nat. Rev. Neurosci. 9, 557 (2008). tion and their correlation to laminar deployment, cohort in this lineage—the ChCs. 4. J. Szentágothai, M. A. Arbib, Neurosci. Res. Program Bull. 12, 305 (1974). we injected a single pulse of BrdU into pregnant A recent study demonstrated that progeni- 5. P. Somogyi, Brain Res. 136, 345 (1977). Nkx2.1CreER;Ai9 females at successive days be- tors below the ventral wall of the lateral ventricle 6. L. Sussel, O. Marin, S. Kimura, J. L. Rubenstein, tween E15 and P1 to label mitotic progenitors, (i.e., VGZ) of human infants give rise to a medial Development 126, 3359 (1999). each paired with a pulse of tamoxifen at E17 to migratory stream destined to the ventral mPFC 7. S. J. Butt et al., Neuron 59, 722 (2008). label NKX2.1+ cells (Fig. 3A). We first quanti- 8. H. Taniguchi et al., Neuron 71, 995 (2011). (18). Despite species differences in the develop- 9. L. Madisen et al., Nat. Neurosci. 13, 133 (2010). fied the fraction of L2 ChCs (identified by mor- mental timing of corticogenesis, this study and 10. J. Szabadics et al., Science 311, 233 (2006). phology) in mPFC that were also BrdU+. Although our findings raise the possibility that the NKX2.1+ 11. A. Woodruff, Q. Xu, S. A. Anderson, R. Yuste, Front. there was ChC production by E15, consistent progenitors in VGZ and their extended neurogenesis Neural Circuits 3, 15 (2009). 12. W. Hu et al., Nat. Neurosci. 12, 996 (2009). with a previous study that suggested ventral MGE might have evolved, since rodents, to enrich and 13. M. C. Inda, J. DeFelipe, A. Muñoz, Proc. Natl. Acad. Sci. as a possible source at this time (17), the peak of diversify cortical interneurons, including ChCs. U.S.A. 103, 2920 (2006). ChC generation was at E16, when MGE has Studies in numerous systems (19) have dem- 14. J. B. Angevine Jr., R. L. Sidman, Nature 192, 766 morphologically disappeared and NKX2.1 expres- onstrated that the specification of neuronal iden- (1961). 15. A. Fairén, A. Cobas, M. Fonseca, J. Comp. Neurol. 251, sion has appeared at VGZ (Fig. 3, B and C). ChC tities early in development exerts strong influences 67 (1986). genesis then diminished but persisted until the in their subsequent positioning, connectivity, and 16. M. W. Miller, Brain Res. 355, 187 (1985). end of gestation. This result significantly extends function, but, to what extent this principle applies 17. M. Inan, J. Welagen, S. A. Anderson, Cereb. Cortex 22, the time course of interneuron generation from to the assembly of cortical circuits has been 820 (2012). 18. N. Sanai et al., Nature 478, 382 (2011). Downloaded from www.sciencemag.org on January 3, 2013 NKX2.1 progenitors and suggests that ChCs may unclear. Here, we discovered that young chande- 19. T. M. Jessell, Nat. Rev. Genet. 1, 20 (2000). be the last cohort, generated at a time when PyN lier cells, once specified through their lineage and 20. D. A. Lewis, Dev. Neurobiol. 71, 118 (2011). neurogenesis has largely completed. More sur- birth time in the VGZ, migrate with a stereotyped prisingly, we found that L5 and L6 ChCs were route and achieve distinct laminar patterns before Acknowledgments: We would like to thank G. Miyoshi for also BrdU+ after E17 induction (Fig. 3, D and E), innervating a subdomain of PyN AIS. Therefore, technical advice of fate-mapping experiments and helpful discussion. Support by NIH R01 MH094705. H.T. is a which indicated that they were generated long interneurons with a distinct identity are likely Precursory Research for Embryonic Science and Technology after L5 and L6 PyNs, and as late as L2 ChCs. endowed with cell-intrinsic programs that con- investigator supported by Japan Science and Technology Therefore, the laminar deployment of ChCs does tribute to their subsequent integration into their Agency and was supported by a Brain and Behavior Research not follow the inside-out sequence, further dis- destined cortical networks. Deficiencies in ChCs Foundation (NARSAD) Postdoctoral Fellowship. J.L. is in part supported by a Patterson Foundation Postdoctoral Fellowship. tinguishing them from MGE-derived interneurons. have been implicated in brain disorders, includ- Z.J.H. is supported by the Simons Foundation and a NARSAD NKX2.1 expression during late gestation ing schizophrenia (20). Genetic targeting of ChCs Distinguished Investigator award. also included the preoptic area and striatum (6). establishes an entry point that integrates studies of To prove VGZ as the source of ChCs, we la- fate specification, laminar deployment, connectiv- Supplementary Materials beled NKX2.1+ cells at E16, then transplanted ity, and network dynamics in the context of cor- www.sciencemag.org/cgi/content/full/science.1227622/DC1 Materials and Methods the RFP+ VGZ progenitors to the somatosensory tical circuit assembly and function. This may provide Figs. S1 to S8 cortex of P3 wild-type hosts (Fig. 4, A to B). a probe to circuit pathogenesis in models of neu- Tables S1 and S2 After 3 weeks, these exogenous progenitors not ropsychiatric disorders. References (21, 22) Movie S1 only differentiated into neurons that spread to the medial frontal areas and settled into appro- References and Notes 18 July 2012; accepted 1 November 2012 priate laminae (e.g., L2 and L5) but further ma- 1. H. Markram et al., Nat. Rev. Neurosci. 5, 793 (2004). Published online 22 November 2012; 2. D. M. Gelman, O. Marín, Eur. J. Neurosci. 31, 2136 (2010). 10.1126/science.1227622 tured into quintessential ChCs (Fig. 4, C and D). These results indicate that NKX2.1+ progenitors in the late embryonic VGZ are the main source of ChCs. They further demonstrate that the identity of a ChC is determined by its spatial and tem- An Update of Wallace’s poral origin (i.e., lineage and birth time) and, once specified, a cell autonomous program can unfold Zoogeographic Regions of the World in ectopic locations, even without proper migra- tion, to direct differentiation. Ben G. Holt,1* Jean-Philippe Lessard,1*† Michael K. Borregaard,1 Susanne A. Fritz,1,2 To examine the role of NKX2.1 in ChC spec- Miguel B. Araújo,1,3,4 Dimitar Dimitrov,5 Pierre-Henri Fabre,5 Catherine H. Graham,6 ification, we deleted Nkx2.1 in VGZ progeni- Gary R. Graves,1,7 Knud A. Jønsson,5 David Nogués-Bravo,1 Zhiheng Wang,1 tors using a conditional strategy (fig. S8) and Robert J. Whittaker,1,8 Jon Fjeldså,5 Carsten Rahbek1 transplanted NKX2.1-deficient VGZ cells to the somatosensory cortex of wild-type pups (Fig. 4E). Modern attempts to produce biogeographic maps focus on the distribution of species, and the These Nkx2.1KO progenitors gave rise to neurons maps are typically drawn without phylogenetic considerations. Here, we generate a global map that accumulated in L2 and L5 after 3 weeks (Fig. of zoogeographic regions by combining data on the distributions and phylogenetic relationships of 4G), a laminar pattern that resembled those of 21,037 species of amphibians, birds, and mammals. We identify 20 distinct zoogeographic regions, endogenous ChCs. However, Nkx2.1KO lineage which are grouped into 11 larger realms. We document the lack of support for several regions cells did not differentiate into ChCs, as indicated previously defined based on distributional data and show that spatial turnover in the phylogenetic by the lack of L1 dendrites and almost absence of composition of vertebrate assemblages is higher in the Southern than in the Northern Hemisphere. We cartridgelike axon terminals (Fig. 4, F and G). further show that the integration of phylogenetic information provides valuable insight on historical Together with previous studies (6, 7), our results relationships among regions, permitting the identification of evolutionarily unique regions of the world. suggest that NKX2.1 may regulate the appropri- ate temporal competence of progenitors, which iogeographic and bioclimatic regions are for conservation planning (3, 4). In 1876, Alfred likely undergo sequential changes with cell divi- sion. They further indicate that NKX2.1 expression in VGZ progenitors is necessary to complete the B the fundamental units of comparison in many broad-scale ecological and evolu- tionary studies (1, 2) and provide an essential tool Russel Wallace published the first map of global terrestrial zoogeographic regions (5), which later became the cornerstone of modern biogeography 74 4 JANUARY 2013 VOL 339 SCIENCE www.sciencemag.org
- 2. REPORTS (3). Using existing knowledge of his time (6), opportunity now exists to use phylogenetic in- of zoogeographic regions and these previous mostly on the distributions and taxonomic rela- formation for grouping assemblages of species classifications is the lack of support for previ- tionships of broadly defined vertebrate families, into biogeographic units on a global scale. In ad- ous Palearctic boundaries, which restricted this Wallace divided the world into six terrestrial dition to permitting a sound delimitation of bio- biogeographic region to the higher latitudes of zoogeographic units largely delineated by what we geographic regions, phylogenetic information the Eastern Hemisphere. The regions of central now know as the continental plates. Despite rely- allows quantifying phylogenetic affinities among and eastern Siberia are phylogenetically more ing on limited information and lacking a statistical regions (e.g., 10). Newly developed statistical similar to the arctic parts of the Nearctic region, basis, Wallace’s original map is still in use today. frameworks facilitate the transparent character- as traditionally defined, than to other parts of Wallace’s original zoogeographic regional- ization of large biogeographic data sets while min- the Palearctic (fig. S2). As a result, our newly ization scheme considered ancestral relationships imizing the need for subjective decisions (11). defined Palearctic realm extends across the among species, but subsequent schemes generally Here, we delineated the terrestrial zoogeo- arctic and into the northern part of the Western used data only on the contemporary distribu- graphic realms and regions of the world (12) by Hemisphere (Fig. 1 and fig. S1). These results tions of species without explicitly considering integrating data on the global distributions and bear similarities with the zoogeographic map of phylogenetic relationships (7–9). Phylogenetic phylogenetic relationships of the world’s am- (11) derived from data on the global distribution trees contain essential information on the evolu- phibians (6110 species), nonpelagic birds (10,074 of mammal families. In addition, our results sug- tionary relationships of species and have be- species), and nonmarine mammals (4853 species), gest that the Saharo-Arabian realm is interme- come increasingly available in recent decades, a total of 21,037 vertebrates species [see (13) for diate between the Afrotropical and Sino-Japanese permitting the delineation of biogeographic re- details]. Pairwise phylogenetic beta diversity (pb) realms [see the nonmetric multidimensional scaling Downloaded from www.sciencemag.org on January 3, 2013 gions as originally envisioned by Wallace. The metrics were used to quantify change in phyloge- (NMDS) plot in fig. S2]. Finally, we newly define netic composition among species assemblages the Panamanian, Sino-Japanese, and Oceanian 1 Center for Macroecology, Evolution, and Climate, Depart- across the globe. Analyses of combined taxa pb realms [but see the Oceanian realm of Udvardy ment of Biology, University of Copenhagen, 2100 Copenhagen values identified a total of 20 zoogeographic re- in (14) derived from data on plants]. Ø, Denmark. 2Biodiversity and Climate Research Centre (BiK-F) and Senckenberg Gesellschaft für Naturforschung, Sencken- gions, nested within 11 larger realms, and quan- Our classification of vertebrate assemblages berganlage 25, 60325 Frankfurt, Germany. 3Department of Bio- tified phylogenetic relatedness among all pairs of into zoogeographic units exhibits some interest- geography and Global Change, National Museum of Natural realms and regions (Fig. 1, figs. S1 and S2, and ing similarities with Wallace’s original classi- Sciences, Consejo Superior de Investigaciones Científicas, Calle de tables S1 and S2). We also used pb to quantify fication, as well as some important differences José Gutiérrez Abascal, 2, 28006 Madrid, Spain. 4Centro de Investigação em Biodiversidade e Recursos Genéticos, Universi- the uniqueness of regions, with the Australian (fig. S3). For example, Wallace classified islands dade de É vora, Largo dos Colegiais, 7000 É vora, Portugal. (mean pb = 0.68), Madagascan (mean pb = 0.63), east of Borneo and Bali in his Australian region 5 Center for Macroecology, Evolution, and Climate, Natural History and South American (mean pb = 0.61) regions (fig. S3), which is analogous to our Oceanian and Museum of Denmark, University of Copenhagen, 2100 being the most phylogenetically distinct assem- Australian realms combined (Fig. 1 and fig. S1). Copenhagen Ø, Denmark. 6Department of Ecology and Evolution, blages of vertebrates (Fig. 2). These evolutiona- In contrast, we find that at least some of these Stony Brook University, Stony Brook, NY 11794–5245, USA. 7 Department of Vertebrate Zoology, MRC-116, National Mu- rily unique regions harbor radiations of species islands (e.g., Sulawesi) belong to our Oriental seum of Natural History, Smithsonian Institution, Post Office from several clades that are either restricted to a realm, which spans Sundaland, Indochina, and Box 37012, Washington, DC 20013–7012, USA. 8Biodiversity given region or found in only a few regions. India (Fig. 1 and fig. S1). Moreover, our Ocean- Research Group, School of Geography and the Environment, Our combined taxa map (Fig. 1) contrasts ian realm is separate from the Australian realm and Oxford University Centre for the Environment, South Parks Road, Oxford OX1 3QY, UK. with some previously published global zoogeo- includes New Guinea together with the Pacific *These authors contributed equally to this work. graphic maps derived exclusively from data on Islands (14), whereas Wallace lumped these †To whom correspondence should be addressed. E-mail: the distribution of vertebrate species (8, 9, 11). two biogeographic units into the Australian re- jplessard@bio.ku.dk The key discrepancy between our classification gion. Wallace further argued that the Makassar Fig. 1. Map of the terrestrial zoogeographic realms and regions of the world. lines group these regions into 11 broad-scale realms, which are named. Color Zoogeographic realms and regions are the product of analytical clustering of differences depict the amount of phylogenetic turnover among realms. (For more phylogenetic turnover of assemblages of species, including 21,037 species of details on relationships among realms, see the dendrogram and NMDS plot in amphibians, nonpelagic birds, and nonmarine mammals worldwide. Dashed fig. S1.) Dotted regions have no species records, and Antarctica is not included in lines delineate the 20 zoogeographic regions identified in this study. Thick the analyses. www.sciencemag.org SCIENCE VOL 339 4 JANUARY 2013 75
- 3. REPORTS Downloaded from www.sciencemag.org on January 3, 2013 Fig. 2. Map of evolutionary uniqueness for terrestrial zoogeographic to which each region differs from all other regions based on mean pairwise regions of the world based on data for 21,037 species of vertebrates. pb. Regions colored in dark red are the most evolutionarily unique. Dotted Evolutionary uniqueness is calculated as the mean of pairwise pb values regions have no species records, and Antarctica is not included in the between the focal region and all other regions. Colors indicate the degree analyses. Strait between Borneo and Sulawesi, now known Fig. 3. Maps of terrestrial as “Wallace’s Line” (15), was a major barrier to zoogeographic regions of dispersal that greatly inhibited exchanges between the world based on data the Australian and Asian land masses. Much for (A) amphibians (6110 debate subsequently arose regarding the precise species), (B) birds (10,074 location of the principal faunal divide between species), and (C) nonma- Wallace’s Oriental and Australian realms (15) rine mammals (4853 spe- (see fig. S3 for an illustration of Wallace’s original cies). Color differences line). Our combined taxa analyses lend the stron- depict the relative amount gest support to the hypothesis of Weber (16), who of phylogenetic turnover among regions within each positioned this boundary east of Sulawesi, corre- taxonomic clade. (For more sponding to the zoogeographic boundary sepa- details on relationships rating our Oriental and Oceanian realms (Fig. 1 among regions, see the and fig. S1). However, our taxon-specific geo- dendrogram and NMDS graphic delineation for birds is more consistent plots in fig. S4, A to C.) with Wallace’s line than Weber’s line (Fig. 3A Dotted regions have no and figs. S3 and S4A). species records, and Ant- The delineation of and relationships among arctica is not included in our zoogeographic regions differ among taxa the analyses. (Fig. 3 and fig. S4), and we find more regions for mammals (n = 34 regions) than for amphibians or birds (both n = 19 regions). A comparison of pb matrices across the three vertebrate taxa reveals that amphibian assemblages located in the northeastern Arctico-Siberian, southern Afri- can, and Madagascan regions are more phyloge- netically distinct than those of birds or mammals for the same regions (fig. S5). Moreover, the Australian region harbors more phylogenetically distinct assemblages of amphibians and mam- mals relative to birds (fig. S5). Using a partial Mantel test [see (13) for details on this analysis], which accounts for geographic distances among species assemblages (17), we find that global pb spatial patterns of phylogenetic turnover among The contrast between our zoogeographic values for birds and mammals are more strongly vertebrate classes might result from lower dis- regions with regions based only on distribution- correlated (r = 0.68, P < 0.001) than for am- persal ability (19) and greater sensitivity of al data (Fig. 4) demonstrates the consequences phibians and birds (r = 0.39, P < 0.001) or am- amphibians to environmental conditions (20). In- of incorporating phylogenetic information in the phibians and mammals (r = 0.43, P < 0.001). terestingly, previous comparative studies docu- delineation of zoogeographic units. Relative to These results might partly reflect a major episode mented similar incongruence in the diversity and expectations based on turnover of species, spa- of diversification early in the evolutionary history distribution of amphibians relative to that of birds tial turnover in the phylogenetic composition of of amphibians (18). Alternatively, differences in and mammals (21, 22). assemblages of species is generally low in the 76 4 JANUARY 2013 VOL 339 SCIENCE www.sciencemag.org
- 4. REPORTS Downloaded from www.sciencemag.org on January 3, 2013 Fig. 4. Combined (A) and taxon-specific (B to D) maps illustrating the and the regional assignment of all other grid cells results from differences in degree of phylogenetic turnover relative to the turnover of species observed pb relative to beta diversity. Red colors indicate regions with a high degree among zoogeographic regions based on data for species of (A) amphibians, of phylogenetic differentiation relative to compositional differentiation, (B) birds, and (C) nonmarine mammals. The color scale depicts the degree to whereas blue colors indicate the opposite. Dotted regions have no species’ which faunal turnover between the regional assignment of the focal grid cell records, and Antarctica is not included in the analyses. Northern Hemisphere, whereas the opposite is ades regarding our knowledge of the distribu- 8. Ş Procheş, S. Ramdhani, Bioscience 62, 260 (2012). . true in the Southern Hemisphere (Fig. 4A). In tion and phylogeny of vertebrates and can be 9. C. H. Smith, J. Biogeogr. 10, 455 (1983). 10. C. H. Graham, P. V. A. Fine, Ecol. Lett. 11, 1265 (2008). particular, amphibians exhibit low spatial turn- used to elucidate the forces and historical events 11. H. Kreft, W. Jetz, J. Biogeogr. 37, 2029 (2010). over in phylogenetic composition relative to their responsible for the formation of the biogeo- 12. A. R. Wallace and his contemporary W. L. Sclater used turnover in the composition of species between graphic realms and regions we recognize today. the terms “region” to denote six main zoogeographical the North American and Eurasian regions (Fig. 4B; Our delineation of the zoogeographic realms units at a global scale and “subregion” to denote finer scale subdivisions. Wallace’s and Sclater’s regions and also compare fig. S4A with fig. S6A). Higher and regions of the world, and especially that of subregions are roughly equivalent to the realms and phylogenetic uniqueness in the Southern than in the realms, appears robust to the type and quality regions proposed here. The work of Sclater was published the Northern Hemisphere is consistent with long- of distributional and phylogenetic data used [see in The Geographical Journal (1894–1897). term isolation having left a pervasive signature (13) for details]. Inclusion of additional phyloge- 13. Materials and methods are available as supplementary materials on Science Online. on species assemblages, where oceanic barriers netic information on branch length or improved 14. M. D. F. Udvardy, A Classification of the Biogeographic have limited dispersal between continents (23, 24). resolution of the phylogenetic trees has the Provinces of the World, Occasional Paper no. 18 In the Northern Hemisphere, the newly defined potential to facilitate a finer delineation of regions (International Union for Conservation of Nature, Morges, boundaries of the Palearctic realm might reflect within our realms. The inclusion of data (when Switzerland, 1975). 15. E. Mayr, Q. Rev. Biol. 19, 1 (1944). the continuous presence of nonglaciated tundra they become available) on reptiles, invertebrates, 16. M. Weber, Der Indo-Australische Archipel und die in eastern Siberia and Beringia (25), whereas the and/or plants may also affect the boundaries of Geschichte Seiner Tierwelt (Gustav Fischer Verlag, Jena, subtle differences in the phylogenetic compo- our realms and regions and the relationships Germany, 1902). sition of assemblages over the Northern Hemi- among them. Nevertheless, the maps presented 17. N. Mantel, Cancer Res. 27, 209 (1967). sphere as a whole might be a consequence of a here delineate robust zoogeographic units for 18. K. Roelants et al., Proc. Natl. Acad. Sci. U.S.A. 104, 887 (2007). high degree of connectivity and range dynamics. vertebrates that can be scaled within specific con- 19. M. Munguía, C. Rahbek, T. F. Rangel, J. A. F. Diniz-Filho, Low rates of extinctions resulting from greater tinents and/or taxonomic clades. Due to these M. B. Araújo, PLoS ONE 7, e34420 (2012). climatic stability in the Southern Hemisphere could qualities, our analytical approach and zoogeo- 20. L. B. Buckley, W. Jetz, Proc. Natl. Acad. Sci. U.S.A. 105, also have contributed to this pattern by allowing graphic maps provide a baseline for a wide variety 17836 (2008). 21. S. A. Fritz, C. Rahbek, J. Biogeogr. 39, 1373 (2012). species that belong to ancient clades to persist of comparative ecological, biogeographic, evolu- 22. R. Grenyer et al., Nature 444, 93 (2006). through time (26, 27). tionary, and conservation-based studies (3, 22, 29). 23. J. Cracraft, Proc. Biol. Sci. 268, 459 (2001). Our maps of zoogeographic realms and re- 24. P. Upchurch, Trends Ecol. Evol. 23, 229 (2008). gions provide a broad overview of the distribution References and Notes 25. J. R. M. Allen et al., Quat. Sci. Rev. 29, 2604 (2010). of the world’s amphibians, birds, and nonma- 1. M. D. Crisp et al., Nature 458, 754 (2009). 26. J. Fjeldså, E. Lambin, B. Mertens, Ecography 22, 63 (1999). 2. S. R. Loarie et al., Nature 462, 1052 (2009). 27. B. Sandel et al., Science 334, 660 (2011). rine mammals, allowing the identification of ge- 3. R. J. Ladle, R. J. Whittaker, Conservation Biogeography 28. Downloadable maps of zoogeographic realms and regions ographic areas harboring distinct evolutionary (Wiley-Blackwell, Chichester, UK, 2011). for visualization in GIS and Google Earth can be found at histories [see (28) for links to downloadable maps 4. M. V. Lomolino, B. R. Riddle, R. J. Whittaker, J. H. Brown, http://macroecology.ku.dk/resources/wallace. of zoogeographic realms and regions for projec- Biogeography (Sinauer Associates, Sunderland, MA, ed. 4, 2010). 29. K. A. Wilson, M. F. McBride, M. Bode, H. P. Possingham, 5. A. R. Wallace, The Geographical Distribution of Animals Nature 440, 337 (2006). tion in GIS (geographic information systems) (Cambridge Univ. Press, Cambridge, 1876). mapping software and Google Earth]. These 6. P. L. Sclater, J. Proc. Linn. Soc. Lond. 2, 130 (1858). Acknowledgments: We thank the Danish National Research maps reflect major advances made in recent dec- 7. D. M. Olson et al., Bioscience 51, 933 (2001). Foundation for its support of the Center for Macroecology, www.sciencemag.org SCIENCE VOL 339 4 JANUARY 2013 77
- 5. REPORTS Evolution, and Climate. B.G.H. also thanks the Marie Curie compilations. We thank the International Union for Conservation Figs. S1 to S11 Actions under the Seventh Framework Programme of Nature and Natural Resources for making the amphibian Tables S1 to S5 (PIEF-GA-2009-252888). M.B.A. also thanks the and mammal range data available. Data are archived at Appendices S1 and S2 Spanish Research Council (CSIC) for support, and S.A.F. http://macroecology.ku.dk/resources/wallace. References (30–729) thanks the Landes-Offensive zur Entwicklung Wissenschaftlich-Ökonomischer Exzellenz program of Supplementary Materials Hesse’s Ministry of Higher Education, Research, and the www.sciencemag.org/cgi/content/full/339/6115/74/DC1 1 August 2012; accepted 15 November 2012 Arts. We thank L. Hansen for help with data and reference Materials and Methods 10.1126/science.1228282 growth of an elongated keratinized epidermal Crocodile Head Scales Are Not structure (hairs or feathers) (3). However, scales in reptiles do not form true follicles and might Developmental Units But Emerge not develop from placodes (4). Instead, reptilian scales originate in the embryo from regular dermo- from Physical Cracking epidermal elevations (1). Whereas the regular spatial organization of scales on the largest por- tion of the reptilian body is determined by a RDM, Michel C. Milinkovitch,1* Liana Manukyan,1 Adrien Debry,1 Nicolas Di-Poï,1 Samuel Martin,2 additional positional cues are likely involved in Daljit Singh,3 Dominique Lambert,4 Matthias Zwicker3 Downloaded from www.sciencemag.org on January 3, 2013 the development of the scale plates present on the head of many snakes and lizards. These head Various lineages of amniotes display keratinized skin appendages (feathers, hairs, and scales) that scales form a predictable symmetrical pattern differentiate in the embryo from genetically controlled developmental units whose spatial (Fig. 1A) and provide mechanical protection. organization is patterned by reaction-diffusion mechanisms (RDMs). We show that, contrary to skin The face and jaws of crocodilians are covered appendages in other amniotes (as well as body scales in crocodiles), face and jaws scales of by polygonal scales (hereafter called “head scales”) crocodiles are random polygonal domains of highly keratinized skin, rather than genetically that are strictly adjoining and nonoverlapping, controlled elements, and emerge from a physical self-organizing stochastic process distinct from but these polygons are irregular and their spatial RDMs: cracking of the developing skin in a stress field. We suggest that the rapid growth of the distribution seems largely random (Fig. 1, B crocodile embryonic facial and jaw skeleton, combined with the development of a very keratinized and C). Using high-resolution three-dimensional skin, generates the mechanical stress that causes cracking. (3D) geometry and texture reconstructions (5–7), mniotes exhibit a keratinized epidermis share some signaling pathways, it is unclear A 1 Laboratory of Artificial and Natural Evolution (LANE), Depart- preventing water loss and skin append- whether mammalian hairs, avian feathers and ment of Genetics and Evolution, University of Geneva, Sciences ages that play major roles in thermoregu- feet scales, and reptilian scales are homologous III, 30, Quai Ernest-Ansermet, 1211 Geneva, Switzerland. 2La lation, photoprotection, camouflage, behavioral or if some of them evolved convergently (1). In Ferme aux Crocodiles, Pierrelatte, France. 3Computer Graphics Group, University of Bern, Switzerland. 4Department of Math- display, and defense against predators. Whereas birds and mammals, a reaction-diffusion mech- ematics and Namur Center for Complex Systems, University of mammals and birds evolved hairs and feathers, anism (RDM) (2) generates a spatial pattern of Namur, Belgium. respectively, reptiles developed various types of placodes that develop and differentiate into fol- *To whom correspondence should be addressed. E-mail: scales. Although their developmental processes licular organs with a dermal papilla and cycling michel.milinkovitch@unige.ch Fig. 1. Spatial distribu- tion of head scales. (A) Head scales in most snakes (here, a corn snake) are polygons (two upper pan- els) with stereotyped spa- tial distribution (two lower panels): left (yellow) and right (red) scale edges overlap when reflected across the sagittal plane (blue). (B) Polygonal head scales in crocodiles have a largely random spatial distribution without sym- metrical correspondence between left and right. (C) Head scales from dif- ferent individuals have different distributions of scales’ sizes and localiza- tions (blue and red edges from top and bottom croc- odiles, respectively). 78 4 JANUARY 2013 VOL 339 SCIENCE www.sciencemag.org
- 6. www.sciencemag.org/cgi/content/full/science.1228282/DC1 Supplementary Materials for An Update of Wallace’s Zoogeographic Regions of the World Ben G. Holt, Jean-Philippe Lessard,* Michael K. Borregaard, Susanne A. Fritz, Miguel B. Araújo, Dimitar Dimitrov, Pierre-Henri Fabre, Catherine H. Graham, Gary R. Graves, Knud A. Jønsson, David Nogués-Bravo, Zhiheng Wang, Robert J. Whittaker, Jon Fjeldså, Carsten Rahbek *To whom correspondence should be addressed. E-mail: E-mail: jplessard@bio.ku.dk Published 20 December 2012 on Science Express DOI: 10.1126/science.1228282 This PDF file includes: Materials and Methods Figs. S1 to S11 Tables S1 to S5 Appendixes S1 and S2 References
- 7. 9 November 2012 Materials and Methods Distributional data The global distributions of all amphibians and terrestrial mammals were based on IUCN Global Assessment distributional data for native ranges, with undescribed or taxonomically ambiguous species excluded (30, 31). Distributional data for species of birds were extracted from a comprehensive global geographic range database for all land and non-pelagic species (32). In this database, the geographic range of each species was mapped at a resolution of 1o × 1o latitude- longitude grid cells following the approach outlined in (33, 34) and in (34-36). Maps represent a conservative extent-of-occurrence of the breeding ranges based on museum specimens, published sight records, and spatial distribution of habitats between documented records, which have subsequently been validated by ornithological experts. Data from more than 1600 references have been used to map distributions of species of birds included in the current article (list of references available in Supplementary Material Appendix S1). The distributions of species were matched to the global taxonomies provided by (37), (38) and (39) following procedures in (40) for mammals and in (21) for amphibians. All distributions were mapped in 2o × 2o latitude-longitude grid cells. Specific occurrences in grid cells were used to produce a presence/absence matrix with names of species as columns and grid cells as rows. Species that did not occur in both the distribution data and the phylogenies were removed. Consequently, 323 species were removed from the amphibian phylogeny, 309 from the mammalian distributional data and 167 from the mammalian phylogeny. All further analyses were based on distributional and phylogenetic data for 6,110 species of amphibians, 10,074 species of birds and 4,853 species of mammals. Note that no records for non- marine vertebrate species occurred in Antarctica, which is consistent with previous similar studies (8). This region is therefore not included in our analyses. Phylogenetic data The amphibian phylogeny consisted of a generic-level supertree, with all species added as generic- level polytomies (21), updated according to the latest, species-level amphibian phylogeny (41), which contains only 2,871 species. Species that were not included in (41) were kept in the same lineages as in (21). Topological differences in (41) with bootstrap support less than 50% were not implemented and topology from (21) was retained. The avian phylogeny was similarly constructed as a supertree, but was resolved to the specific level; incorporating hundreds of molecular phylogenies published before summer 2011 (see Supplementary Material Appendix S2 for a full description). Disagreement between source phylogenies was reflected as polytomies, and the final tree was 61% resolved (Fig. S7) The mammal phylogeny consisted of the supertree used in (42), which is an updated version of the tree in (43) and based on taxonomy from (39). Since only the mammal phylogeny included branch length estimates, branch lengths were set to one in all phylogenies for all analyses, in order to maintain consistency across taxa. Calculating phylogenetic beta diversity We conducted cluster analyses of assemblages of species for the purpose of delineating zoogeographic regions on pair-wise matrices of phylogenetic beta diversity (hereafter “pβ”). Values for pβ were calculated using a modified version of the β sim metric originally developed by (44) and later formalized by (45). The β sim metric is preferable to other beta diversity metrics because it is insensitive to differences in species richness among assemblages (45), thus providing unbiased estimation of compositional turnover among grid cells (11):
- 8. 9 November 2012 where a = the number of species shared between two grid cells and b and c represent the number of species unique to each grid cell. pβ measures were produced using the same equation as for β sim with the exception that shared and unique branches of the overall phylogeny were used rather than species. pβ sim values were calculated for all pair-wise combinations of grid cells to produce the distance matrices for cluster analysis. In order to compare our biogeographic delineation scheme incorporating phylogenetic information with a more traditional scheme based solely on distribution data, we also computed a non-phylogenetically based measure of beta-diversity, i.e. we calculated the β sim metric using only the distributional data. All analyses below were performed on both pβ sim and β sim matrices, but for simplicity, we used only the term pβ sim throughout the description of analyses. Preliminary analyses: choosing a clustering algorithm Analyses were performed using R statistical software (46) with the packages “ape” (47), “cluster” (48), “phylobase” (49) and “picante” (50). Analyses of pβ sim matrices were performed with two objectives: (i) defining the zoogeographic regions and (ii) describing relationships among the regions. In order to develop an analytical approach that best fulfills these two objectives, we sought to identify a clustering algorithm that performed well at both tasks. In accordance with the analytical framework of (11) for delineating biogeographic regions, we tested the performance of nine hierarchical clustering algorithms, using pβ sim matrices for all data sets, as well the non- hierarchical Partitioning Around Mediods (PAM) approach. After testing algorithm performance (see details below) the Unweighted Pair Group Means Algorithm (UPGMA) was selected for the final analysis (51). Objective one: defining zoogeographic regions Evaluation criterion: sum of between-cluster pβ sim / sum of total pβ sim Our zoogeographic regions were defined by grouping assemblages of species (i.e. grid cells) into regions (clusters). We adopted an approach that focuses on maximizing the explanatory power of the resulting cluster dendrogram. Clustering algorithms were evaluated by estimating which proportion of the sum of global pβ sim values was represented by between-cluster pβ sim values, for a given number of clusters. In addition to maximizing between-cluster pβ sim values, we sought to group species assemblages into as few regions as possible (ideally less than 50 in order to facilitate a workable overview of global patterns). For each of the nine clustering algorithms, we sequentially assessed the proportion (%) of global pβ sim explained by between-cluster pβ sim , and for all numbers of clusters ranging from two to 100 clusters (results are shown in Fig. S8; Note that only results for two to 40 clusters are shown). The threshold of 99% of global pβ sim values represented by between- cluster pβ sim was chosen as the highest possible natural cutoff point without returning an excessive number of clusters (over 50), following comparison of results at the 90%, 95%, 99% and 99.9% levels (Fig. S8). The best performing algorithms for defining these clusters were those which reached the 99% cutoff point with the lowest number of clusters. Objective two: describing relationships among zoogeographic regions Evaluation criterion: co-phenetic correlation coefficient The second objective was to describe the relationships among zoogeographic regions as accurately as possible, via a hierarchical dendrogram. In this case, algorithm performance was assessed using the co-phenetic correlation coefficient (52) as in (11),which reflects how well the original data are represented by the dendrogram. The calculation of a co-phenetic coefficient requires a pβ sim matrix and co-phenetic matrix derived from a hierarchical dendrogram. In this case, the pβ sim matrix consisted of the region-by-region matrix, obtained by calculating the mean of all pair-wise grid cell values observed between these clusters. Hierarchical dendrograms were then based on the region- by-region matrices using each of the nine clustering algorithms assessed for our first objective.
- 9. 9 November 2012 From these dendrograms, the co-phenetic matrix was obtained by calculating the branch length distances separating each pair of branch tips on the dendogram. The co-phenetic correlation score was then produced for each clustering algorithms as the Pearson product-moment correlation coefficient between the region-by-region pβ sim matrix (same for all analyses) and co-phenetic distance matrices (unique to each clustering algorithm). The results of these analyses showed that, generally, clustering algorithms that performed well for our first objective (Fig. S8) performed poorly for our second objective (Fig. S9). In particular, results from these performance tests showed that Ward’s algorithm, which outperformed all other algorithms for our first objective (Fig. S8), performed very poorly for our second objective (Fig. S9). In addition to the overall co-phenetic correlation coefficients used here to evaluate cluster algorithm performance, co-phenetic correlation coefficients were also produced for each specific cluster in order to evaluate the validity of the placement of each cluster within the dendrogram (i.e., contrasting pβsim between assemblage A and all other assemblages versus the distance on the UPGMA dendrogram). High co-phenetic values indicate strong support for the placement of the cluster whereas low values indicate weak support (see fig. S1, S2, S4 and S6). Clustering analyses and visual representation of zoogeographic units In order to choose a single clustering algorithm that performed well for both of our study objectives, we considered the performance of each algorithm across both evaluation criteria. Following examination of the evaluation results (Fig. S8 and S9), the UPGMA method was chosen as the best performing clustering algorithm overall. Global UPGMA dendrograms were thus produced to describe relationships among species assemblages. The results of the clustering performance evaluation for objective one were used to cut UPGMA dendrograms in order to return the minimum number of clusters required to obtain between-cluster pβ sim values totaling more than 95% of the sum total of all pβ sim values. These clusters of grid cells therefore represent the zoogeographic regions for each data set. A few regions produced by the UPGMA algorithm were extremely small (<10 grid cells, i.e. nine for the amphibian data, two for the bird data, one for the mammal data and two for the combined data). These small regions containing only a small number of small assemblages were inconsistent with our goal of identifying broad-scale zoogeographic units and were therefore removed in a manner consistent with (53) treatment of singletons. These grid cells were then merged with the most closely related remaining cluster. Ordination To provide a complimentary non-hierarchical description of cluster relationships (Fig. S1, S2, S4 & S6), regions were also plotted in a two-dimensional ordination using a neighbor-joining algorithm (Nonmetric Multidimensional Scaling; hereafter NMDS), following Kruskal’s method (54). The NMDS method is acknowledged among community ecologists as being a robust non-parametric method for the depiction of overall turnover values within a matrix in a low-dimensional space (55). NMDS plots were produced for all data sets using the region-by-region pβsim matrices for the UPGMA defined regions (produced as described in Objective two: describing relationships among zoogeographic regions). The axes of the resulting plots are in arbitrary units, where similar zoogeographic regions occur closer to one another in two-dimensional space and less similar regions occur farther apart. Illustration of clusters We illustrated faunal differences among zoogeographic realms and regions using a three- dimensional color scheme wherein color differences relate to faunal differences in multivariate ordination space (11). In order to select colors for plotting the clustering results (i.e. zoogeographic units), three-dimensional NMDS ordination was performed on the cluster pβ sim matrices. The ordinations were then plotted with each of the NMDS axes representing one of the three primary colors in standard RGB color space, ranging from 0 to 100% for each color. The final color for
- 10. 9 November 2012 each cluster was determined using primary color levels taken from the NMDS axes, and therefore the similarity of cluster colors reflects the level of pβ sim among clusters. These colors were used to plot clustering results on global maps, cluster relationship dendrograms, and on two-dimensional NMDS ordinations. Cross-taxon analysis In order to produce a combined map of our zoogeographic regions for vertebrates (Fig. 1 and Fig. S1), data for the three taxonomic groups (amphibians, birds and mammals) were combined by taking the mean pβ sim values across the groups and all grid cell comparisons, to produce a mean pβ sim matrix. A few pair-wise grid cell comparisons did not exist within the combined pβ sim matrix (< 0.003% of the total number of pair-wise comparisons) ― e.g., in cases where two of the three taxa occurred in one grid cell and the remaining taxon occurred only in the other grid cell. These cases were given a value of 1, representing complete turnover. The combined matrix was subsequently analyzed in precisely the same manner described above for the taxon-specific analyses. Defining zoogeographic realms For the cross-taxon analysis only, zoogeographical realms were produced in order to visualize larger scale patterns of biological organization in the distributions of clades and species. We defined zoogeographic realms by cutting the cross-taxon UPGMA dendrogram in order to return the minimum number of clusters required to obtain between-cluster pβ sim values totaling at least 90% of the global sum of pβ sim values. Cross-taxon comparison of pβ sim matrices We used Mantel’s correlation test (17) to assess the strength of the relationship in the geographic distribution of pβ sim values between each pair of taxa. In addition, we corrected for spatial autocorrelation by including Euclidean distances as a covariate in a Partial Mantel's test. We then examined partial r values to estimate the correlation between pβ sim matrices after accounting for geographic distances among species assemblages. Table S3 contrasts results from the correlation and partial correlation analyses. These results show that correlation coefficients are weaker, but still significant, after accounting for spatial autocorrelation. More importantly, when compared among taxa, correlation coefficients are proportional to partial correlation coefficients, such that the conclusions we outlined in the text remain valid. Comparison of phylo-distributional and distributional regionalization schemes We compared zoogeographic regions obtained using our phylogenetically-based scheme with those obtained using solely distributional data by comparing the pβ sim and β sim clustering results for the taxon-specific, as well as the combined matrices (Fig. 4). To compare pβ sim and β sim schemes, the “distinctiveness” of a grid cell for each scheme was calculated as the mean pairwise pβ sim /β sim distance between that grid cell and all other grid cells according to the region-by-region matrices (see Inferring relationships among regions). Therefore comparisons of grid cells belonging to the same region returned a distance of 0, whereas comparisons of grid cells in different regions returned the mean distance between those two regions. We obtained standardized values of distinctiveness by dividing the observed value with the mean values of all grid cells for that clustering scheme. Difference values representing the difference between pβ sim and β sim clustering results were then calculated by subtracting β sim -based distinctiveness values from the pβ sim -based distinctiveness values. The resulting difference values are standardized to have a mean of zero with high values indicating that a grid cell is more distinctive in the phylo-distributional scheme (pβ sim -based), and
- 11. 9 November 2012 low values indicating that a grid cell is more distinctive in the distribution-based scheme (β sim - based). Robustness of results to the choice of analytical approach We assessed the robustness of our results to the choice of analytical approach by repeating our cross-taxon analysis using two alternative clustering processes and redefining the global realms produced in the main analysis. In order to aid comparison of the different results the number of realms for all analyses was fixed to 11, the same number as in our original analysis. The two additional clustering algorithms chosen for comparison were the Ward’s minimum variance criterion (subsequently referred to as “Ward’s”) and Partitioning Around Medoids (PAM). Table S4 details the key characteristics of these two clustering algorithms plus the UPGMA method used in the main analysis. Ward’s minimum variance criterion Ward’s algorithm clearly outperformed other methods regarding our first evaluation criterion (sum of between cluster pβ sim / sum of total pβ sim, Fig. S8). For example, Ward’s created 34 regions for the cross-taxon data, the next best algorithm required 83 regions to reach the same cutoff point of 99% of pβ sim occurring between regions. However, for our second evaluation criterion (co-phenetic correlation coefficient, Fig. S9), Ward’s algorithm performed very poorly, and, for this reason, this algorithm was not considered for further analysis. In addition, the tendency of the Ward’s method to create roughly equal size clusters can be seen as a significant disadvantage at the scale of realms, forcing smaller but highly distinct areas (such as Madagascar) to be clustered with relatively unrelated regions. Figure S10A shows global cross-taxon realms produced using the Ward’s analytical method. Partitioning Around Medoids In an attempt to address the problems discussed above for the Ward’s method, whilst retaining the benefits of its performance according to our first evaluation criterion, we first defined our regions according to Ward’s method and subsequently clustered these regions into realms using the PAM method. Since the PAM method is non-hierarchical, it is not constrained to the assumption that regions are related in a hierarchical manner. Furthermore, the PAM method clusters regions based on their distance values (i.e. pβ sim ), rather than within cluster variance in the case of Ward’s method. It is therefore more capable of detecting small, highly distinct clusters. Figure S10B shows global combined taxon realms produced by clustering regions using the PAM method. Sensitivity analyses In order to assess the sensitivity of our results to the type of distributional and phylogenetic (or taxonomic) data used for our clustering analyses, we conducted a comparative study using the mammal data as a case study. Mammals were chosen as a test case because more of the relevant data (i.e. phylogenetic tree including branch length, taxonomy, distributional data in equal area grid cells) were available for this taxonomic group than for the other two. Three alternative input data types were tested: i) pβ sim values calculated using phylogenetic branch length information ii) taxoβ sim values calculated using taxonomic information iii) pβ sim values based on assemblages within equal area global grid cells These input data were produced as follows: Using phylogenetic branch length information
- 12. 9 November 2012 The phylogeny used in our mammalian analysis (43) is fully dated with branch lengths measured in millions of years. These branch lengths were equalized in our main analysis to ensure consistency with the amphibian and bird phylogenies. For this test analysis, branch length data were included by weighting the value of each branch in accordance with its length on the phylogenetic tree. Therefore a unique branch with a length of ten million years would have a value of ten in any pβ sim calculation (see Calculating phylogenetic beta diversity). All pairwise pβ sim values between mammalian species assemblages were recalculated following this approach. Clustering analyses was then performed on the resulting pairwise pβ sim matrix following our UPGMA-based protocol described above, with the exception that the number of clusters was fixed at 34 in order to facilitate visual comparison with the original 34 regions defined for the mammal data. Visual examination and comparison of the maps produced with and without branch lengths show only minor differences in the definition of regions as well as relationships among them (Fig. S11A and S11B). These differences include the separation of Australia into two regions rather than one, and the inclusion of the Philippines in the Oceanian region. It therefore appears that our results are considerably more sensitive to tree topology than to branch length. Nevertheless, the inclusion of phylogenetic information derived from trees with high resolution certainly has the potential to help refine our maps in particular regions. Using taxonomic information Phylogenetic data can be expected to be a more accurate reflection of inter-species evolutionary relationship than taxonomies (56). However, the extent to which taxonomy can be used as a surrogate data source (if phylogenetic data are absent or incomplete) is of interest for future studies. For this test analysis, taxoβ sim values were calculated, whereby all major taxonomic levels within an assemblage (species, genera, subfamilies, families, superfamilies, classes, infraorders, suborders and orders) were used instead of solely species (β sim ), or branch lengths (pβ sim ). Each taxonomic level was given equal weighting and therefore assemblages were assigned a score of one for every unique and shared taxonomic group they contained. The total of these values was then used within the β sim formula (see Calculating phylogenetic beta diversity), with a equal to total shared taxonomic groups and b & c equal to the unique taxonomic groups for each assemblage. All pairwise taxoβ sim were recalculated following this approach. Clustering analyses was then performed on the resulting pairwise, taxoβ sim matrix following our UPGMA-based protocol described above, with the exception that the number of clusters was fixed at 34 in order to facilitate visual comparison with the original 34 regions defined for the mammal data. Visual examination and comparison of the maps produced with a phylogenetic tree and versus a taxonomy show, once again, only minor differences in the definition of regions as well as relationships among them. Noticeable differences mostly relate to relative distances among regions rather than differences in the delineation of zoogeographic regions (Fig. S11A and S11C). In particular, assemblages in the Australian region appear less distinct from those in New Guinea when using taxoβ sim than with pβ sim . In contrast, assemblages in the Antillean region appear more distinct from those in Central and South America when using taxoβ sim than with pβ sim . These results are again not fundamentally different from our existing analysis, suggesting that taxonomy may indeed serve as a surrogate to phylogenetic tree in some instances. However, this interpretation must be made with care since taxonomies are constantly updated in the light of new phylogenetic studies and therefore the results for relatively well studied taxa such as mammals may not apply more generally. Mapping species ranges and range boundaries: defining species assemblages based on equal area grid cells or latitudinal-longitudinal cells Empirical knowledge of species occurrence exists in the form of locality records. They form the evidence basis for maps of species global distributions, which comes in three general categories:
- 13. 9 November 2012 1. Generalized maps of species global ranges that are compiled from reference works using small range map pictures published in commercial field guides and handbooks as primary sources. Such data are at least twice or trice removed from the raw data, and “methods, assumptions, and caveats expressed by the original authors, as well as an accounting of measurement and transcription error, are rarely presented in the secondary data source” (57). Such generalized maps are characterized by a high lack of precision in defining range boundaries and contain a prohibitive level of commission errors. The combination of these properties generates inaccurate species assemblages and species richness per grid cell. Such problems typically increase with decreasing grain size used in analyses. 2. Generalized maps of geographic ranges that are often compiled as above, but using some higher quality regional field guides and books and characterized by the fact that regional experts have quality-proofed these maps in greater details. Such range maps are major improvements relative to the maps in category 1, but still pose problems when defining range boundaries, and contain commission errors. The global range maps of the world’s mammals and amphibians used in our analyses are from this category and the best map of the kind currently available for these groups. 3. Maps of extent of occurrence of species that are generated from primary sources (using verified locality information from specimens collected in museums worldwide, published sight records and information from primarily-level scientific monographs) combined with spatial distribution of habitats between documented records. The derived maps are subsequently validated by taxonomic experts for each larger clade (33-36). Compared to the generalized range-maps in category 1 and 2, these extent-of-occurrence maps are less prone to transcription error. In addition, they often provide a higher accuracy in defining species distribution boundaries and reduce the risk of commission errors. The global maps on the world’s species of birds used in our analyses are of this category and based on >1600 references (see Supplementary Material Appendix S1 for a complete list), hundreds of museum’s collections and verified by world ornithological experts and for each individual taxonomic family. Species assemblages can be described using latitudinal-longitudinal grid cells, where cell area progressively increases somewhat from the equator to the poles. It has been shown that the effect of geographic variation in grid cell area on patterns of species richness is negligible (58, 59). The smaller grid cell area at high latitude, however, results in a slight increase in the number of grid cells with increasing latitude when using latitudinal-longitudinal grid cells. Equal-area gridded maps circumvent any potential issues that geographic differences in the number of grid cells may cause. The projection used to generate such maps, however, differs significantly from the non-equal area maps typically containing or describing the original distribution data. The transfer of such data to equal-area grids is highly problematic, particularly if the data originate from small range maps published in commercial field guides and other secondary literature sources. They are especially prevalent in topographically complex regions and geographic areas with dense aggregations of geographic range boundaries (33). Although range maps of category 1 and 2 are often drawn as polygons, and hence at least technically possible to sample into an equal-area grid, this transfer will likely introduce substantial error associated with commission errors and precision errors of range boundaries. Thus, although it has become more commonplace to use equal-area distributional data for analyses, it is not clear in such studies how the transfer of data from unequal area projections
- 14. 9 November 2012 was accomplished, how issues of commission and precision errors were tackled or how original locality data related to the subsequent description of species occurrences on equal-area maps. Despite these issues, we explored the consequences of converting the distributional data from unequal to equal area for mammals. We assessed the effect of using unequal area projection distributional data by projecting the mammalian distributional data to equal area grid cells. The resulting matrix contained 4,416 global Behrmann equal area projection grid cells (60). All pairwise pβ sim values between mammalian Behrmann equal area projection grid cells were recalculated following this approach. Clustering analyses was then performed on the resulting pairwise pβ sim matrix following our UPGMA-based protocol described above, with the exception that the number of clusters was fixed at 34 in order to facilitate visual comparison with the original 34 regions defined for the mammal data. We found no noticeable differences between results generated with the equal area data for mammals and the original results (Fig. S11A and S11D).
- 15. 9 November 2012 Fig. S1. Map, dendrogram and NMDS of cross-taxon zoogeographic realms based on phylo- distributional data for amphibian, bird and non-marine mammal species of the world. The map represents results of UPGMA clustering of global phylo beta diversity (pβ sim ) values for species assemblages in 2°× 2° grid cells. Grid cells are clustered into 11 realms, the minimum number required to result in the sum of between region pβ sim values accounting for over 90% of the sum total pβ sim . The dendrogram depicts relationships among realms and the pβ sim axis shows the degree of phylogenetic turnover between branches descending from a node. Note that the dendrogram depicts phylogenetic similarity among regions, which may not reflect shared evolutionary history or common ancestry. Realms colors produced by plotting results within three- dimensional standard RGB color space via a three dimensional NMDS ordination. Therefore the similarity of realms colors reflects the pβ sim of the clusters themselves. The human eye does not perceive RGB color differences with a high degree of accuracy and therefore inter-cluster relationships are also displayed using UPGMA dendrogram and a two-dimensional NMDS ordination. Stress values reflect the amount of error in the correlation between pairwise distances in the original pβ sim data matrix and a data matrix calculated from the NMDS plot with 0 representing no error and 1 indicating a complete lack of correlation.
- 16. 9 November 2012 Fig. S2. Global map, dendrogram and NMDS of cross-taxon zoogeographic regions based on phylo-distributional data for (A) amphibian (6,110 spp.), (B) bird (10,074 spp.) and (C) non- marine mammal (4,853 spp.). The map represents results of UPGMA clustering of global phylo beta diversity (pβsim) values for species assemblages in 2°× 2° grid cells. Grid cells are clustered into 20 regions, the minimum number required to result in the sum of between region pβsim values accounting for over 95% of the sum total pβsim. The dendrogram depicts relationships among regions and the pβsim axis shows the degree of phylogenetic turnover between branches descending from a node. Region colors produced by plotting results within three-dimensional standard RGB color space via a three dimensional NMDS ordination. Therefore the similarity of region colors reflects the pβsim of the clusters themselves. The human eye does not perceive RGB color differences with a high degree of accuracy and therefore inter-cluster relationships are also displayed using UPGMA dendrogram and a two-dimensional NMDS ordination. Co-phenetic correlation coefficients reflect of how well the data are represented by the UPGMA dendrogram, and are calculated as the strength of the correlation between pairwise distances in the original pβsim data matrix and a data matrix calculated from the dendrogram. The overall co-phenetic score (0.58) indicates how well the dendrogram represent relationships between regions generally and values next to the tips of the dendrogram represent region-specific co-phenetic scores. Similarly, stress values reflect the strength of the correlation between pairwise distances in the original pβsim data matrix and a data matrix calculated from the NMDS plot. Co-pehentic scores range between 0 and 1, where 0 indicates the lack of a correlation and 1 indicates a perfect correlation between matrices. Stress values reflect the amount of error in the correlation between pairwise distances in the original pβsim data matrix and a data matrix calculated from the NMDS plot, with 0 representing no error and 1 indicating a complete lack of correlation.
- 17. 9 November 2012 Fig. S3. Comparison our zoogeographic realms and regions with Wallace’s original zoogeographic regions and subregions. Our zoogeographic realms and regions are based on phylo-distributional data for species of amphibians, birds and terrestrial mammals whereas Wallace’s regions and subregions are based on distributional data for families and genera of (mostly) mammals. White lines delineate our zoogeographic realms (full) and regions (dashed) as illustrated in Fig. 1, and red lines delineate Wallace’s original regions (full) and subregions (dashed). Black lines delineate non-terrestrial biogeographic boundaries separating our proposed realms. Names in red correspond to Wallace’s original regions.
- 18. (A) AMPHIBIANS 9 November 2012 Fig. S4A. Global map, dendrogram and NMDS of taxon-specific zoogeographic regions based on phylo-distributional data for species of amphibians (6,100 spp). The map represents results of UPGMA clustering of global phylo beta diversity (pβsim) values for species assemblages in 2°× 2° grid cells. Grid cells are clustered into 19 regions, the minimum number required to result in the sum of between region pβsim values accounting for over 95% of the sum total pβsim. The dendrogram depicts relationships among regions and the pβsim axis shows the degree of phylogenetic turnover between branches descending from a node. Region colors produced by plotting results within three-dimensional standard RGB color space via a three dimensional NMDS ordination. Therefore the similarity of region colors reflects the pβsim of the clusters themselves. The human eye does not perceive RGB color differences with a high degree of accuracy and therefore inter-cluster relationships are also displayed using UPGMA dendrogram and a two- dimensional NMDS ordination. Co-pehentic scores range between 0 and 1, where 0 indicates the lack of a correlation and 1 indicates a perfect correlation between matrices. The overall co-phenetic score (0.80) indicates how well the dendrogram represent relationships between regions generally and values next to the tips of the dendrogram represent region-specific co-phenetic scores. Stress values reflect the amount of error in the correlation between pairwise distances in the original pβsim data matrix and a data matrix calculated from the NMDS plot, with 0 representing no error and 1 indicating a complete lack of correlation.
- 19. 9 November 2012 Fig. S4B. Global map, dendrogram and NMDS of taxon-specific zoogeographic regions based on phylo-distributional data for species of birds (10,074 spp.). The map represents results of UPGMA clustering of global phylo beta diversity (pβsim) values for species assemblages in 2°× 2° grid cells. Grid cells are clustered into 19 regions, the minimum number required to result in the sum of between region pβsim values accounting for over 95% of the sum total pβsim. The dendrogram depicts relationships among regions and the pβsim axis shows the degree of phylogenetic turnover between branches descending from a node. Region colors produced by plotting results within three-dimensional standard RGB color space via a three dimensional NMDS ordination. Therefore the similarity of region colors reflects the pβsim of the clusters themselves. The human eye does not perceive RGB color differences with a high degree of accuracy and therefore inter-cluster relationships are also displayed using UPGMA dendrogram and a two- dimensional NMDS ordination. Co-pehentic scores range between 0 and 1, where 0 indicates the lack of a correlation and 1 indicates a perfect correlation between matrices. The overall co-phenetic score (0.68) indicates how well the dendrogram represent relationships between regions generally and values next to the tips of the dendrogram represent region-specific co-phenetic scores. Stress values reflect the amount of error in the correlation between pairwise distances in the original pβsim data matrix and a data matrix calculated from the NMDS plot, with 0 representing no error and 1 indicating a complete lack of correlation.
- 20. (C) MAMMALS 9 November 2012 Fig. S4C. Global map, dendrogram and NMDS of taxon-specific zoogeographic regions based on phylo-distributional data for species of non-marine mammals (4,853 spp.). The map represents results of UPGMA clustering of global phylo beta diversity (pβsim) values for species assemblages in 2°× 2° grid cells. Grid cells are clustered into 34 regions, the minimum number required to result in the sum of between region pβsim values accounting for over 95% of the sum total pβsim. The dendrogram depicts relationships among regions and the pβsim axis shows the degree of phylogenetic turnover between branches descending from a node. Region colors produced by plotting results within three-dimensional standard RGB color space via a three dimensional NMDS ordination. Therefore the similarity of region colors reflects the pβsim of the clusters themselves. The human eye does not perceive RGB color differences with a high degree of accuracy and therefore inter-cluster relationships are also displayed using UPGMA dendrogram and a two-dimensional NMDS ordination. Co-pehentic scores range between 0 and 1, where 0 indicates the lack of a correlation and 1 indicates a perfect correlation between matrices. The overall co- phenetic score (0.77) indicates how well the dendrogram represent relationships between regions generally and values next to the tips of the dendrogram represent region-specific co-phenetic scores. Stress values reflect the amount of error in the correlation between pairwise distances in the original pβsim data matrix and a data matrix calculated from the NMDS plot, with 0 representing no error and 1 indicating a complete lack of correlation.
- 21. 9 November 2012 Fig. S5. Cross-taxon comparison of global phylogenetic beta diversity values. Colors indicate for each grid cell the difference in mean phylo beta diversity (pβsim) values between (A) amphibians and birds, (B) amphibians and mammals and (C) birds and mammals.
- 22. (A) AMPHIBIANS 9 November 2012 Fig. S6A. Global map, dendrogram and NMDS of taxon-specific zoogeographic regions based on distributional data for species of amphibians (6,110 spp.). The map represents results of UPGMA clustering of global beta diversity (βsim) values for species assemblages in 2°× 2° grid cells. Grid cells are clustered into 26 regions, the minimum number required to result in the sum of between region βsim values accounting for over 95% of the sum total βsim. The dendrogram depicts relationships among regions and the βsim axis shows the degree of compositional turnover between branches descending from a node. Region colors produced by plotting results within three-dimensional standard RGB color space via a three dimensional NMDS ordination. Therefore the similarity of region colors reflects the βsim of the clusters themselves. The human eye does not perceive RGB color differences with a high degree of accuracy and therefore inter-cluster relationships are also displayed using UPGMA dendrogram and a two-dimensional NMDS ordination. Co-pehentic scores range between 0 and 1, where 0 indicates the lack of a correlation and 1 indicates a perfect correlation between matrices. The overall co-phenetic score (0.83) indicates how well the dendrogram represent relationships between regions generally and values next to the tips of the dendrogram represent region-specific co-phenetic scores. Similarly, stress values reflect the strength of the correlation between pairwise distances in the original pβsim data matrix and a data matrix calculated from the NMDS plot. Stress values reflect the amount of error in the correlation between pairwise distances in the original pβsim data matrix and a data matrix calculated from the NMDS plot, with 0 representing no error and 1 indicating a complete lack of correlation.
- 23. (B) BIRDS 9 November 2012 Fig. S6B. Global map, dendrogram and NMDS of taxon-specific zoogeographic regions based on distributional data for species of birds (10,074 spp.). The map represents results of UPGMA clustering of global beta diversity (βsim) values for species assemblages in 2°× 2° grid cells. Grid cells are clustered into 20 regions, the minimum number required to result in the sum of between region βsim values accounting for over 95% of the sum total βsim. The dendrogram depicts relationships among regions and the βsim axis shows the degree of compositional turnover between branches descending from a node. Region colors produced by plotting results within three- dimensional standard RGB color space via a three dimensional NMDS ordination. Therefore the similarity of region colors reflects the βsim of the clusters themselves. The human eye does not perceive RGB color differences with a high degree of accuracy and therefore inter-cluster relationships are also displayed using UPGMA dendrogram and a two-dimensional NMDS ordination Co-pehentic scores range between 0 and 1, where 0 indicates the lack of a correlation and 1 indicates a perfect correlation between matrices. The overall co-phenetic score (0.76) indicates how well the dendrogram represent relationships between regions generally and values next to the tips of the dendrogram represent region-specific co-phenetic scores. Similarly, stress values reflect the strength of the correlation between pairwise distances in the original pβsim data matrix and a data matrix calculated from the NMDS plot. Stress values reflect the amount of error in the correlation between pairwise distances in the original pβsim data matrix and a data matrix calculated from the NMDS plot, with 0 representing no error and 1 indicating a complete lack of correlation.
- 24. (C) MAMMALS 9 November 2012 Fig. S6C. Global map, dendrogram and NMDS of taxon-specific zoogeographic regions based on distributional data for species of non-marine mammals (8,564 spp.). The map represents results of UPGMA clustering of global beta diversity (βsim) values for species assemblages in 2°× 2° grid cells. Grid cells are clustered into 29 regions, the minimum number required to result in the sum of between region βsim values accounting for over 95% of the sum total βsim. The dendrogram depicts relationships among regions and the βsim axis shows the degree of compositional turnover between branches descending from a node. Region colors produced by plotting results within three-dimensional standard RGB color space via a three dimensional NMDS ordination. Therefore the similarity of region colors reflects the βsim of the clusters themselves. The human eye does not perceive RGB color differences with a high degree of accuracy and therefore inter-cluster relationships are also displayed using UPGMA dendrogram and a two- dimensional NMDS ordination. N.B. region 29, New Zealand, showed complete turnover (βsim = 1) with all other regions and dominated NMDS plots to the extent that patterns among other could not be determined. Therefore both NMDS plot were calculated after removing this region and region 29 was assigned black coloration. Co-pehentic scores range between 0 and 1, where 0 indicates the lack of a correlation and 1 indicates a perfect correlation between matrices. The overall co-phenetic score (0.81) indicates how well the dendrogram represent relationships between regions generally and values next to the tips of the dendrogram represent region-specific co- phenetic scores. Similarly, stress values reflect the strength of the correlation between pairwise distances in the original pβsim data matrix and a data matrix calculated from the NMDS plot. Stress values reflect the amount of error in the correlation between pairwise distances in the original pβsim data matrix and a data matrix calculated from the NMDS plot, with 0 representing no error and 1 indicating a complete lack of correlation.
- 25. 9 November 2012 Fig. S7. Global phylogeny for birds. Overview of the global avian phylogeny, showing major clades. Branch lengths are not proportional to time or morphological divergence, but were assigned using the transformation introduced by Grafen (61) for greater clarity (N.B. branch lengths not used in this study, see Materials and Methods). Clade names follow the taxonomy of Gill et al. (38), with these exceptions: Palaeognathae comprise Apterygiformes, Casuariiformes, Rheiformes, Struthioniformes, and Tinamiformes; ‘Mirandornithes’ include Phoenicopteriformes and Podicipediformes; ‘Columbiformes’ include Mesornithiformes and Pteroclidiformes; ‘Natatores’ include Ciconiiformes, Gaviiformes, Pelecaniformes, Procellariiformes, and Sphenisciformes; ‘basal Oscines’ include Menurida (Menuridae + Atrichornithidae), Climacterida (Climactericae, Turnagra and Ptilnorhynchidae), Meliphagida, Pomatostomida (Pomatostomidae + Orthonychidae) and the Cinclosoma-Ptilorrhoa clade; and ’transitory Oscines’ comprise Callaeidae, Chaetopidae, Cnemophilidae, Eupetidae, Melanocharitidae, Notiomystidae, Paramythiidae, Petroicidae, and Picarthatidae. Note that ‘Caprimulgiformes’, ‘basal Oscines’ and ‘transitory Oscines’ are paraphyletic groupings. For further definitions of major clades within Passeriformes, see Supplementary Material Appendix S2.
- 26. 9 November 2012 Fig. S8. Cluster algorithm performance analysis — clustering assemblages of vertebrate species into zoogeographic regions based on phylo-distributional data. Plots show performance analysis of ten different clustering algorithms for zoogeographical delimitation of species assemblages within 2°× 2° grid cells for (A) amphibians, (B) birds, (C) mammals and (D) combined taxon analyses. Algorithms are evaluated via their ability to account for the sum total of global phylo beta diversity (pβsim) values with increasing numbers of clusters (i.e. species assemblages). Algorithms producing clusters that accounted for the highest percentage of total pβsim, for a given number of regions, were considered superior. Horizontal dotted lines represent different “cutoff” points tested for the final number of regions. These represent the points where 90, 95, 99 and 99.9% of total pβsim is found between regions rather than within regions. Higher cut off points represent more informative clustering schemes, but large numbers of cluster hinder interpretation of broad scale patterns. Therefore, the final scheme was chosen as the best performing algorithm at a cutoff point that returned less than 50 clusters.
- 27. 9 November 2012 Fig. S9. Cluster algorithm performance analysis — inferring relationships between zoogeographic regions based on phylo-distributional data. Results of evaluation analysis for the performance of nine hierarchical clustering algorithms on zoogeographical regions produced from analysis of amphibians, birds, mammals and combined taxon data. Hierarchical algorithms are compared via their overall co-phenetic coefficients, which reflect of how well the data are represented by the cluster dendrogram. Co-phenetic coefficients are calculated as the strength of the correlation between the original βsim data (see Material and Methods for full description) and a data matrix calculated from the dendrogram. Higher values represent superior performance.
- 28. 9 November 2012 Fig. S10A. Robustness of results to the choice of analytical approach. Partitoning Around Mediods (PAM) clustering of global phylo beta diversity (pβsim) values for species assemblages in 2°× 2° grid cells within 34 Ward’s minimum variances criterion clustered zoogeographic regions. Grid cells are clustered into 11 realms, the number of realms in the main, UPGMA based, analysis. The sum of between realm pβsim values accounts for over 93.8% of the sum total pβsim. Realms colors produced by plotting results within three-dimensional standard RGB color space via a three dimensional NMDS ordination. Therefore the similarity of realm colors reflects the pβsim of the clusters themselves (N.B. The Tibetan plateau is clustered within region 9). The human eye does not perceive RGB color differences with a high degree of accuracy and therefore inter-cluster relationships are also displayed a two-dimensional NMDS ordination (N.B. no dendrogram is produced for the non-hierarchical PAM method). Stress values reflect the strength of the correlation between pairwise distances in the original pβsim data matrix and a data matrix calculated from the NMDS plot. Stress values range between 0 and 1, where 1 indicate the lack of a correlation and 0 indicates a perfect correlation between matrices.
- 29. 9 November 2012 Fig. S10B. Robustness of results to the choice of analytical approach. Partitoning Around Mediods (PAM) clustering of global phylo beta diversity (pβsim) values for species assemblages in 2°× 2° grid cells within 34 Ward’s minimum variances criterion clustered zoogeographic regions. Grid cells are clustered into 11 realms, the number of realms in the main, UPGMA based, analysis. The sum of between realm pβsim values accounts for over 93.8% of the sum total pβsim. Realms colors produced by plotting results within three-dimensional standard RGB color space via a three dimensional NMDS ordination. Therefore the similarity of realm colors reflects the pβsim of the clusters themselves. The human eye does not perceive RGB color differences with a high degree of accuracy and therefore inter-cluster relationships are also displayed a two-dimensional NMDS ordination (N.B. no dendrogram is produced for the non-hierarchical PAM method). Stress values reflect the strength of the correlation between pairwise distances in the original pβsim data matrix and a data matrix calculated from the NMDS plot. Stress values range between 0 and 1, where 1 indicate the lack of a correlation and 0 indicates a perfect correlation between matrices.
- 30. 9 November 2012 Fig. S11. Sensitivity analyses. Comparison of (A) phylogenetically derived map of zoogeographic regions for mammals with maps produced using (B) a phylogenetic tree including branch length, (C) a taxonomy instead of a phylogenetic tree and (D) equal area grid cells instead of 2˚× 2˚ Latitude-Longitude grid cells.
- 31. Table S1. Summary information for clustering of zoogeographic regions into realms (Fig. 1 and fig. S1) for cross-taxon analyses on phylogenetic beta diversity values (measured as pβsim). N = number of objects within cluster (i.e. objects = regions). “Within mean” = mean pβsim values for comparisons of objects within a cluster with other objects within that cluster. “Between mean” = mean pβsim values for comparisons of objects within a clusters with objects not within that cluster. “SD” = standard deviations of these values. “Mean silhouette” values (62) reflect both the tightness (similarity of within cluster objects) and separation (similarity of objects outside a cluster to objects within a cluster). Silhouettes values are calculated for each object as: s(i) := ( b(i) - a(i) ) / max( a(i), b(i) ); where a(i) = mean of pβsim values between object i and all other objects of the cluster to which object i belongs, b(i) = the mean of pβsim values with object i's neighbour cluster (i.e. the nearest cluster i does not belong to). Values range from -1 to 1, with positive mean values for a cluster indicating that objects within a cluster are, on average, appropriately placed within that cluster. Within Within Between Between Within mean/ Mean Realm N mean SD mean SD Between mean Silhouette Afrotropical 570 0.24 0.10 0.55 0.15 2.26 0.26 Australian 287 0.25 0.15 0.65 0.18 2.63 0.35 Madagascan 29 0.11 0.08 0.63 0.14 5.51 0.70 Nearctic 723 0.20 0.12 0.47 0.17 2.41 0.41 Neotropical 478 0.26 0.11 0.59 0.15 2.32 0.28 Oriental 344 0.25 0.12 0.54 0.16 2.18 0.21 Palearctic 1994 0.23 0.13 0.50 0.17 2.21 0.25 Panamanian 88 0.22 0.12 0.56 0.16 2.51 0.34 Papuan-Melanesian 269 0.23 0.20 0.52 0.19 2.22 0.28 Saharo-Arabian 297 0.19 0.09 0.47 0.15 2.51 0.41 Sino-Japanese 165 0.26 0.14 0.45 0.16 1.71 0.18 26