SlideShare una empresa de Scribd logo
1 de 1
$0
$20,000
$40,000
$60,000
$80,000
$100,000
$120,000
$140,000
$160,000
$180,000
12/89 12/91 12/93 12/95 12/97 12/99 12/01 12/03 12/05 12/07 12/09 12/11 12/13 12/15
$0
$20,000
$40,000
$60,000
$80,000
$100,000
$120,000
$140,000
$160,000
$180,000
12/89 12/91 12/93 12/95 12/97 12/99 12/01 12/03 12/05 12/07 12/09 12/11 12/13 12/15
MSCI All-Country World Stock Index FTSE EPRA/NAREIT Developed Real Estate Index
Price Return
Note: Based on monthly total returns and price appreciation returns, January 1990 – July 2017
Sources: NAREIT® analysis of data from IDP accessed through FactSet.
Dividends are an Important Component of Total Returns
Dividend and Capital Gains, January 1990 – July 2017
$0
$20,000
$40,000
$60,000
$80,000
$100,000
$120,000
$140,000
$160,000
$180,000
12/89 12/91 12/93 12/95 12/97 12/99 12/01 12/03 12/05 12/07 12/09 12/11 12/13 12/15
Cumulative Capital Gains with Reinvestment
Cumulative Dividends with Reinvestment
Initial Investment
$0
$20,000
$40,000
$60,000
$80,000
$100,000
$120,000
$140,000
$160,000
$180,000
12/89 12/91 12/93 12/95 12/97 12/99 12/01 12/03 12/05 12/07 12/09 12/11 12/13 12/15
Cumulative Capital Gains with Reinvestment
Cumulative Dividends with Reinvestment
Initial Investment
Standard & Poor’s 500 Stock Index FTSE NAREIT All U.S. Equity REIT Index
0

Más contenido relacionado

Similar a Listed Equity REITs and Stocks: Income and Capital Appreciation

Quarterly Investment Update: First Quarter 2014 Dimensional Fund Advisors
Quarterly Investment Update: First Quarter 2014  Dimensional Fund AdvisorsQuarterly Investment Update: First Quarter 2014  Dimensional Fund Advisors
Quarterly Investment Update: First Quarter 2014 Dimensional Fund Advisors
Atlantis Financial Inc
 

Similar a Listed Equity REITs and Stocks: Income and Capital Appreciation (20)

January 2018 Florida Real Estate Statistics
January 2018 Florida Real Estate Statistics January 2018 Florida Real Estate Statistics
January 2018 Florida Real Estate Statistics
 
Reap The 1st Mover Advantage Before The Make Over
Reap The 1st Mover Advantage Before The Make OverReap The 1st Mover Advantage Before The Make Over
Reap The 1st Mover Advantage Before The Make Over
 
RPS Chart Pack May 2017
RPS Chart Pack May 2017RPS Chart Pack May 2017
RPS Chart Pack May 2017
 
RPS Chart Pack June 2017
RPS Chart Pack June 2017RPS Chart Pack June 2017
RPS Chart Pack June 2017
 
Growth and GDP (1).pptx
Growth and GDP (1).pptxGrowth and GDP (1).pptx
Growth and GDP (1).pptx
 
Canadian M&A Insights Fall 2018
Canadian M&A Insights Fall 2018Canadian M&A Insights Fall 2018
Canadian M&A Insights Fall 2018
 
February 2017 Market Watch - JUST RELEASED
February 2017 Market Watch - JUST RELEASEDFebruary 2017 Market Watch - JUST RELEASED
February 2017 Market Watch - JUST RELEASED
 
Colliers International Houston Trends 2017
Colliers International Houston Trends 2017Colliers International Houston Trends 2017
Colliers International Houston Trends 2017
 
TRENDS 2017 Houston Slides
TRENDS 2017 Houston SlidesTRENDS 2017 Houston Slides
TRENDS 2017 Houston Slides
 
2016 Q4 Investment Webinar - The San Diego Foundation
2016 Q4 Investment Webinar - The San Diego Foundation2016 Q4 Investment Webinar - The San Diego Foundation
2016 Q4 Investment Webinar - The San Diego Foundation
 
Quarterly Investment Update: First Quarter 2014 Dimensional Fund Advisors
Quarterly Investment Update: First Quarter 2014  Dimensional Fund AdvisorsQuarterly Investment Update: First Quarter 2014  Dimensional Fund Advisors
Quarterly Investment Update: First Quarter 2014 Dimensional Fund Advisors
 
World market index declines and subsequent growth
World market index declines and subsequent growthWorld market index declines and subsequent growth
World market index declines and subsequent growth
 
TRENDS 2017 Houston Slides
TRENDS 2017 Houston SlidesTRENDS 2017 Houston Slides
TRENDS 2017 Houston Slides
 
Item #13 PPT 4th Qrt Report
Item #13  PPT 4th Qrt ReportItem #13  PPT 4th Qrt Report
Item #13 PPT 4th Qrt Report
 
Mother of All FinTech IPO Infographics by FT Partners
Mother of All FinTech IPO Infographics by FT PartnersMother of All FinTech IPO Infographics by FT Partners
Mother of All FinTech IPO Infographics by FT Partners
 
University of Toronto - St. George - Presentation
University of Toronto - St. George - PresentationUniversity of Toronto - St. George - Presentation
University of Toronto - St. George - Presentation
 
Greater Baton Rouge Home Sales December 2017 Update provided by GBRAR.
Greater Baton Rouge Home Sales December 2017 Update provided by GBRAR. Greater Baton Rouge Home Sales December 2017 Update provided by GBRAR.
Greater Baton Rouge Home Sales December 2017 Update provided by GBRAR.
 
Investment Fundamentals
Investment FundamentalsInvestment Fundamentals
Investment Fundamentals
 
Mythbusters for 360 short
Mythbusters for 360 shortMythbusters for 360 short
Mythbusters for 360 short
 
From Good to Great: How to Ace Your Marketplace Fundraise
From Good to Great: How to Ace Your Marketplace FundraiseFrom Good to Great: How to Ace Your Marketplace Fundraise
From Good to Great: How to Ace Your Marketplace Fundraise
 

Más de Brad Case, PhD, CFA, CAIA

Más de Brad Case, PhD, CFA, CAIA (11)

Empirical Research on Performance of Private and Public Real Estate Investments
Empirical Research on Performance of Private and Public Real Estate InvestmentsEmpirical Research on Performance of Private and Public Real Estate Investments
Empirical Research on Performance of Private and Public Real Estate Investments
 
Daily REIT-Stock Correlation
Daily REIT-Stock CorrelationDaily REIT-Stock Correlation
Daily REIT-Stock Correlation
 
Volatility Comparison, Public & Private Real Estate
Volatility Comparison, Public & Private Real EstateVolatility Comparison, Public & Private Real Estate
Volatility Comparison, Public & Private Real Estate
 
Updated Summary of Academic Research on Performance of Private Equity Investm...
Updated Summary of Academic Research on Performance of Private Equity Investm...Updated Summary of Academic Research on Performance of Private Equity Investm...
Updated Summary of Academic Research on Performance of Private Equity Investm...
 
Are Listed Equity REITs the Same as Unlisted Real Estate? Bibliography
Are Listed Equity REITs the Same as Unlisted Real Estate? BibliographyAre Listed Equity REITs the Same as Unlisted Real Estate? Bibliography
Are Listed Equity REITs the Same as Unlisted Real Estate? Bibliography
 
Temporal Diversification in Real Estate Portfolios
Temporal Diversification in Real Estate PortfoliosTemporal Diversification in Real Estate Portfolios
Temporal Diversification in Real Estate Portfolios
 
Asset Class Correlations & Volatilities: End of July 2017
Asset Class Correlations & Volatilities: End of July 2017Asset Class Correlations & Volatilities: End of July 2017
Asset Class Correlations & Volatilities: End of July 2017
 
Alpha and Beta -Listed and Private Real Estate
Alpha and Beta -Listed and Private Real EstateAlpha and Beta -Listed and Private Real Estate
Alpha and Beta -Listed and Private Real Estate
 
REIT Returns and Interest Rates: Correcting an "Urban Legend"
REIT Returns and Interest Rates: Correcting an "Urban Legend"REIT Returns and Interest Rates: Correcting an "Urban Legend"
REIT Returns and Interest Rates: Correcting an "Urban Legend"
 
REITs and Small Cap Value Stocks: Correlation, Volatility, Beta, and Alpha
REITs and Small Cap Value Stocks: Correlation, Volatility, Beta, and AlphaREITs and Small Cap Value Stocks: Correlation, Volatility, Beta, and Alpha
REITs and Small Cap Value Stocks: Correlation, Volatility, Beta, and Alpha
 
Correlation and Beta: Listed Equity REITs and Stocks
Correlation and Beta: Listed Equity REITs and StocksCorrelation and Beta: Listed Equity REITs and Stocks
Correlation and Beta: Listed Equity REITs and Stocks
 

Listed Equity REITs and Stocks: Income and Capital Appreciation

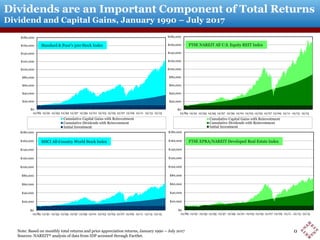
  • 1. $0 $20,000 $40,000 $60,000 $80,000 $100,000 $120,000 $140,000 $160,000 $180,000 12/89 12/91 12/93 12/95 12/97 12/99 12/01 12/03 12/05 12/07 12/09 12/11 12/13 12/15 $0 $20,000 $40,000 $60,000 $80,000 $100,000 $120,000 $140,000 $160,000 $180,000 12/89 12/91 12/93 12/95 12/97 12/99 12/01 12/03 12/05 12/07 12/09 12/11 12/13 12/15 MSCI All-Country World Stock Index FTSE EPRA/NAREIT Developed Real Estate Index Price Return Note: Based on monthly total returns and price appreciation returns, January 1990 – July 2017 Sources: NAREIT® analysis of data from IDP accessed through FactSet. Dividends are an Important Component of Total Returns Dividend and Capital Gains, January 1990 – July 2017 $0 $20,000 $40,000 $60,000 $80,000 $100,000 $120,000 $140,000 $160,000 $180,000 12/89 12/91 12/93 12/95 12/97 12/99 12/01 12/03 12/05 12/07 12/09 12/11 12/13 12/15 Cumulative Capital Gains with Reinvestment Cumulative Dividends with Reinvestment Initial Investment $0 $20,000 $40,000 $60,000 $80,000 $100,000 $120,000 $140,000 $160,000 $180,000 12/89 12/91 12/93 12/95 12/97 12/99 12/01 12/03 12/05 12/07 12/09 12/11 12/13 12/15 Cumulative Capital Gains with Reinvestment Cumulative Dividends with Reinvestment Initial Investment Standard & Poor’s 500 Stock Index FTSE NAREIT All U.S. Equity REIT Index 0