

Recomendados
Más contenido relacionado
La actualidad más candente
La actualidad más candente (20)
Similar a 13 store layout & design new
Similar a 13 store layout & design new (20)
Último
Último (20)
13 store layout & design new
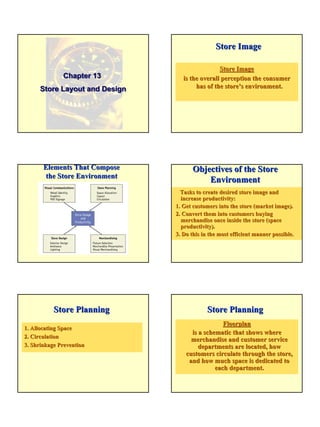
- 1. 1 Chapter 13 Store Layout and Design Chapter 13 Store Layout and Design Store ImageStore Image is the overall perception the consumeris the overall perception the consumer has of the store’s environment.has of the store’s environment. Store ImageStore Image Elements That ComposeElements That Compose the Store Environmentthe Store Environment Objectives of the StoreObjectives of the Store EnvironmentEnvironment Tasks to create desired store image andTasks to create desired store image and increase productivity:increase productivity: 1. Get customers into the store (market image).1. Get customers into the store (market image). 2. Convert them into customers buying2. Convert them into customers buying merchandise once inside the store (spacemerchandise once inside the store (space productivity).productivity). 3. Do this in the most efficient manner possible.3. Do this in the most efficient manner possible. Store PlanningStore Planning 1. Allocating Space1. Allocating Space 2. Circulation2. Circulation 3. Shrinkage Prevention3. Shrinkage Prevention Store PlanningStore Planning FloorplanFloorplan is a schematic that shows whereis a schematic that shows where merchandise and customer servicemerchandise and customer service departments are located, howdepartments are located, how customers circulate through the store,customers circulate through the store, and how much space is dedicated toand how much space is dedicated to each department.each department.
- 2. 2 Allocating SpaceAllocating Space Types of space needed:Types of space needed: 1. Back room1. Back room 2. Office and other functional spaces2. Office and other functional spaces 3. Aisles, services areas, and other3. Aisles, services areas, and other nonsellingnonselling areas of the main sales floorareas of the main sales floor 4. Wall merchandise space4. Wall merchandise space 5. Floor merchandise space5. Floor merchandise space These Warning Signs MayThese Warning Signs May Indicate a Space ProblemIndicate a Space Problem CirculationCirculation Free Flow LayoutFree Flow Layout Free Flow Advantages and DisadvantagesAdvantages and Disadvantages of Free Flow Layoutof Free Flow Layout Advantages 1. Allowance for browsing and wandering freely 2. Increased impulse purchases 3. Visual appeal 4. Flexibility Retailing, 3rd Edition, Dunne and Lusch Copyright © 1999 by Harcourt Brace & Company All rights reserved. Free Flow Disadvantages 1. Loitering encouraged 2. Possible confusion 3. Waste of floor space 4. Cost 5. Difficulty of cleaning Retailing, 3rd Edition, Dunne and Lusch Copyright © 1999 by Harcourt Brace & Company All rights reserved. Advantages and DisadvantagesAdvantages and Disadvantages of Free Flow Layoutof Free Flow Layout The Disney Store’s effective useThe Disney Store’s effective use of the Freeof the Free--Flow DesignFlow Design Approximately 250 million consumers visit Disney’s entertainment retail outlets each year. New store designs showcase merchandise in an engaging and contemporary fashion, keeping pace with evolving retail trends. Technological elements - including a front-of-store media wall that engages guests with Disney programming, and interactive kiosks - setting the stage for the Disney Store in the 21st century.
- 3. 3 Advantages 1. Low cost 2. Customer familiarity 3. Merchandise exposure 4. Ease of cleaning 5. Simplified security 6. Possibility of self-service Grid Retailing, 3rd Edition, Dunne and Lusch Copyright © 1999 by Harcourt Brace & Company All rights reserved. Advantages and Disadvantages ofAdvantages and Disadvantages of Grid LayoutsGrid Layouts Disadvantages 1. Plain and uninteresting 2. Limited browsing 3. Stimulation of rushed shopping behavior 4. Limited creativity in decor Grid Retailing, 3rd Edition, Dunne and Lusch Copyright © 1999 by Harcourt Brace & Company All rights reserved. Advantages and Disadvantages ofAdvantages and Disadvantages of Grid LayoutsGrid Layouts CirculationCirculation Loop LayoutLoop Layout CirculationCirculation Spine LayoutSpine Layout FloorplanFloorplan:: Clarence Sander’sClarence Sander’s PigglyPiggly WigglyWiggly FloorplanFloorplan:: Kohl’sKohl’s
- 4. 4 hhIt costs over $20 million to build a newIt costs over $20 million to build a new department store and $7 to $10 million fordepartment store and $7 to $10 million for a redo.a redo. hhAn Office Depot has over 1,700 linearAn Office Depot has over 1,700 linear feet of fixtures. A 100,000feet of fixtures. A 100,000--squaresquare--footfoot Burdines Department Store has aboutBurdines Department Store has about 1,000 fixtures, half are for hanging1,000 fixtures, half are for hanging apparel.apparel. Planning Fixtures andPlanning Fixtures and Merchandise PresentationMerchandise Presentation 1. Fixture Types1. Fixture Types 2. Merchandise Presentation Planning2. Merchandise Presentation Planning 3. Selecting Fixtures and Merchandise3. Selecting Fixtures and Merchandise Presentation MethodsPresentation Methods 4. Visual Merchandising4. Visual Merchandising Merchandise Presentation PlanningMerchandise Presentation Planning Methods of Merchandise PresentationMethods of Merchandise Presentation 1. Shelving1. Shelving 2. Hanging2. Hanging 3. Pegging3. Pegging 4. Folding4. Folding 5. Stacking5. Stacking 6. Dumping6. Dumping Merchandise Presentation PlanningMerchandise Presentation Planning Psychological Factors to Consider WhenPsychological Factors to Consider When Merchandising StoresMerchandising Stores 1. Value/fashion image1. Value/fashion image 2. Angles and sightlines2. Angles and sightlines 3. Vertical color blocking3. Vertical color blocking 4545--Degree Customer SightlineDegree Customer Sightline Vertical Color BlockingVertical Color Blocking
- 5. 5 Examples of Visual MerchandisingExamples of Visual Merchandising “Visual Merchandising”, the art of attracting patrons with visual cues, is central to a retailer’s ability to generate sales. Visual Merchandising got its start at the turn of the century, when department stores began using theatrical set design and lighting to create exotic displays. Today, the way the departments are arranged, the location of the escalators, the lighting--all are carefully planned to earn the store more sales per square foot. Retailing, 3rd Edition, Dunne and Lusch Copyright © 1999 by Harcourt Brace & Company All rights reserved. Here’s sampling of the techniques stores use to generate those sales: Retailing, 3rd Edition, Dunne and Lusch Copyright © 1999 by Harcourt Brace & Company All rights reserved. Get’m coming and going. Escalators are a focal point of many stores. That makes them ideal locations for promotional signs and for impulse items like perfume. Examples of Visual MerchandisingExamples of Visual Merchandising Lead them to temptation. Department-store design incorporates a gauntlet of goodies to stimulate impulse buys. Cosmetics, a store’s most profitable department, should always be at the main entrance to the store. Retailing, 3rd Edition, Dunne and Lusch Copyright © 1999 by Harcourt Brace & Company All rights reserved. Examples of Visual MerchandisingExamples of Visual Merchandising Its all in the display. When an item, such as a watch or a scarf, is displayed in a glass case, it implies luxury. An item in a glass case with a lot of space around it implies real luxury. Retailing, 3rd Edition, Dunne and Lusch Copyright © 1999 by Harcourt Brace & Company All rights reserved. Examples of Visual MerchandisingExamples of Visual Merchandising Retailing, 3rd Edition, Dunne and Lusch Copyright © 1999 by Harcourt Brace & Company All rights reserved. “Bazaar? Behavior”. Even “high fashion” stores aren’t above using the “dumping” method to display gloves, leather goods, scarves, and other small items the same way bargain stores do. These bins have a way of suggesting a “good buy.” Examples of Visual MerchandisingExamples of Visual Merchandising Color is king. Retailers believe consumers are more apt to buy clothes that appear in full size and color assortments. Retailing, 3rd Edition, Dunne and Lusch Copyright © 1999 by Harcourt Brace & Company All rights reserved. Examples of Visual MerchandisingExamples of Visual Merchandising
- 6. 6 Retailing, 3rd Edition, Dunne and Lusch Copyright © 1999 by Harcourt Brace & Company All rights reserved. Suggestion positioning. Once the customer has already purchased one item, it’s easier to sell an additional item. Thus apparel retailers strategically place impulse buys like hair bows and costume jewelry by the cashier the same way supermarket checkouts display candy and magazines. Examples of Visual MerchandisingExamples of Visual Merchandising Store Layout ConsiderationsStore Layout Considerations hh High margin items should be placed in high trafficHigh margin items should be placed in high traffic areas.areas. hh High demand items should be placed in low trafficHigh demand items should be placed in low traffic areas.areas. hh Complementary items should be placed near each other.Complementary items should be placed near each other. hh Seasonal needs should be considered.Seasonal needs should be considered. hh Items needing frequent restocking should be placed nearItems needing frequent restocking should be placed near storerooms or cash registers.storerooms or cash registers. hh Larger departments should be placed in lower trafficLarger departments should be placed in lower traffic areas.areas. hh Shopping behavior and operational considerationsShopping behavior and operational considerations should be recognized.should be recognized. Store DesignStore Design 1. Storefront Design1. Storefront Design 2. Interior Design2. Interior Design 3. Lighting Design3. Lighting Design 4. Sounds and Smells: Total Sensory4. Sounds and Smells: Total Sensory MarketingMarketing Interior DesignInterior Design The low cost, no frills flooring combined with the low cost metal shelving help to convey the low price image in this discount retail display for Barbie. Signs and LightingSigns and Lighting hhSigns and graphics provide informationSigns and graphics provide information and can add personality, beauty, andand can add personality, beauty, and romance to a store’s imageromance to a store’s image hhGood lighting should do more thanGood lighting should do more than illuminate space. It can highlightilluminate space. It can highlight merchandise, sculpt space, and capture amerchandise, sculpt space, and capture a mood that enhances a store’s image.mood that enhances a store’s image. •• PoppingPopping the Merchandisethe Merchandise hhA typical 100,000 sq.ft. department storeA typical 100,000 sq.ft. department store has over 1000 light fixtures.has over 1000 light fixtures. Lighting DesignLighting Design Contemporary lighting design requires an in- depth knowledge of electrical engineering and the effect of light on color and texture. The Limited, as many specialty apparel retailers, has found that lower light levels help convey a more fashion oriented image.
- 7. 7 Visual CommunicationsVisual Communications 1. Name, Logo, and Retail Identity1. Name, Logo, and Retail Identity 2. Institutional Signage2. Institutional Signage 3. Directional, Departmental, and Category3. Directional, Departmental, and Category SignageSignage 4. Point4. Point--ofof--Sale (POS) SignageSale (POS) Signage 5. Lifestyle Graphics5. Lifestyle Graphics Name, Logo and Retail Identity atName, Logo and Retail Identity at KMartKMart Kmart changed its logo to the big red “K” in an effort to reflect its move into an upscale environment and away from its old polyester and blue-light image. Directional, Departmental,Directional, Departmental, and Category Signageand Category Signage Directional and Departmental SignageDirectional and Departmental Signage are large signs that are usually placed fairlyare large signs that are usually placed fairly high, so they can be seen throughout thehigh, so they can be seen throughout the store.store. Departmental SignageDepartmental Signage Departmental signage serve as the highest level of organization in an overall signage program. These signs are usually large and placed fairly high to they can be seen throughout the store. Directional, Departmental,Directional, Departmental, and Category Signageand Category Signage Category SignageCategory Signage are smaller than directional and departmentalare smaller than directional and departmental signage and are intended to be seen from asignage and are intended to be seen from a shorter distance; they are located on or closeshorter distance; they are located on or close to the fixture itself where the merchandise isto the fixture itself where the merchandise is displayed.displayed. Category SignageCategory Signage Category signage helps consumers negotiate throughout the store to find the product categories they are looking for. The size of category signage varies widely from a lettering that is a few feet in height to merely inches.
- 8. 8 PointPoint--ofof--Sale (POS) SignageSale (POS) Signage PointPoint--ofof--Sale SignageSale Signage is relatively small signage that is placedis relatively small signage that is placed very close to the merchandise and isvery close to the merchandise and is intended to give details about specificintended to give details about specific items.items. POS signage for clearance and sale items tend to be in red to draw a consumer’s attention. PointPoint--ofof--Sale (POS) SignageSale (POS) Signage Space ProductivitySpace Productivity Space ProductivitySpace Productivity represents how effectively the retailerrepresents how effectively the retailer utilizes its space and is usuallyutilizes its space and is usually measured by sales per square foot ofmeasured by sales per square foot of selling space or gross margin dollarsselling space or gross margin dollars per square foot of selling space.per square foot of selling space. Merchandise Productivity AnalysisMerchandise Productivity Analysis Category Total Sales Sale as % Total Total Sq. Ft. Sq. Ft % Total Sales per Sq. Ft. Total G.M. $ G.M. $ % Total Space Productivity Index Juniors 259,645 3.9 1,602 2.9 162.08 211,497 4.57 1.58 Category Total Sales Sale as % Total Total Sq. Ft. Sq. Ft % Total Sales per Sq. Ft. Total G.M. $ G.M. $ % Total Space Productivity Index Womens 170,819 2.6 1.934 3.5 88.33 148,899 3.22 .092 Merchandise Productivity AnalysisMerchandise Productivity Analysis Category Total Sales Sale as % Total Total Sq. Ft. Sq. Ft % Total Sales per Sq. Ft. Total G.M. $ G.M. $ % Total Space Productivity Index Mens 751,604 11.3 3,591 6.5 209.30 603,330 13.05 2.01 Merchandise Productivity AnalysisMerchandise Productivity Analysis
- 9. 9 Housewares 457,795 6.8 3,591 6.5 127.48 254,979 5.51 0.85 Category Total Sales Sale as % Total Total Sq. Ft. Sq. Ft % Total Sales per Sq. Ft. Total G.M. $ G.M. $ % Total Space Productivity Index Merchandise Productivity AnalysisMerchandise Productivity Analysis Cosmetics 75,160 1.1 608 1.1 123.62 55,913 1.21 1.10 Category Total Sales Sale as % Total Total Sq. Ft. Sq. Ft % Total Sales per Sq. Ft. Total G.M. $ G.M. $ % Total Space Productivity Index Merchandise Productivity AnalysisMerchandise Productivity Analysis Total Hardlines 3,655,480 54.8 29,061 52.6 125.79 2,084,914 45.08 0.86 Category Total Sales Sale as % Total Total Sq. Ft. Sq. Ft % Total Sales per Sq. Ft. Total G.M. $ G.M. $ % Total Space Productivity Index Merchandise Productivity AnalysisMerchandise Productivity Analysis Non-Selling ----- ----- 2,652 4.8 ----- ----- ----- ----- Category Total Sales Sale as % Total Total Sq. Ft. Sq. Ft % Total Sales per Sq. Ft. Total G.M. $ G.M. $ % Total Space Productivity Index Merchandise Productivity AnalysisMerchandise Productivity Analysis Total Scores 6,675,564 100.0 55,250 100.0 4,624,480 100.0 1.00 Category Total Sales Sale as % Total Total Sq. Ft. Sq. Ft % Total Sales per Sq. Ft. Total G.M. $ G.M. $ % Total Space Productivity Index Merchandise Productivity AnalysisMerchandise Productivity Analysis