SlideShare una empresa de Scribd logo
1 de 13
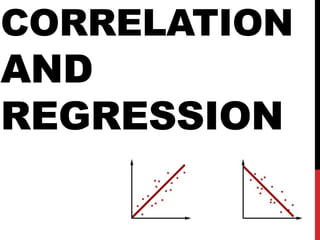
Correlation and Regression
Correlation
What is correlation? A statistical method used to determine whether a linear relationship exist between variables.
Correlation and dependence go by the hand, Dependence refers to any statistical relationship between two random variables or two sets of data, and Correlation refers to any of a broad class of statistical relationships involving dependence. Correlation and Dependence
Correlation and Causality The conventional dictum that "correlation does not imply causation" means that correlation cannot be used to infer a causal relationship between the variables. This dictum should not be taken to mean that correlations cannot indicate the potential existence of causal relations.
Correlation and causality example A correlation between age and height in children is fairly causally transparent, but a correlation between mood and health in people is less so.  Does improved mood lead to improved health, or does good health lead to good mood, or both? Or does some other factor underlie both?  In other words, a correlation can be taken as evidence for a possible causal relationship, but cannot indicate what the causal relationship, if any, might be.
Correlation and linearity The Pearson correlation coefficient indicates the strength of a linear relationship between two variables, but its value generally does not completely characterize their relationship. In particular, if the conditional mean of Y given X, denoted E(Y|X), is not linear in X, the correlation coefficient will not fully determine the form of E(Y|X).
Regression
Regression analysis regression analysis helps one understand how the typical value of the dependent variable changes when any one of the independent variables is varied, while the other independent variables are held fixed.
Regression Models The unknown parameters denoted as β; this may be a scalar or a vector. The independent variables, X. The dependent variable, Y.
Linear regression the model specification is that the dependent variable, yis a linear combination of the parameters (but need not be linear in the independent variables). For example, in simple linear regression for modeling n data points there is one independent variable: xi, and two parameters, β0 and β1: straight line
Non linear Regression When the model function is not linear in the parameters, the sum of squares must be minimized by an iterative procedure. This introduces many complications which are summarized in Differences between linear and non-linear least squares.

Más contenido relacionado

La actualidad más candente

Spearman Rank Correlation Presentation
Spearman Rank Correlation PresentationSpearman Rank Correlation Presentation
Spearman Rank Correlation Presentation
cae_021
 

La actualidad más candente (20)

Partial correlation
Partial correlationPartial correlation
Partial correlation
 
Regression
RegressionRegression
Regression
 
Regression Analysis
Regression AnalysisRegression Analysis
Regression Analysis
 
Correlation and partial correlation
Correlation and partial correlationCorrelation and partial correlation
Correlation and partial correlation
 
Regression Analysis
Regression AnalysisRegression Analysis
Regression Analysis
 
Spearman Rank Correlation Presentation
Spearman Rank Correlation PresentationSpearman Rank Correlation Presentation
Spearman Rank Correlation Presentation
 
Correlations using SPSS
Correlations using SPSSCorrelations using SPSS
Correlations using SPSS
 
Economatrics
Economatrics Economatrics
Economatrics
 
Regression
RegressionRegression
Regression
 
Correlation and regression
Correlation and regressionCorrelation and regression
Correlation and regression
 
Regression ppt
Regression pptRegression ppt
Regression ppt
 
Regression Analysis
Regression AnalysisRegression Analysis
Regression Analysis
 
Statistical inference: Estimation
Statistical inference: EstimationStatistical inference: Estimation
Statistical inference: Estimation
 
Basics of Regression analysis
 Basics of Regression analysis Basics of Regression analysis
Basics of Regression analysis
 
Regression analysis.
Regression analysis.Regression analysis.
Regression analysis.
 
Multiple linear regression
Multiple linear regressionMultiple linear regression
Multiple linear regression
 
Correlation
CorrelationCorrelation
Correlation
 
Correlation and Regression ppt
Correlation and Regression pptCorrelation and Regression ppt
Correlation and Regression ppt
 
Covariance and correlation(Dereje JIMA)
Covariance and correlation(Dereje JIMA)Covariance and correlation(Dereje JIMA)
Covariance and correlation(Dereje JIMA)
 
Spearman rank correlation coefficient
Spearman rank correlation coefficientSpearman rank correlation coefficient
Spearman rank correlation coefficient
 

Destacado

Chapter 6 simple regression and correlation
Chapter 6 simple regression and correlationChapter 6 simple regression and correlation
Chapter 6 simple regression and correlation
Rione Drevale
 
Correlation by Neeraj Bhandari ( Surkhet.Nepal )
Correlation by Neeraj Bhandari ( Surkhet.Nepal )Correlation by Neeraj Bhandari ( Surkhet.Nepal )
Correlation by Neeraj Bhandari ( Surkhet.Nepal )
Neeraj Bhandari
 
Chapter 16: Correlation (enhanced by VisualBee)
Chapter 16: Correlation  
(enhanced by VisualBee)Chapter 16: Correlation  
(enhanced by VisualBee)
Chapter 16: Correlation (enhanced by VisualBee)
nunngera
 
The sphinx
The sphinxThe sphinx
The sphinx
Majorick
 
Point Bicerial Correlation Coefficient
Point Bicerial Correlation CoefficientPoint Bicerial Correlation Coefficient
Point Bicerial Correlation Coefficient
Sharlaine Ruth
 
parametric hypothesis testing using MATLAB
parametric hypothesis testing using MATLABparametric hypothesis testing using MATLAB
parametric hypothesis testing using MATLAB
Kajal Saraswat
 
Method of least square
Method of least squareMethod of least square
Method of least square
Somya Bagai
 

Destacado (20)

Regression
RegressionRegression
Regression
 
Correlation and Simple Regression
Correlation  and Simple RegressionCorrelation  and Simple Regression
Correlation and Simple Regression
 
Regression
RegressionRegression
Regression
 
Chapter 6 simple regression and correlation
Chapter 6 simple regression and correlationChapter 6 simple regression and correlation
Chapter 6 simple regression and correlation
 
QT1 - 03 - Measures of Central Tendency
QT1 - 03 - Measures of Central TendencyQT1 - 03 - Measures of Central Tendency
QT1 - 03 - Measures of Central Tendency
 
Correlation by Neeraj Bhandari ( Surkhet.Nepal )
Correlation by Neeraj Bhandari ( Surkhet.Nepal )Correlation by Neeraj Bhandari ( Surkhet.Nepal )
Correlation by Neeraj Bhandari ( Surkhet.Nepal )
 
Chapter 16: Correlation (enhanced by VisualBee)
Chapter 16: Correlation  
(enhanced by VisualBee)Chapter 16: Correlation  
(enhanced by VisualBee)
Chapter 16: Correlation (enhanced by VisualBee)
 
Chapter 10
Chapter 10Chapter 10
Chapter 10
 
2. Data organization
2. Data organization2. Data organization
2. Data organization
 
7. Correlation
7. Correlation7. Correlation
7. Correlation
 
Descriptive & statistical study on Stock Market
Descriptive & statistical study on Stock MarketDescriptive & statistical study on Stock Market
Descriptive & statistical study on Stock Market
 
Statistical techniques for ordinal data
Statistical techniques for ordinal dataStatistical techniques for ordinal data
Statistical techniques for ordinal data
 
The sphinx
The sphinxThe sphinx
The sphinx
 
METHOD OF LEAST SQURE
METHOD OF LEAST SQUREMETHOD OF LEAST SQURE
METHOD OF LEAST SQURE
 
regression and correlation
regression and correlationregression and correlation
regression and correlation
 
Hypothesis and Test
Hypothesis and TestHypothesis and Test
Hypothesis and Test
 
Point Bicerial Correlation Coefficient
Point Bicerial Correlation CoefficientPoint Bicerial Correlation Coefficient
Point Bicerial Correlation Coefficient
 
parametric hypothesis testing using MATLAB
parametric hypothesis testing using MATLABparametric hypothesis testing using MATLAB
parametric hypothesis testing using MATLAB
 
Method of least square
Method of least squareMethod of least square
Method of least square
 
Chap12 simple regression
Chap12 simple regressionChap12 simple regression
Chap12 simple regression
 

Similar a Correlation and regression

The management of a regional bus line thought the companys cost of .pdf
 The management of a regional bus line thought the companys cost of .pdf The management of a regional bus line thought the companys cost of .pdf
The management of a regional bus line thought the companys cost of .pdf
nagaraj138348
 
Dependance Technique, Regression & Correlation
Dependance Technique, Regression & Correlation Dependance Technique, Regression & Correlation
Dependance Technique, Regression & Correlation
Qasim Raza
 
ReferenceArticleModule 18 Correlational ResearchMagnitude,.docx
ReferenceArticleModule 18 Correlational ResearchMagnitude,.docxReferenceArticleModule 18 Correlational ResearchMagnitude,.docx
ReferenceArticleModule 18 Correlational ResearchMagnitude,.docx
lorent8
 
cor2-161031090555.pptxgfgfgfdgfdgfdgfdgfdgfdgdfgf
cor2-161031090555.pptxgfgfgfdgfdgfdgfdgfdgfdgdfgfcor2-161031090555.pptxgfgfgfdgfdgfdgfdgfdgfdgdfgf
cor2-161031090555.pptxgfgfgfdgfdgfdgfdgfdgfdgdfgf
drluminajulier
 
36033 Topic Happiness Data setNumber of Pages 2 (Double Spac.docx
36033 Topic Happiness Data setNumber of Pages 2 (Double Spac.docx36033 Topic Happiness Data setNumber of Pages 2 (Double Spac.docx
36033 Topic Happiness Data setNumber of Pages 2 (Double Spac.docx
rhetttrevannion
 
36030 Topic Discussion1Number of Pages 2 (Double Spaced).docx
36030 Topic Discussion1Number of Pages 2 (Double Spaced).docx36030 Topic Discussion1Number of Pages 2 (Double Spaced).docx
36030 Topic Discussion1Number of Pages 2 (Double Spaced).docx
rhetttrevannion
 

Similar a Correlation and regression (20)

2-20-04.ppt
2-20-04.ppt2-20-04.ppt
2-20-04.ppt
 
An-Introduction-to-Correlation-and-Linear-Regression FYBSc(IT) SNK.pptx
An-Introduction-to-Correlation-and-Linear-Regression FYBSc(IT) SNK.pptxAn-Introduction-to-Correlation-and-Linear-Regression FYBSc(IT) SNK.pptx
An-Introduction-to-Correlation-and-Linear-Regression FYBSc(IT) SNK.pptx
 
The management of a regional bus line thought the companys cost of .pdf
 The management of a regional bus line thought the companys cost of .pdf The management of a regional bus line thought the companys cost of .pdf
The management of a regional bus line thought the companys cost of .pdf
 
Dependance Technique, Regression & Correlation
Dependance Technique, Regression & Correlation Dependance Technique, Regression & Correlation
Dependance Technique, Regression & Correlation
 
Correlation and regression
Correlation and regressionCorrelation and regression
Correlation and regression
 
Research Methodology Module-06
Research Methodology Module-06Research Methodology Module-06
Research Methodology Module-06
 
Correlation and regression
Correlation and regressionCorrelation and regression
Correlation and regression
 
ReferenceArticleModule 18 Correlational ResearchMagnitude,.docx
ReferenceArticleModule 18 Correlational ResearchMagnitude,.docxReferenceArticleModule 18 Correlational ResearchMagnitude,.docx
ReferenceArticleModule 18 Correlational ResearchMagnitude,.docx
 
CORRELATION ANALYSIS NOTES.pdf
CORRELATION ANALYSIS NOTES.pdfCORRELATION ANALYSIS NOTES.pdf
CORRELATION ANALYSIS NOTES.pdf
 
Correlation and regression
Correlation and regressionCorrelation and regression
Correlation and regression
 
cor2-161031090555.pptxgfgfgfdgfdgfdgfdgfdgfdgdfgf
cor2-161031090555.pptxgfgfgfdgfdgfdgfdgfdgfdgdfgfcor2-161031090555.pptxgfgfgfdgfdgfdgfdgfdgfdgdfgf
cor2-161031090555.pptxgfgfgfdgfdgfdgfdgfdgfdgdfgf
 
Correlation
CorrelationCorrelation
Correlation
 
Applied statistics part 4
Applied statistics part  4Applied statistics part  4
Applied statistics part 4
 
Simple correlation & Regression analysis
Simple correlation & Regression analysisSimple correlation & Regression analysis
Simple correlation & Regression analysis
 
Correlation analysis
Correlation analysisCorrelation analysis
Correlation analysis
 
PPT Correlation.pptx
PPT Correlation.pptxPPT Correlation.pptx
PPT Correlation.pptx
 
36033 Topic Happiness Data setNumber of Pages 2 (Double Spac.docx
36033 Topic Happiness Data setNumber of Pages 2 (Double Spac.docx36033 Topic Happiness Data setNumber of Pages 2 (Double Spac.docx
36033 Topic Happiness Data setNumber of Pages 2 (Double Spac.docx
 
5 regressionand correlation
5 regressionand correlation5 regressionand correlation
5 regressionand correlation
 
Introduction to simple linear regression and correlation in spss
Introduction to  simple linear regression and correlation in spssIntroduction to  simple linear regression and correlation in spss
Introduction to simple linear regression and correlation in spss
 
36030 Topic Discussion1Number of Pages 2 (Double Spaced).docx
36030 Topic Discussion1Number of Pages 2 (Double Spaced).docx36030 Topic Discussion1Number of Pages 2 (Double Spaced).docx
36030 Topic Discussion1Number of Pages 2 (Double Spaced).docx
 

Último

Cloud Frontiers: A Deep Dive into Serverless Spatial Data and FME
Cloud Frontiers:  A Deep Dive into Serverless Spatial Data and FMECloud Frontiers:  A Deep Dive into Serverless Spatial Data and FME
Cloud Frontiers: A Deep Dive into Serverless Spatial Data and FME
Safe Software
 
Why Teams call analytics are critical to your entire business
Why Teams call analytics are critical to your entire businessWhy Teams call analytics are critical to your entire business
Why Teams call analytics are critical to your entire business
panagenda
 

Último (20)

Navi Mumbai Call Girls 🥰 8617370543 Service Offer VIP Hot Model
Navi Mumbai Call Girls 🥰 8617370543 Service Offer VIP Hot ModelNavi Mumbai Call Girls 🥰 8617370543 Service Offer VIP Hot Model
Navi Mumbai Call Girls 🥰 8617370543 Service Offer VIP Hot Model
 
Apidays New York 2024 - The value of a flexible API Management solution for O...
Apidays New York 2024 - The value of a flexible API Management solution for O...Apidays New York 2024 - The value of a flexible API Management solution for O...
Apidays New York 2024 - The value of a flexible API Management solution for O...
 
presentation ICT roal in 21st century education
presentation ICT roal in 21st century educationpresentation ICT roal in 21st century education
presentation ICT roal in 21st century education
 
Automating Google Workspace (GWS) & more with Apps Script
Automating Google Workspace (GWS) & more with Apps ScriptAutomating Google Workspace (GWS) & more with Apps Script
Automating Google Workspace (GWS) & more with Apps Script
 
Cloud Frontiers: A Deep Dive into Serverless Spatial Data and FME
Cloud Frontiers:  A Deep Dive into Serverless Spatial Data and FMECloud Frontiers:  A Deep Dive into Serverless Spatial Data and FME
Cloud Frontiers: A Deep Dive into Serverless Spatial Data and FME
 
"I see eyes in my soup": How Delivery Hero implemented the safety system for ...
"I see eyes in my soup": How Delivery Hero implemented the safety system for ..."I see eyes in my soup": How Delivery Hero implemented the safety system for ...
"I see eyes in my soup": How Delivery Hero implemented the safety system for ...
 
Manulife - Insurer Transformation Award 2024
Manulife - Insurer Transformation Award 2024Manulife - Insurer Transformation Award 2024
Manulife - Insurer Transformation Award 2024
 
Exploring the Future Potential of AI-Enabled Smartphone Processors
Exploring the Future Potential of AI-Enabled Smartphone ProcessorsExploring the Future Potential of AI-Enabled Smartphone Processors
Exploring the Future Potential of AI-Enabled Smartphone Processors
 
A Beginners Guide to Building a RAG App Using Open Source Milvus
A Beginners Guide to Building a RAG App Using Open Source MilvusA Beginners Guide to Building a RAG App Using Open Source Milvus
A Beginners Guide to Building a RAG App Using Open Source Milvus
 
Strategies for Landing an Oracle DBA Job as a Fresher
Strategies for Landing an Oracle DBA Job as a FresherStrategies for Landing an Oracle DBA Job as a Fresher
Strategies for Landing an Oracle DBA Job as a Fresher
 
Why Teams call analytics are critical to your entire business
Why Teams call analytics are critical to your entire businessWhy Teams call analytics are critical to your entire business
Why Teams call analytics are critical to your entire business
 
Corporate and higher education May webinar.pptx
Corporate and higher education May webinar.pptxCorporate and higher education May webinar.pptx
Corporate and higher education May webinar.pptx
 
Apidays New York 2024 - Scaling API-first by Ian Reasor and Radu Cotescu, Adobe
Apidays New York 2024 - Scaling API-first by Ian Reasor and Radu Cotescu, AdobeApidays New York 2024 - Scaling API-first by Ian Reasor and Radu Cotescu, Adobe
Apidays New York 2024 - Scaling API-first by Ian Reasor and Radu Cotescu, Adobe
 
AXA XL - Insurer Innovation Award Americas 2024
AXA XL - Insurer Innovation Award Americas 2024AXA XL - Insurer Innovation Award Americas 2024
AXA XL - Insurer Innovation Award Americas 2024
 
ICT role in 21st century education and its challenges
ICT role in 21st century education and its challengesICT role in 21st century education and its challenges
ICT role in 21st century education and its challenges
 
Powerful Google developer tools for immediate impact! (2023-24 C)
Powerful Google developer tools for immediate impact! (2023-24 C)Powerful Google developer tools for immediate impact! (2023-24 C)
Powerful Google developer tools for immediate impact! (2023-24 C)
 
Ransomware_Q4_2023. The report. [EN].pdf
Ransomware_Q4_2023. The report. [EN].pdfRansomware_Q4_2023. The report. [EN].pdf
Ransomware_Q4_2023. The report. [EN].pdf
 
MINDCTI Revenue Release Quarter One 2024
MINDCTI Revenue Release Quarter One 2024MINDCTI Revenue Release Quarter One 2024
MINDCTI Revenue Release Quarter One 2024
 
Connector Corner: Accelerate revenue generation using UiPath API-centric busi...
Connector Corner: Accelerate revenue generation using UiPath API-centric busi...Connector Corner: Accelerate revenue generation using UiPath API-centric busi...
Connector Corner: Accelerate revenue generation using UiPath API-centric busi...
 
AWS Community Day CPH - Three problems of Terraform
AWS Community Day CPH - Three problems of TerraformAWS Community Day CPH - Three problems of Terraform
AWS Community Day CPH - Three problems of Terraform
 

Correlation and regression

  • 3. What is correlation? A statistical method used to determine whether a linear relationship exist between variables.
  • 4. Correlation and dependence go by the hand, Dependence refers to any statistical relationship between two random variables or two sets of data, and Correlation refers to any of a broad class of statistical relationships involving dependence. Correlation and Dependence
  • 5. Correlation and Causality The conventional dictum that "correlation does not imply causation" means that correlation cannot be used to infer a causal relationship between the variables. This dictum should not be taken to mean that correlations cannot indicate the potential existence of causal relations.
  • 6. Correlation and causality example A correlation between age and height in children is fairly causally transparent, but a correlation between mood and health in people is less so. Does improved mood lead to improved health, or does good health lead to good mood, or both? Or does some other factor underlie both? In other words, a correlation can be taken as evidence for a possible causal relationship, but cannot indicate what the causal relationship, if any, might be.
  • 7. Correlation and linearity The Pearson correlation coefficient indicates the strength of a linear relationship between two variables, but its value generally does not completely characterize their relationship. In particular, if the conditional mean of Y given X, denoted E(Y|X), is not linear in X, the correlation coefficient will not fully determine the form of E(Y|X).
  • 8.
  • 10. Regression analysis regression analysis helps one understand how the typical value of the dependent variable changes when any one of the independent variables is varied, while the other independent variables are held fixed.
  • 11. Regression Models The unknown parameters denoted as β; this may be a scalar or a vector. The independent variables, X. The dependent variable, Y.
  • 12. Linear regression the model specification is that the dependent variable, yis a linear combination of the parameters (but need not be linear in the independent variables). For example, in simple linear regression for modeling n data points there is one independent variable: xi, and two parameters, β0 and β1: straight line
  • 13. Non linear Regression When the model function is not linear in the parameters, the sum of squares must be minimized by an iterative procedure. This introduces many complications which are summarized in Differences between linear and non-linear least squares.