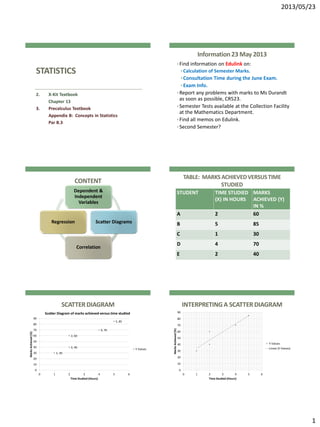
SlideShare una empresa de Scribd logo
1 de 4
2013/05/23
1
STATISTICS
2. X-Kit Textbook
Chapter 13
3. Precalculus Textbook
Appendix B: Concepts in Statistics
Par B.3
Information23 May 2013
• Find information on Edulink on:
• Calculation of Semester Marks.
• Consultation Time during the June Exam.
• Exam Info.
• Report any problems with marks to Ms Durandt
as soon as possible, CR523.
• Semester Tests available at the Collection Facility
at the Mathematics Department.
• Find all memos on Edulink.
• Second Semester?
CONTENT
Dependent &
Independent
Variables
Scatter Diagrams
Correlation
Regression
TABLE: MARKS ACHIEVEDVERSUSTIME
STUDIED
STUDENT TIME STUDIED
(X) IN HOURS
MARKS
ACHIEVED (Y)
IN %
A 2 60
B 5 85
C 1 30
D 4 70
E 2 40
SCATTERDIAGRAM
2, 60
5, 85
1, 30
4, 70
2, 40
0
10
20
30
40
50
60
70
80
90
0 1 2 3 4 5 6
MarksAchieved(%)
Time Studied (Hours)
Scatter Diagram of marks achieved versus time studied
Y-Values
INTERPRETINGA SCATTERDIAGRAM
0
10
20
30
40
50
60
70
80
90
0 1 2 3 4 5 6
MarksAchieved(%)
Time Studied (Hours)
Y-Values
Linear (Y-Values)
2013/05/23
2
IS THERELATIONSHIPBETWEENVARIABLES
STRONGOR WEAK?
POSITIVE CORRELATION
0
5
10
15
20
25
30
35
40
0 2 4 6
Y-Values
NEGATIVE CORRELATION
0
5
10
15
20
25
0 2 4 6
Y-Values
IS THERELATIONSHIPBETWEENVARIABLES
STRONGOR WEAK?
NO CORRELATION
0
5
10
15
20
25
30
35
0 10 20 30 40
Y-Values
NON-LINEAR CORRELATION
0
0.5
1
1.5
2
2.5
3
3.5
0 1 2 3
Y-Values
SUMMINGUP CORRELATIONIN A NUMBER
• The correlation coefficient 𝑟 is a number that
tells us exactly how strong or weak the
correlation between two variables is.
• Calculate 𝑟 by using the formula:
𝒓 =
𝒙𝒚 − 𝒏𝒙 𝒚
𝒙 𝟐 − 𝒏𝒙 𝟐 𝒚 𝟐 − 𝒏𝒚 𝟐
• Calculate 𝑟 by using your calculator.
THE MEANINGOF 𝒓
Perfect Strong Mode-
rate
Weak No Linear
Correlation
Weak Mode-
rate
Strong Perfect
-1.00 -0.75 -0.50 -0.25 0.00 +0.25 +0.50 +0.75 +1.00
NEGATIVE CORRELATION POSITIVE CORRELATION
CALCULATETHE CORRELATIONCOEFFICIENT:
MARKS ACHIEVEDVERSUSTIME STUDIED
STUDENT TIME STUDIED
(X) IN HOURS
MARKS
ACHIEVED (Y)
IN %
A 2 60
B 5 85
C 1 30
D 4 70
E 2 40
SOLUTION
𝒓 = 𝟎. 𝟗𝟑𝟕
Very Strong Positive Linear
Relationship
2013/05/23
3
MAKE PREDICTIONS
Follow the plan:
•Find the LINE OF BEST FIT.
•Decide how “well” it fits.
•From a good fit we can make predictions.
LINE OF BESTFIT (REGRESSIONLINE)
• Formula 𝒚 = 𝒂 + 𝒃𝒙
• Formula for the regression coefficients:
𝒃 =
𝒙𝒚 − 𝒏𝒙 𝒚
𝒙 𝟐 − 𝒏𝒙 𝟐
𝒂 = 𝒚 − 𝒃𝒙
• Use your calculator to calculate the regression
coefficients.
CALCULATETHE REGRESSIONCOEFFICIENT:
MARKS ACHIEVEDVERSUSTIME STUDIED
STUDENT TIME STUDIED
(X) IN HOURS
MARKS
ACHIEVED (Y)
IN %
A 2 60
B 5 85
C 1 30
D 4 70
E 2 40
LINE OF BESTFIT
𝒚 = 𝟐𝟏. 𝟓 + 𝟏𝟐. 𝟕𝒙
INTERPRETINGA SCATTERDIAGRAM
y = 12.685x + 21.481
R² = 0.8777
0
10
20
30
40
50
60
70
80
90
0 1 2 3 4 5 6
MarksAchieved(%)
Time Studied (Hours)
Y-Values
Y-Values
Linear (Y-Values)
MEASURINGHOW WELL THELINE FITS
• How well does our line fit the real data? How accurate is
our model?
• 𝑟 , the CORRELATION COEFFICIENT tells us how STRONG
the relationship is between two variables, or how closely
the data fits our line.
• 𝑟2
, the COEFFICIENT OF DETERMINATION measure the
ACCURACY of our predictions. For a perfect fit 𝑟2
= 1 ,
closer to zero indicate a poorer fit.
• The coefficient of determination tells us that 87.8% of the
variation in students’ marks is linked to the amount of
time they spend studying. The other 12.2% is due to
other factors, like intelligence levels.
2013/05/23
4
PREDICTINGFROMTHELINE OF “BEST FIT”
If your friend only study for 2.5 hours,
will he pass the test?
𝒚 = 𝟐𝟏. 𝟓 + 𝟏𝟐. 𝟕𝒙
HOMEWORK
•Example X-Kit textbook page 310 – 311.
•Practise for your exams page 312 number
1, 2, 3, 4, 5, & 6.
•Par B.3 (page B14) all odd number
questions.

Más contenido relacionado

La actualidad más candente

Mann Whitney U Test And Chi Squared
Mann Whitney U Test And Chi SquaredMann Whitney U Test And Chi Squared
Mann Whitney U Test And Chi Squared
guest2137aa
 
Linear graph[1]edit
Linear graph[1]editLinear graph[1]edit
Linear graph[1]edit
smarshall9
 

La actualidad más candente (17)

Medidas de tendencia central
Medidas de tendencia centralMedidas de tendencia central
Medidas de tendencia central
 
Data analysis, statistics, and probability review
Data analysis, statistics, and probability reviewData analysis, statistics, and probability review
Data analysis, statistics, and probability review
 
Quartile (ungrouped)
Quartile (ungrouped)Quartile (ungrouped)
Quartile (ungrouped)
 
Review on module 9
Review on module 9Review on module 9
Review on module 9
 
Khurram
KhurramKhurram
Khurram
 
quartiles,deciles,percentiles.ppt
quartiles,deciles,percentiles.pptquartiles,deciles,percentiles.ppt
quartiles,deciles,percentiles.ppt
 
Partitial values
Partitial valuesPartitial values
Partitial values
 
Ch 1 Review
Ch 1 ReviewCh 1 Review
Ch 1 Review
 
Exponents and powers--Part1
Exponents and powers--Part1Exponents and powers--Part1
Exponents and powers--Part1
 
Mann Whitney U Test And Chi Squared
Mann Whitney U Test And Chi SquaredMann Whitney U Test And Chi Squared
Mann Whitney U Test And Chi Squared
 
4.3 Dilation and Composition
4.3 Dilation and Composition4.3 Dilation and Composition
4.3 Dilation and Composition
 
Quartile Deviation
Quartile DeviationQuartile Deviation
Quartile Deviation
 
Stopping Problems
Stopping ProblemsStopping Problems
Stopping Problems
 
Lesson 2 percentiles
Lesson 2   percentilesLesson 2   percentiles
Lesson 2 percentiles
 
Linear graph[1]edit
Linear graph[1]editLinear graph[1]edit
Linear graph[1]edit
 
Understanding Statistics 1#12 Quartiles of Data
Understanding Statistics 1#12 Quartiles of DataUnderstanding Statistics 1#12 Quartiles of Data
Understanding Statistics 1#12 Quartiles of Data
 
Education 309 – Statistics for Educational Research
Education 309 – Statistics for Educational ResearchEducation 309 – Statistics for Educational Research
Education 309 – Statistics for Educational Research
 

Destacado (6)

Eng lesson 1 onb 2_a02_2011
Eng lesson 1 onb 2_a02_2011Eng lesson 1 onb 2_a02_2011
Eng lesson 1 onb 2_a02_2011
 
Ma3bfet par 10.7 7 aug 2014
Ma3bfet par 10.7 7 aug 2014Ma3bfet par 10.7 7 aug 2014
Ma3bfet par 10.7 7 aug 2014
 
07 06-2013-ma-nueve93
07 06-2013-ma-nueve9307 06-2013-ma-nueve93
07 06-2013-ma-nueve93
 
Chapter 8 making sense of sample data
Chapter 8 making sense of sample dataChapter 8 making sense of sample data
Chapter 8 making sense of sample data
 
Les couleurs
Les couleursLes couleurs
Les couleurs
 
Asp.NET Masterpages
Asp.NET MasterpagesAsp.NET Masterpages
Asp.NET Masterpages
 

Similar a Chapter 13 finding relationships

Predictive Modelling
Predictive ModellingPredictive Modelling
Predictive Modelling
Rajiv Advani
 
Mod 4 data presentation graphs bar charts tables
Mod 4 data presentation graphs bar charts tablesMod 4 data presentation graphs bar charts tables
Mod 4 data presentation graphs bar charts tables
mpape
 
Pertemuan 1 pengukuran te d3
Pertemuan 1   pengukuran te d3Pertemuan 1   pengukuran te d3
Pertemuan 1 pengukuran te d3
atikah ardi
 

Similar a Chapter 13 finding relationships (20)

Data mining 8 estimasi linear regression
Data mining 8   estimasi linear regressionData mining 8   estimasi linear regression
Data mining 8 estimasi linear regression
 
STANDARD DEVIATION (2018) (STATISTICS)
STANDARD DEVIATION (2018) (STATISTICS)STANDARD DEVIATION (2018) (STATISTICS)
STANDARD DEVIATION (2018) (STATISTICS)
 
Measures of Central Tendency.pptx
Measures of Central Tendency.pptxMeasures of Central Tendency.pptx
Measures of Central Tendency.pptx
 
Predictive Modelling
Predictive ModellingPredictive Modelling
Predictive Modelling
 
Lesson 27 using statistical techniques in analyzing data
Lesson 27 using statistical techniques in analyzing dataLesson 27 using statistical techniques in analyzing data
Lesson 27 using statistical techniques in analyzing data
 
Measures of-variation
Measures of-variationMeasures of-variation
Measures of-variation
 
Frequency Distribution Table 3
Frequency Distribution Table 3Frequency Distribution Table 3
Frequency Distribution Table 3
 
frequency distribution table 3
frequency distribution table 3frequency distribution table 3
frequency distribution table 3
 
Machine learning meetup
Machine learning meetupMachine learning meetup
Machine learning meetup
 
Types of graphs
Types of graphsTypes of graphs
Types of graphs
 
Measures of central tendency - STATISTICS
Measures of central tendency - STATISTICSMeasures of central tendency - STATISTICS
Measures of central tendency - STATISTICS
 
Class X Mathematics Study Material
Class X Mathematics Study MaterialClass X Mathematics Study Material
Class X Mathematics Study Material
 
Mod 4 data presentation graphs bar charts tables
Mod 4 data presentation graphs bar charts tablesMod 4 data presentation graphs bar charts tables
Mod 4 data presentation graphs bar charts tables
 
MEASURES OF DISPERSION NOTES.pdf
MEASURES OF DISPERSION NOTES.pdfMEASURES OF DISPERSION NOTES.pdf
MEASURES OF DISPERSION NOTES.pdf
 
ITEM ANALYSIS
ITEM ANALYSIS ITEM ANALYSIS
ITEM ANALYSIS
 
Ee184405 statistika dan stokastik statistik deskriptif 1 grafik
Ee184405 statistika dan stokastik   statistik deskriptif 1 grafikEe184405 statistika dan stokastik   statistik deskriptif 1 grafik
Ee184405 statistika dan stokastik statistik deskriptif 1 grafik
 
633e639cc8efda0018e1ca63_##_Graphical Representation 01 _ Class Notes __ (Vic...
633e639cc8efda0018e1ca63_##_Graphical Representation 01 _ Class Notes __ (Vic...633e639cc8efda0018e1ca63_##_Graphical Representation 01 _ Class Notes __ (Vic...
633e639cc8efda0018e1ca63_##_Graphical Representation 01 _ Class Notes __ (Vic...
 
refreshENM1500.pdf
refreshENM1500.pdfrefreshENM1500.pdf
refreshENM1500.pdf
 
Pertemuan 1 pengukuran te d3
Pertemuan 1   pengukuran te d3Pertemuan 1   pengukuran te d3
Pertemuan 1 pengukuran te d3
 
plc learn
plc learnplc learn
plc learn
 

Más de Celumusa Godfrey Nkosi (6)

Ma3bfet par 10.6 5 aug 2014
Ma3bfet par 10.6 5 aug 2014Ma3bfet par 10.6 5 aug 2014
Ma3bfet par 10.6 5 aug 2014
 
Ma3bfet par 10.5 31 julie 2014
Ma3bfet par 10.5 31 julie 2014Ma3bfet par 10.5 31 julie 2014
Ma3bfet par 10.5 31 julie 2014
 
Chapter 8 addisional content
Chapter 8 addisional contentChapter 8 addisional content
Chapter 8 addisional content
 
Chapter 9 learning more about sample data(1)
Chapter 9 learning more about sample data(1)Chapter 9 learning more about sample data(1)
Chapter 9 learning more about sample data(1)
 
The law of sines
The law of sinesThe law of sines
The law of sines
 
Models for mathematical centre methodology 2 a
Models for mathematical centre methodology 2 aModels for mathematical centre methodology 2 a
Models for mathematical centre methodology 2 a
 

Último

Spellings Wk 3 English CAPS CARES Please Practise
Spellings Wk 3 English CAPS CARES Please PractiseSpellings Wk 3 English CAPS CARES Please Practise
Spellings Wk 3 English CAPS CARES Please Practise
AnaAcapella
 
Russian Escort Service in Delhi 11k Hotel Foreigner Russian Call Girls in Delhi
Russian Escort Service in Delhi 11k Hotel Foreigner Russian Call Girls in DelhiRussian Escort Service in Delhi 11k Hotel Foreigner Russian Call Girls in Delhi
Russian Escort Service in Delhi 11k Hotel Foreigner Russian Call Girls in Delhi
kauryashika82
 
Seal of Good Local Governance (SGLG) 2024Final.pptx
Seal of Good Local Governance (SGLG) 2024Final.pptxSeal of Good Local Governance (SGLG) 2024Final.pptx
Seal of Good Local Governance (SGLG) 2024Final.pptx
negromaestrong
 

Último (20)

How to Give a Domain for a Field in Odoo 17
How to Give a Domain for a Field in Odoo 17How to Give a Domain for a Field in Odoo 17
How to Give a Domain for a Field in Odoo 17
 
Mehran University Newsletter Vol-X, Issue-I, 2024
Mehran University Newsletter Vol-X, Issue-I, 2024Mehran University Newsletter Vol-X, Issue-I, 2024
Mehran University Newsletter Vol-X, Issue-I, 2024
 
Spellings Wk 3 English CAPS CARES Please Practise
Spellings Wk 3 English CAPS CARES Please PractiseSpellings Wk 3 English CAPS CARES Please Practise
Spellings Wk 3 English CAPS CARES Please Practise
 
SKILL OF INTRODUCING THE LESSON MICRO SKILLS.pptx
SKILL OF INTRODUCING THE LESSON MICRO SKILLS.pptxSKILL OF INTRODUCING THE LESSON MICRO SKILLS.pptx
SKILL OF INTRODUCING THE LESSON MICRO SKILLS.pptx
 
psychiatric nursing HISTORY COLLECTION .docx
psychiatric  nursing HISTORY  COLLECTION  .docxpsychiatric  nursing HISTORY  COLLECTION  .docx
psychiatric nursing HISTORY COLLECTION .docx
 
ICT Role in 21st Century Education & its Challenges.pptx
ICT Role in 21st Century Education & its Challenges.pptxICT Role in 21st Century Education & its Challenges.pptx
ICT Role in 21st Century Education & its Challenges.pptx
 
Grant Readiness 101 TechSoup and Remy Consulting
Grant Readiness 101 TechSoup and Remy ConsultingGrant Readiness 101 TechSoup and Remy Consulting
Grant Readiness 101 TechSoup and Remy Consulting
 
Asian American Pacific Islander Month DDSD 2024.pptx
Asian American Pacific Islander Month DDSD 2024.pptxAsian American Pacific Islander Month DDSD 2024.pptx
Asian American Pacific Islander Month DDSD 2024.pptx
 
Russian Escort Service in Delhi 11k Hotel Foreigner Russian Call Girls in Delhi
Russian Escort Service in Delhi 11k Hotel Foreigner Russian Call Girls in DelhiRussian Escort Service in Delhi 11k Hotel Foreigner Russian Call Girls in Delhi
Russian Escort Service in Delhi 11k Hotel Foreigner Russian Call Girls in Delhi
 
Seal of Good Local Governance (SGLG) 2024Final.pptx
Seal of Good Local Governance (SGLG) 2024Final.pptxSeal of Good Local Governance (SGLG) 2024Final.pptx
Seal of Good Local Governance (SGLG) 2024Final.pptx
 
Accessible Digital Futures project (20/03/2024)
Accessible Digital Futures project (20/03/2024)Accessible Digital Futures project (20/03/2024)
Accessible Digital Futures project (20/03/2024)
 
Food safety_Challenges food safety laboratories_.pdf
Food safety_Challenges food safety laboratories_.pdfFood safety_Challenges food safety laboratories_.pdf
Food safety_Challenges food safety laboratories_.pdf
 
Kodo Millet PPT made by Ghanshyam bairwa college of Agriculture kumher bhara...
Kodo Millet  PPT made by Ghanshyam bairwa college of Agriculture kumher bhara...Kodo Millet  PPT made by Ghanshyam bairwa college of Agriculture kumher bhara...
Kodo Millet PPT made by Ghanshyam bairwa college of Agriculture kumher bhara...
 
Spatium Project Simulation student brief
Spatium Project Simulation student briefSpatium Project Simulation student brief
Spatium Project Simulation student brief
 
Unit-IV; Professional Sales Representative (PSR).pptx
Unit-IV; Professional Sales Representative (PSR).pptxUnit-IV; Professional Sales Representative (PSR).pptx
Unit-IV; Professional Sales Representative (PSR).pptx
 
On National Teacher Day, meet the 2024-25 Kenan Fellows
On National Teacher Day, meet the 2024-25 Kenan FellowsOn National Teacher Day, meet the 2024-25 Kenan Fellows
On National Teacher Day, meet the 2024-25 Kenan Fellows
 
Key note speaker Neum_Admir Softic_ENG.pdf
Key note speaker Neum_Admir Softic_ENG.pdfKey note speaker Neum_Admir Softic_ENG.pdf
Key note speaker Neum_Admir Softic_ENG.pdf
 
Mixin Classes in Odoo 17 How to Extend Models Using Mixin Classes
Mixin Classes in Odoo 17  How to Extend Models Using Mixin ClassesMixin Classes in Odoo 17  How to Extend Models Using Mixin Classes
Mixin Classes in Odoo 17 How to Extend Models Using Mixin Classes
 
Making communications land - Are they received and understood as intended? we...
Making communications land - Are they received and understood as intended? we...Making communications land - Are they received and understood as intended? we...
Making communications land - Are they received and understood as intended? we...
 
ComPTIA Overview | Comptia Security+ Book SY0-701
ComPTIA Overview | Comptia Security+ Book SY0-701ComPTIA Overview | Comptia Security+ Book SY0-701
ComPTIA Overview | Comptia Security+ Book SY0-701
 

Chapter 13 finding relationships

  • 1. 2013/05/23 1 STATISTICS 2. X-Kit Textbook Chapter 13 3. Precalculus Textbook Appendix B: Concepts in Statistics Par B.3 Information23 May 2013 • Find information on Edulink on: • Calculation of Semester Marks. • Consultation Time during the June Exam. • Exam Info. • Report any problems with marks to Ms Durandt as soon as possible, CR523. • Semester Tests available at the Collection Facility at the Mathematics Department. • Find all memos on Edulink. • Second Semester? CONTENT Dependent & Independent Variables Scatter Diagrams Correlation Regression TABLE: MARKS ACHIEVEDVERSUSTIME STUDIED STUDENT TIME STUDIED (X) IN HOURS MARKS ACHIEVED (Y) IN % A 2 60 B 5 85 C 1 30 D 4 70 E 2 40 SCATTERDIAGRAM 2, 60 5, 85 1, 30 4, 70 2, 40 0 10 20 30 40 50 60 70 80 90 0 1 2 3 4 5 6 MarksAchieved(%) Time Studied (Hours) Scatter Diagram of marks achieved versus time studied Y-Values INTERPRETINGA SCATTERDIAGRAM 0 10 20 30 40 50 60 70 80 90 0 1 2 3 4 5 6 MarksAchieved(%) Time Studied (Hours) Y-Values Linear (Y-Values)
  • 2. 2013/05/23 2 IS THERELATIONSHIPBETWEENVARIABLES STRONGOR WEAK? POSITIVE CORRELATION 0 5 10 15 20 25 30 35 40 0 2 4 6 Y-Values NEGATIVE CORRELATION 0 5 10 15 20 25 0 2 4 6 Y-Values IS THERELATIONSHIPBETWEENVARIABLES STRONGOR WEAK? NO CORRELATION 0 5 10 15 20 25 30 35 0 10 20 30 40 Y-Values NON-LINEAR CORRELATION 0 0.5 1 1.5 2 2.5 3 3.5 0 1 2 3 Y-Values SUMMINGUP CORRELATIONIN A NUMBER • The correlation coefficient 𝑟 is a number that tells us exactly how strong or weak the correlation between two variables is. • Calculate 𝑟 by using the formula: 𝒓 = 𝒙𝒚 − 𝒏𝒙 𝒚 𝒙 𝟐 − 𝒏𝒙 𝟐 𝒚 𝟐 − 𝒏𝒚 𝟐 • Calculate 𝑟 by using your calculator. THE MEANINGOF 𝒓 Perfect Strong Mode- rate Weak No Linear Correlation Weak Mode- rate Strong Perfect -1.00 -0.75 -0.50 -0.25 0.00 +0.25 +0.50 +0.75 +1.00 NEGATIVE CORRELATION POSITIVE CORRELATION CALCULATETHE CORRELATIONCOEFFICIENT: MARKS ACHIEVEDVERSUSTIME STUDIED STUDENT TIME STUDIED (X) IN HOURS MARKS ACHIEVED (Y) IN % A 2 60 B 5 85 C 1 30 D 4 70 E 2 40 SOLUTION 𝒓 = 𝟎. 𝟗𝟑𝟕 Very Strong Positive Linear Relationship
  • 3. 2013/05/23 3 MAKE PREDICTIONS Follow the plan: •Find the LINE OF BEST FIT. •Decide how “well” it fits. •From a good fit we can make predictions. LINE OF BESTFIT (REGRESSIONLINE) • Formula 𝒚 = 𝒂 + 𝒃𝒙 • Formula for the regression coefficients: 𝒃 = 𝒙𝒚 − 𝒏𝒙 𝒚 𝒙 𝟐 − 𝒏𝒙 𝟐 𝒂 = 𝒚 − 𝒃𝒙 • Use your calculator to calculate the regression coefficients. CALCULATETHE REGRESSIONCOEFFICIENT: MARKS ACHIEVEDVERSUSTIME STUDIED STUDENT TIME STUDIED (X) IN HOURS MARKS ACHIEVED (Y) IN % A 2 60 B 5 85 C 1 30 D 4 70 E 2 40 LINE OF BESTFIT 𝒚 = 𝟐𝟏. 𝟓 + 𝟏𝟐. 𝟕𝒙 INTERPRETINGA SCATTERDIAGRAM y = 12.685x + 21.481 R² = 0.8777 0 10 20 30 40 50 60 70 80 90 0 1 2 3 4 5 6 MarksAchieved(%) Time Studied (Hours) Y-Values Y-Values Linear (Y-Values) MEASURINGHOW WELL THELINE FITS • How well does our line fit the real data? How accurate is our model? • 𝑟 , the CORRELATION COEFFICIENT tells us how STRONG the relationship is between two variables, or how closely the data fits our line. • 𝑟2 , the COEFFICIENT OF DETERMINATION measure the ACCURACY of our predictions. For a perfect fit 𝑟2 = 1 , closer to zero indicate a poorer fit. • The coefficient of determination tells us that 87.8% of the variation in students’ marks is linked to the amount of time they spend studying. The other 12.2% is due to other factors, like intelligence levels.
  • 4. 2013/05/23 4 PREDICTINGFROMTHELINE OF “BEST FIT” If your friend only study for 2.5 hours, will he pass the test? 𝒚 = 𝟐𝟏. 𝟓 + 𝟏𝟐. 𝟕𝒙 HOMEWORK •Example X-Kit textbook page 310 – 311. •Practise for your exams page 312 number 1, 2, 3, 4, 5, & 6. •Par B.3 (page B14) all odd number questions.