

Recomendados
Más contenido relacionado
Más de Chaba Tamasi
Más de Chaba Tamasi (15)
Último
Último (20)
Toronto Market Watch MAY 2014
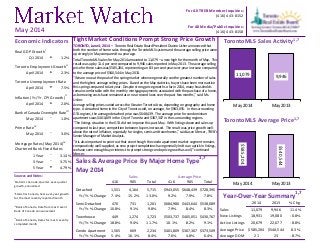
- 1. Tight Market Conditions Prompt Strong Price Growth TORONTO, June 4, 2014 – Toronto Real Estate Board President Dianne Usher announced that both the number of home sales through the TorontoMLS system and the average selling price were up strongly in May compared to a year ago. Total TorontoMLS sales for May 2014 amounted to 11,079 – a new high for the month of May. This result was up by 11.4 per cent compared to 9,946 sales reported in May 2013. The average selling price for these sales was $585,204, representing an 8.3 per cent year-over-year increase compared to the average price of $540,544 in May 2013. “We are now at the peak of the spring market when we generally see the greatest number of sales and the highest average selling prices. Based on the May statistics, buyers have been more active this spring compared to last year. Despite strong price growth so far in 2014, many households remain comfortable with the monthly mortgage payments associated with the purchase of a home, as borrowing costs have remained at or near record lows over the past few months,” said Ms. Usher. Average selling prices varied across the Greater Toronto Area, depending on geography and home type. A detached home in the City of Toronto sold, on average, for $943,055. In the surrounding GTA regions, the average detached price was $648,439. The average price for condominium apartments was $401,809 in the City of Toronto and $307,307 in the surrounding regions. “The listings situation in the GTA did not improve this past May. With listings down and sales up compared to last year, competition between buyers increased. The result was price growth well- above the rate of inflation, especially for singles, semis and townhomes,” said Jason Mercer, TREB’s Senior Manager of Market Analysis. “It is also important to point out that even though the condo apartment market segment remains comparatively well-supplied, as new project completions have generally led to an uptick in listings, we have seen enough buyer interest to prompt strong condo price growth as well,” continued Mercer. 11,079 9,946 May 2014 May 2013 $585,204 $540,544 May 2014 May 2013 For All TREB Member Inquiries: (416) 443-8152 For All Media/Public Inquiries: (416) 443-8158May 2014 Real GDP Growthi Q1 2014 t 1.2% Toronto Employment Growthii April 2014 t 2.3% Toronto Unemployment Rate April 2014 u 7.5% Inflation (Yr./Yr. CPI Growth)ii April 2014 t 2.0% Bank of Canada Overnight Rateiii May 2014 q 1.0% Prime Rate iv May 2014 q 3.0% Mortgage Rates (May 2014) iv Chartered Bank Fixed Rates 1 Year q 3.14% 3 Year q 3.75% 5 Year u 4.79% Sources and Notes: Economic Indicators i Statistics Canada, Quarter-over-quarter growth, annualized ii Statistics Canada, Year-over-year growth for the most recently reported month iii Bank of Canada, Rate from most recent Bank of Canada announcement iv Bank of Canada, Rates for most recently completed month Sales & Average Price By Major Home Type1,7 416 905 Total 416 905 Total Detached 1,551 4,164 5,715 $943,055 $648,439 $728,395 Yr./Yr. % Change 7.4% 15.2% 13.0% 9.2% 7.9% 7.8% Semi-Detached 470 731 1,201 $684,980 $443,644 $538,089 Yr./Yr. % Change 10.8% 9.1% 9.8% 7.9% 8.4% 8.3% Townhouse 449 1,274 1,723 $503,737 $405,051 $430,767 Yr./Yr. % Change 18.8% 9.4% 11.7% 10.1% 8.2% 9.1% Condo Apartment 1,565 669 2,234 $401,809 $307,307 $373,509 Yr./Yr. % Change 5.4% 16.1% 8.4% 7.6% 4.8% 6.4% May 2014 Sales Average Price 2014 2013 % Chg. Sales 11,079 9,946 11.4% New Listings 18,931 19,080 -0.8% Active Listings 20,679 22,677 -8.8% Average Price $585,204 $540,544 8.3% Average DOM 21 23 -8.7% Year-Over-Year Summary 1,7 TorontoMLS Sales Activity1,7 TorontoMLS Average Price1,7
- 2. Price Range Detached Semi-Detached Att/Row/Twnhouse Condo Townhouse Condo Apt Link Co-op Apt Det Condo Co-ownership Apt Total $0 to $99,999 0 0 0 0 15 0 1 0 0 16 $100,000 to $199,999 45 4 0 38 203 0 3 0 1 294 $200,000 to $299,999 242 60 56 203 663 26 4 1 0 1,255 $300,000 to $399,999 554 190 257 296 699 37 0 7 1 2,041 $400,000 to $499,999 891 373 288 174 331 24 1 2 0 2,084 $500,000 to $599,999 983 280 148 58 155 43 1 0 0 1,668 $600,000 to $699,999 813 123 86 15 68 41 0 0 0 1,146 $700,000 to $799,999 600 63 38 12 34 13 0 0 0 760 $800,000 to $899,999 438 39 15 5 13 0 0 0 0 510 $900,000 to $999,999 293 30 15 4 17 0 0 0 0 359 $1,000,000 to $1,249,999 336 23 7 5 14 0 0 0 0 385 $1,250,000 to $1,499,999 199 6 1 1 6 0 0 0 0 213 $1,500,000 to $1,749,999 98 6 0 1 2 0 0 0 0 107 $1,750,000 to $1,999,999 68 0 0 0 2 0 0 0 0 70 $2,000,000 + 155 4 0 0 12 0 0 0 0 171 Total Sales 5,715 1,201 911 812 2,234 184 10 10 2 11,079 Share of Total Sales 51.6% 10.8% 8.2% 7.3% 20.2% 1.7% 0.1% 0.1% 0.0% - Average Price $728,395 $538,089 $478,646 $377,052 $373,509 $495,750 $235,750 $373,550 $257,000 $585,204 Price Range Detached Semi-Detached Att/Row/Twnhouse Condo Townhouse Condo Apt Link Co-op Apt Det Condo Co-ownership Apt Total $0 to $99,999 6 0 1 10 51 0 1 0 2 71 $100,000 to $199,999 146 10 4 153 892 0 12 0 6 1,223 $200,000 to $299,999 776 214 224 727 2,812 84 10 6 14 4,867 $300,000 to $399,999 1,972 815 899 989 2,670 120 4 12 6 7,487 $400,000 to $499,999 3,093 1,253 969 573 1,222 107 8 6 0 7,231 $500,000 to $599,999 3,257 875 571 170 545 145 3 4 1 5,571 $600,000 to $699,999 2,701 395 269 67 277 117 4 3 0 3,833 $700,000 to $799,999 1,964 188 124 58 121 28 0 2 0 2,485 $800,000 to $899,999 1,428 127 52 17 44 8 1 0 0 1,677 $900,000 to $999,999 931 82 30 13 42 0 2 0 0 1,100 $1,000,000 to $1,249,999 1,145 55 27 13 47 1 1 1 0 1,290 $1,250,000 to $1,499,999 615 30 9 4 30 0 0 0 0 688 $1,500,000 to $1,749,999 349 17 3 4 14 0 0 0 0 387 $1,750,000 to $1,999,999 202 3 1 1 9 0 0 0 0 216 $2,000,000 + 461 14 0 1 23 0 0 0 0 499 Total Sales 19,046 4,078 3,183 2,800 8,799 610 46 34 29 38,625 Share of Total Sales 49.3% 10.6% 8.2% 7.2% 22.8% 1.6% 0.1% 0.1% 0.1% - Average Price $719,658 $522,792 $473,804 $374,848 $358,867 $487,867 $373,840 $445,574 $247,555 $566,758 SALES BY PRICE RANGE AND HOUSE TYPE1,7 MAY 2014 SALES BY PRICE RANGE AND HOUSE TYPE1,7 YEAR-TO-DATE, 2014 Market Watch, May 2014 2 Toronto Real Estate Board
- 3. ALL HOME TYPES, MAY 2014 ALL TREB AREAS Number of Sales Dollar Volume 1 Average Price 1 Median Price 1 New Listings 2 SNLR (Trend) 8 Active Listings 3 Mos. Inv. (Trend)9 Avg. SP/LP 4 Avg. DOM 5 TREB Total 11,079 $6,483,480,435 $585,204 $490,000 18,931 57.9% 20,679 2.4 100% 21 Halton Region 986 $617,938,860 $626,713 $531,750 1,486 64.1% 1,692 2.2 98% 22 Burlington 186 $96,613,601 $519,428 $505,000 290 64.8% 370 2.5 99% 26 Halton Hills 127 $64,496,505 $507,846 $482,000 200 64.8% 219 2.5 99% 23 Milton 276 $132,843,131 $481,316 $456,500 438 65.9% 393 1.7 99% 17 Oakville 397 $323,985,623 $816,085 $696,000 558 62.2% 710 2.5 98% 23 Peel Region 2,307 $1,141,144,343 $494,644 $446,000 4,038 55.5% 4,268 2.4 98% 22 Brampton 1,015 $457,676,218 $450,913 $425,000 1,685 55.9% 1,647 2.3 98% 22 Caledon 91 $60,002,500 $659,368 $582,500 183 50.4% 316 4.1 97% 37 Mississauga 1,201 $623,465,625 $519,122 $475,000 2,170 55.6% 2,305 2.4 98% 21 City of Toronto 4,069 $2,655,757,881 $652,681 $522,000 7,360 55.1% 8,310 2.5 101% 20 York Region 2,059 $1,423,272,677 $691,245 $625,000 3,604 58.3% 3,812 2.3 99% 19 Aurora 119 $76,547,652 $643,258 $600,300 187 64.6% 181 2.3 99% 20 E. Gwillimbury 40 $24,592,002 $614,800 $520,000 64 67.1% 71 2.9 98% 28 Georgina 121 $44,362,092 $366,629 $350,000 178 65.4% 217 2.5 98% 27 King 40 $40,807,290 $1,020,182 $872,000 89 42.5% 184 6.3 94% 51 Markham 543 $401,652,909 $739,692 $669,000 897 60.8% 862 1.9 101% 16 Newmarket 198 $103,811,540 $524,301 $500,500 283 70.9% 211 1.4 99% 16 Richmond Hill 413 $311,395,182 $753,983 $700,000 799 54.7% 848 2.4 100% 17 Vaughan 483 $357,129,910 $739,399 $670,000 927 53.9% 1,011 2.6 98% 20 Whitchurch-Stouffville 102 $62,974,100 $617,393 $565,000 180 56.8% 227 3.1 98% 21 Durham Region 1,334 $521,166,075 $390,679 $363,000 1,872 68.1% 1,648 1.7 99% 19 Ajax 262 $111,481,841 $425,503 $395,000 332 71.2% 227 1.2 99% 16 Brock 25 $6,772,200 $270,888 $250,000 52 53.9% 97 5.7 97% 42 Clarington 214 $73,268,371 $342,376 $325,000 311 67.8% 271 1.6 98% 18 Oshawa 335 $101,758,410 $303,756 $289,500 437 70.2% 351 1.3 99% 17 Pickering 158 $76,909,390 $486,768 $455,000 237 66.0% 202 1.7 99% 21 Scugog 36 $15,591,400 $433,094 $401,000 84 55.6% 125 3.9 97% 23 Uxbridge 41 $23,194,100 $565,710 $472,000 82 60.4% 123 4.4 97% 44 Whitby 263 $112,190,363 $426,579 $401,000 337 70.1% 252 1.3 99% 16 Dufferin County 65 $24,155,700 $371,626 $345,000 117 65.4% 180 2.8 98% 32 Orangeville 65 $24,155,700 $371,626 $345,000 117 65.4% 180 2.8 98% 32 Simcoe County 259 $100,044,899 $386,274 $355,000 454 60.5% 769 3.5 98% 34 Adjala-Tosorontio 21 $9,014,800 $429,276 $418,000 39 51.4% 79 5.6 98% 51 Bradford West Gwillimbury 65 $29,178,150 $448,895 $422,000 107 58.9% 176 2.8 98% 30 Essa 50 $16,301,800 $326,036 $312,500 68 67.0% 90 3.1 98% 27 Innisfil 55 $21,528,376 $391,425 $335,000 136 55.7% 224 4.1 97% 32 New Tecumseth 68 $24,021,773 $353,261 $328,000 104 67.2% 200 3.3 98% 37 SUMMARY OF EXISTING HOME TRANSACTIONS ! TURN PAGE FOR CITY OF TORONTO TABLES OR CLICK HERE: Market Watch, May 2014 3 Toronto Real Estate Board
- 4. Market Watch, May 2014 July 2010Page 3 4 Toronto Real Estate Board ALL HOME TYPES, MAY 2014 CITY OF TORONTO MUNICIPAL BREAKDOWN Number of Sales Dollar Volume 1 Average Price 1 Median Price 1 New Listings 2 SNLR (Trend) 8 Active Listings 3 Mos. Inv. (Trend)9 Avg. SP/LP 4 Avg. DOM 5 TREB Total 11,079 $6,483,480,435 $585,204 $490,000 18,931 57.9% 20,679 2.4 100% 21 City of Toronto Total 4,069 $2,655,757,881 $652,681 $522,000 7,360 55.1% 8,310 2.5 101% 20 Toronto West 1,038 $589,537,837 $567,956 $502,500 1,862 56.8% 2,147 2.5 101% 22 Toronto W01 53 $39,746,676 $749,937 $590,000 120 53.1% 141 2.6 102% 20 Toronto W02 116 $80,801,600 $696,566 $661,500 156 68.9% 117 1.3 104% 13 Toronto W03 90 $45,012,731 $500,141 $507,500 151 65.3% 120 1.5 103% 16 Toronto W04 89 $40,253,607 $452,288 $453,000 139 64.8% 158 2.0 101% 20 Toronto W05 139 $58,171,486 $418,500 $442,500 241 57.0% 295 2.8 99% 33 Toronto W06 144 $74,180,883 $515,145 $523,500 312 46.4% 472 3.8 101% 25 Toronto W07 44 $37,189,827 $845,223 $808,500 52 71.6% 37 1.3 102% 13 Toronto W08 219 $151,552,368 $692,020 $565,000 419 53.5% 497 2.7 99% 24 Toronto W09 59 $29,397,821 $498,268 $546,000 111 58.3% 124 2.5 101% 21 Toronto W10 85 $33,230,838 $390,951 $420,000 161 56.5% 186 2.7 99% 22 Toronto Central 1,816 $1,430,127,311 $787,515 $547,950 3,702 49.2% 4,738 3.1 100% 22 Toronto C01 471 $232,795,899 $494,259 $412,000 1,139 42.9% 1,634 3.8 100% 26 Toronto C02 83 $94,925,373 $1,143,679 $839,000 167 48.3% 265 3.8 101% 23 Toronto C03 68 $67,917,453 $998,786 $711,250 122 58.4% 118 2.4 102% 19 Toronto C04 142 $197,176,993 $1,388,570 $1,297,500 216 53.7% 215 2.5 100% 19 Toronto C06 34 $20,808,900 $612,026 $597,500 63 48.3% 96 3.3 99% 19 Toronto C07 128 $86,867,078 $678,649 $496,190 280 47.9% 374 3.1 98% 22 Toronto C08 159 $81,934,523 $515,311 $440,000 332 52.9% 433 2.8 100% 23 Toronto C09 48 $92,569,372 $1,928,529 $1,725,000 89 54.2% 110 2.8 98% 19 Toronto C10 66 $53,210,446 $806,219 $842,500 125 60.8% 123 1.9 103% 11 Toronto C11 63 $57,798,200 $917,432 $775,000 74 66.8% 63 1.6 103% 16 Toronto C12 56 $98,647,200 $1,761,557 $1,712,500 106 45.2% 154 4.4 98% 25 Toronto C13 106 $85,946,380 $810,815 $715,100 135 65.4% 115 1.7 104% 17 Toronto C14 207 $145,565,526 $703,215 $450,000 496 44.2% 655 3.6 98% 24 Toronto C15 185 $113,963,968 $616,021 $510,000 358 54.1% 383 2.5 101% 19 Toronto East 1,215 $636,092,733 $523,533 $515,000 1,796 65.6% 1,425 1.6 103% 15 Toronto E01 128 $87,426,359 $683,018 $673,000 182 66.2% 123 1.3 108% 11 Toronto E02 113 $85,726,339 $758,640 $715,000 179 64.7% 103 1.3 103% 11 Toronto E03 151 $94,800,576 $627,818 $595,900 198 66.4% 117 1.2 106% 13 Toronto E04 127 $55,063,695 $433,572 $478,000 193 67.2% 171 1.6 102% 15 Toronto E05 120 $57,106,652 $475,889 $410,500 169 74.1% 115 1.3 103% 13 Toronto E06 52 $29,110,751 $559,822 $548,500 96 57.4% 73 1.6 102% 14 Toronto E07 132 $61,498,948 $465,901 $453,000 190 64.5% 159 1.8 104% 17 Toronto E08 86 $39,705,745 $461,695 $470,500 116 63.4% 113 2.0 101% 21 Toronto E09 122 $47,686,788 $390,875 $422,000 198 61.4% 212 2.0 100% 21 Toronto E10 78 $39,575,000 $507,372 $500,000 121 63.4% 112 2.0 100% 19 Toronto E11 106 $38,391,880 $362,188 $375,500 154 70.0% 127 1.7 100% 16 SUMMARY OF EXISTING HOME TRANSACTIONS
- 5. ALL HOME TYPES, YEAR-TO-DATE 2014 ALL TREB AREAS Number of Sales Dollar Volume 1 Average Price 1 Median Price 1 New Listings 2 Avg. SP/LP 4 Avg. DOM 5 TREB Total 38,625 $21,891,037,866 $566,758 $475,000 70,497 99% 23 Halton Region 3,388 $2,129,146,603 $628,438 $535,000 5,668 98% 23 Burlington 625 $345,836,231 $553,338 $495,000 1,023 98% 29 Halton Hills 444 $223,091,678 $502,459 $469,700 730 98% 24 Milton 953 $468,863,396 $491,987 $459,000 1,595 99% 19 Oakville 1,366 $1,091,355,298 $798,942 $687,850 2,320 98% 24 Peel Region 8,142 $3,908,565,120 $480,050 $437,000 15,012 98% 23 Brampton 3,508 $1,527,085,347 $435,315 $415,000 6,226 98% 23 Caledon 358 $216,821,990 $605,648 $547,750 728 97% 38 Mississauga 4,276 $2,164,657,783 $506,234 $460,000 8,058 98% 22 City of Toronto 14,242 $8,824,744,153 $619,628 $487,000 27,558 101% 23 York Region 7,197 $4,845,007,113 $673,198 $615,000 13,092 99% 22 Aurora 415 $260,139,636 $626,842 $576,000 663 99% 20 E. Gwillimbury 160 $93,085,642 $581,785 $490,750 231 97% 41 Georgina 360 $126,812,404 $352,257 $347,000 604 98% 29 King 132 $122,319,590 $926,664 $827,500 345 95% 46 Markham 1,985 $1,384,107,318 $697,283 $639,000 3,409 100% 19 Newmarket 649 $340,906,448 $525,280 $500,500 969 99% 20 Richmond Hill 1,487 $1,129,587,066 $759,642 $700,000 2,899 100% 19 Vaughan 1,666 $1,173,470,563 $704,364 $650,000 3,327 98% 21 Whitchurch-Stouffville 343 $214,578,447 $625,593 $565,000 645 98% 27 Durham Region 4,517 $1,746,690,506 $386,693 $360,000 7,040 99% 20 Ajax 841 $349,869,773 $416,016 $393,000 1,241 99% 16 Brock 80 $23,832,663 $297,908 $252,950 164 96% 60 Clarington 747 $249,102,602 $333,471 $315,000 1,164 99% 20 Oshawa 1,094 $332,047,730 $303,517 $280,000 1,726 99% 18 Pickering 559 $260,709,044 $466,385 $434,000 871 99% 20 Scugog 125 $51,999,014 $415,992 $395,000 251 97% 41 Uxbridge 143 $77,874,050 $544,574 $484,000 252 97% 42 Whitby 928 $401,255,631 $432,388 $399,900 1,371 99% 16 Dufferin County 236 $85,076,950 $360,496 $340,000 411 98% 35 Orangeville 236 $85,076,950 $360,496 $340,000 411 98% 35 Simcoe County 903 $351,807,421 $389,598 $360,000 1,716 98% 40 Adjala-Tosorontio 62 $27,891,650 $449,865 $397,000 127 97% 66 Bradford West Gwillimbury 246 $111,755,644 $454,291 $430,000 479 98% 28 Essa 146 $48,142,905 $329,746 $297,000 242 98% 36 Innisfil 203 $76,999,728 $379,309 $340,000 447 97% 42 New Tecumseth 246 $87,017,494 $353,730 $327,500 421 97% 46 ! TURN PAGE FOR CITY OF TORONTO TABLES OR CLICK HERE: SUMMARY OF EXISTING HOME TRANSACTIONS Market Watch, May 2014 July 2010Page 3 5 Toronto Real Estate Board
- 6. Market Watch, May 2014 July 2010Page 3 6 Toronto Real Estate Board ALL HOME TYPES, YEAR-TO-DATE 2014 CITY OF TORONTO MUNICIPAL BREAKDOWN Number of Sales Dollar Volume 1 Average Price 1 Median Price 1 New Listings 2 Avg. SP/LP 4 Avg. DOM 5 TREB Total 38,625 $21,891,037,866 $566,758 $475,000 70,497 99% 23 City of Toronto Total 14,242 $8,824,744,153 $619,628 $487,000 27,558 101% 23 Toronto West 3,502 $1,870,070,342 $534,001 $470,500 6,744 101% 25 Toronto W01 230 $145,951,289 $634,571 $510,000 442 102% 25 Toronto W02 348 $239,573,740 $688,430 $650,000 530 105% 16 Toronto W03 278 $133,959,298 $481,868 $487,000 491 103% 16 Toronto W04 305 $134,129,619 $439,769 $445,000 532 101% 23 Toronto W05 468 $188,348,373 $402,454 $425,000 846 99% 32 Toronto W06 457 $218,522,554 $478,168 $460,000 1,175 101% 30 Toronto W07 131 $109,652,475 $837,042 $812,000 182 102% 15 Toronto W08 731 $478,545,137 $654,645 $541,000 1,519 99% 26 Toronto W09 196 $96,680,629 $493,269 $540,000 383 100% 24 Toronto W10 358 $124,707,229 $348,344 $395,000 644 99% 29 Toronto Central 6,572 $4,870,367,880 $741,078 $499,000 14,309 100% 25 Toronto C01 1,696 $833,945,727 $491,713 $409,950 4,466 99% 29 Toronto C02 300 $330,660,524 $1,102,202 $855,000 660 101% 23 Toronto C03 235 $266,798,727 $1,135,314 $785,000 426 100% 24 Toronto C04 474 $614,476,383 $1,296,364 $1,199,500 868 101% 20 Toronto C06 148 $87,029,640 $588,038 $507,450 298 100% 25 Toronto C07 500 $328,712,607 $657,425 $467,500 1,087 99% 25 Toronto C08 630 $303,452,803 $481,671 $415,500 1,317 99% 27 Toronto C09 161 $272,595,662 $1,693,141 $1,465,000 315 99% 24 Toronto C10 252 $190,891,165 $757,505 $698,500 449 102% 17 Toronto C11 245 $180,683,146 $737,482 $405,082 362 102% 21 Toronto C12 187 $345,201,690 $1,845,998 $1,620,000 434 97% 30 Toronto C13 350 $243,959,454 $697,027 $550,550 547 103% 19 Toronto C14 753 $503,260,681 $668,341 $449,000 1,835 98% 27 Toronto C15 641 $368,699,671 $575,194 $445,500 1,245 101% 23 Toronto East 4,168 $2,084,305,931 $500,073 $488,444 6,505 103% 17 Toronto E01 407 $267,966,792 $658,395 $645,000 636 107% 13 Toronto E02 346 $266,029,350 $768,871 $680,500 555 103% 12 Toronto E03 449 $282,518,217 $629,217 $600,000 687 106% 13 Toronto E04 495 $209,708,421 $423,653 $457,000 756 102% 18 Toronto E05 421 $194,155,364 $461,177 $388,000 617 103% 17 Toronto E06 197 $108,215,689 $549,318 $509,000 336 101% 14 Toronto E07 401 $173,095,468 $431,660 $404,000 657 104% 20 Toronto E08 269 $117,437,924 $436,572 $450,000 424 100% 21 Toronto E09 512 $189,151,819 $369,437 $365,750 826 100% 22 Toronto E10 288 $138,076,938 $479,434 $479,500 445 101% 20 Toronto E11 383 $137,949,949 $360,183 $360,000 566 100% 20 SUMMARY OF EXISTING HOME TRANSACTIONS
- 7. Market Watch, May 2014 Industrial Leasing July 2010Page 3 7 Toronto Real Estate Board ALL TREB AREAS Sales 1 Dollar Volume 1 Average Price 1 Median Price 1 New Listings 2 Active Listings 3 Avg. SP/LP 4 Avg. DOM 5 TREB Total 5,715 $4,162,779,164 $728,395 $614,000 9,671 9,959 99% 20- - - - - - - - Halton Region 605 $462,696,184 $764,787 $650,000 967 1,168 98% 23 Burlington 110 $69,853,713 $635,034 $613,750 181 238 99% 23 Halton Hills 99 $54,591,205 $551,426 $527,000 159 195 99% 26 Milton 128 $74,711,578 $583,684 $558,750 234 242 99% 19 Oakville 268 $263,539,688 $983,357 $835,000 393 493 98% 23- - - - - - - - Peel Region 1,111 $701,560,550 $631,468 $583,000 2,046 2,165 98% 22 Brampton 577 $303,172,978 $525,430 $492,500 1,051 1,066 98% 24 Caledon 75 $53,487,200 $713,163 $609,900 159 290 97% 41 Mississauga 459 $344,900,372 $751,417 $675,000 836 809 98% 18- - - - - - - - City of Toronto 1,551 $1,462,678,010 $943,055 $734,000 2,499 2,081 101% 15 - - - - - - - - York Region 1,240 $1,022,733,257 $824,785 $755,400 2,259 2,373 99% 19 Aurora 78 $56,726,201 $727,259 $692,000 125 124 98% 18 E. Gwillimbury 34 $22,572,502 $663,897 $608,524 61 71 97% 30 Georgina 110 $40,866,192 $371,511 $357,500 163 201 98% 27 King 35 $37,827,390 $1,080,783 $899,990 78 166 94% 55 Markham 272 $262,242,761 $964,128 $895,000 456 367 101% 15 Newmarket 115 $69,626,813 $605,451 $590,688 197 168 99% 17 Richmond Hill 244 $227,977,397 $934,334 $850,500 493 483 100% 16 Vaughan 279 $254,631,601 $912,658 $800,000 538 582 98% 18 Whitchurch-Stouffville 73 $50,262,400 $688,526 $615,000 148 211 98% 24- - - - - - - - Durham Region 956 $410,041,337 $428,914 $400,500 1,411 1,339 98% 20 Ajax 176 $82,707,341 $469,928 $455,000 231 165 99% 16 Brock 25 $6,772,200 $270,888 $250,000 50 92 97% 42 Clarington 153 $56,970,672 $372,357 $358,500 231 232 98% 21 Oshawa 253 $82,948,671 $327,860 $313,000 334 267 99% 18 Pickering 98 $57,283,990 $584,531 $543,000 162 145 98% 21 Scugog 35 $15,299,400 $437,126 $402,000 82 121 97% 23 Uxbridge 32 $21,022,600 $656,956 $534,950 70 113 97% 42 Whitby 184 $87,036,463 $473,024 $456,000 251 204 99% 16- - - - - - - - Dufferin County 46 $19,165,500 $416,641 $395,500 94 157 98% 35 Orangeville 46 $19,165,500 $416,641 $395,500 94 157 98% 35- - - - - - - - Simcoe County 206 $83,904,326 $407,303 $378,500 395 676 98% 33 Adjala-Tosorontio 21 $9,014,800 $429,276 $418,000 39 79 98% 51 Bradford West Gwillimbury 48 $23,317,150 $485,774 $471,250 85 149 98% 29 Essa 37 $12,814,300 $346,332 $335,000 57 81 98% 30 Innisfil 53 $20,964,476 $395,556 $337,000 131 219 97% 32 New Tecumseth 47 $17,793,600 $378,587 $350,000 83 148 98% 34 SUMMARY OF EXISTING HOME TRANSACTIONS DETACHED HOUSES, MAY 2014 ! TURN PAGE FOR CITY OF TORONTO TABLES OR CLICK HERE:
- 8. Market Watch, May 2014 Industrial Leasing July 2010Page 3 8 Toronto Real Estate Board CITY OF TORONTO MUNICIPAL BREAKDOWN Sales1 Dollar Volume1 Average Price1 Median Price1 New Listings2 Active Listings3 Avg. SP/LP4 Avg. DOM5 TREB Total 5,715 $4,162,779,164 $728,395 $614,000 9,671 9,959 99% 20 City of Toronto Total 1,551 $1,462,678,010 $943,055 $734,000 2,499 2,081 101% 15 Toronto West 478 $364,488,425 $762,528 $640,000 765 654 102% 16 Toronto W01 16 $21,463,610 $1,341,476 $1,025,000 27 23 102% 18 Toronto W02 45 $43,519,245 $967,094 $889,000 63 38 104% 10 Toronto W03 55 $29,460,831 $535,651 $515,000 100 74 104% 13 Toronto W04 45 $26,174,607 $581,658 $540,000 74 67 103% 14 Toronto W05 37 $21,697,918 $586,430 $565,000 55 66 99% 30 Toronto W06 56 $34,971,165 $624,485 $590,444 70 46 104% 10 Toronto W07 38 $34,136,827 $898,338 $839,000 44 30 102% 14 Toronto W08 103 $106,767,184 $1,036,575 $879,000 186 188 99% 18 Toronto W09 30 $20,057,950 $668,598 $635,000 63 53 101% 13 Toronto W10 53 $26,239,088 $495,077 $456,000 83 69 100% 20 Toronto Central 519 $748,286,437 $1,441,785 $1,229,000 865 876 100% 16 Toronto C01 11 $11,268,000 $1,024,364 $935,000 13 13 109% 9 Toronto C02 16 $25,934,873 $1,620,930 $1,646,000 35 37 102% 11 Toronto C03 39 $48,952,853 $1,255,201 $913,621 75 72 101% 17 Toronto C04 117 $177,697,493 $1,518,782 $1,380,000 172 167 100% 15 Toronto C06 15 $13,612,500 $907,500 $815,000 28 34 100% 10 Toronto C07 46 $52,995,688 $1,152,080 $940,750 108 135 98% 21 Toronto C08 1 $1,100,000 $1,100,000 $1,100,000 1 2 100% 20 Toronto C09 27 $69,546,000 $2,575,778 $2,170,000 50 59 97% 21 Toronto C10 23 $26,599,188 $1,156,486 $1,027,000 39 25 105% 4 Toronto C11 25 $42,380,100 $1,695,204 $1,610,000 28 19 103% 15 Toronto C12 37 $81,746,200 $2,209,357 $2,200,000 55 95 98% 21 Toronto C13 52 $63,248,828 $1,216,324 $1,017,500 58 39 104% 12 Toronto C14 57 $77,884,626 $1,366,397 $1,186,000 111 117 98% 20 Toronto C15 53 $55,320,088 $1,043,775 $945,000 92 62 102% 14 Toronto East 554 $349,903,148 $631,594 $575,000 869 551 103% 13 Toronto E01 29 $21,245,974 $732,620 $715,000 49 25 110% 10 Toronto E02 42 $39,168,300 $932,579 $871,000 76 41 101% 11 Toronto E03 90 $60,560,351 $672,893 $612,500 128 75 104% 12 Toronto E04 70 $37,516,975 $535,957 $525,500 112 75 104% 12 Toronto E05 37 $25,488,964 $688,891 $700,000 60 35 104% 9 Toronto E06 45 $26,123,751 $580,528 $566,000 81 59 102% 13 Toronto E07 43 $30,495,038 $709,187 $650,000 54 20 105% 9 Toronto E08 44 $27,397,545 $622,671 $569,000 63 58 101% 16 Toronto E09 63 $31,994,200 $507,844 $498,000 88 58 101% 15 Toronto E10 61 $34,413,000 $564,148 $544,000 103 74 101% 15 Toronto E11 30 $15,499,050 $516,635 $533,500 55 31 101% 13 DETACHED HOUSES, MAY 2014 SUMMARY OF EXISTING HOME TRANSACTIONS
- 9. Industrial Leasing Toronto Real Estate Board ALL TREB AREAS Sales 1 Dollar Volume 1 Average Price 1 Median Price 1 New Listings 2 Active Listings 3 Avg. SP/LP 4 Avg. DOM 5 TREB Total 1,201 $646,244,344 $538,089 $489,900 1,694 1,083 103% 13- - - - - - - - Halton Region 63 $29,740,778 $472,076 $455,100 95 73 100% 17 Burlington 11 $4,987,500 $453,409 $455,000 15 8 100% 24 Halton Hills 4 $1,570,000 $392,500 $399,550 8 6 100% 26 Milton 33 $14,836,288 $449,584 $447,000 54 42 99% 13 Oakville 15 $8,346,990 $556,466 $556,000 18 17 100% 18- - - - - - - - Peel Region 398 $175,517,292 $440,998 $436,500 591 416 99% 14 Brampton 196 $77,208,689 $393,922 $388,000 291 222 99% 16 Caledon 4 $1,756,400 $439,100 $435,750 4 3 98% 24 Mississauga 198 $96,552,203 $487,637 $481,500 296 191 100% 12- - - - - - - - City of Toronto 470 $321,940,421 $684,980 $618,500 666 387 106% 11 - - - - - - - - York Region 168 $89,158,865 $530,708 $530,000 226 137 100% 12 Aurora 8 $3,764,500 $470,563 $465,000 13 6 100% 9 E. Gwillimbury - - - - - - - - Georgina 2 $641,000 $320,500 $320,500 4 2 99% 13 King - - - - 1 1 - - Markham 38 $21,864,988 $575,394 $552,000 52 31 103% 8 Newmarket 33 $14,361,627 $435,201 $450,000 40 20 99% 14 Richmond Hill 22 $12,789,700 $581,350 $573,000 27 22 100% 13 Vaughan 53 $30,316,250 $572,005 $561,000 79 53 99% 13 Whitchurch-Stouffville 12 $5,420,800 $451,733 $457,500 10 2 101% 11- - - - - - - - Durham Region 86 $24,934,488 $289,936 $259,500 102 57 100% 11 Ajax 18 $6,699,700 $372,206 $372,450 24 13 100% 11 Brock - - - - - - - - Clarington 7 $1,652,600 $236,086 $230,000 7 1 101% 8 Oshawa 43 $10,176,488 $236,663 $235,000 52 33 99% 11 Pickering 8 $3,282,300 $410,288 $402,500 10 6 100% 18 Scugog 1 $292,000 $292,000 $292,000 - - 97% 14 Uxbridge - - - - 2 2 - - Whitby 9 $2,831,400 $314,600 $310,000 7 2 101% 14- - - - - - - - Dufferin County 8 $2,212,500 $276,563 $273,000 10 7 98% 16 Orangeville 8 $2,212,500 $276,563 $273,000 10 7 98% 16- - - - - - - - Simcoe County 8 $2,740,000 $342,500 $366,000 4 6 98% 27 Adjala-Tosorontio - - - - - - - - Bradford West Gwillimbury 6 $2,185,000 $364,167 $389,500 3 2 99% 32 Essa 1 $280,000 $280,000 $280,000 - 1 98% 8 Innisfil - - - - - - - - New Tecumseth 1 $275,000 $275,000 $275,000 1 3 98% 13 ! TURN PAGE FOR CITY OF TORONTO TABLES OR CLICK HERE: SUMMARY OF EXISTING HOME TRANSACTIONS SEMI-DETACHED HOUSES, MAY 2014 July 2010Page 3 Market Watch, May 2014 9
- 10. Industrial Leasing July 2010Page 3 Toronto Real Estate Board Market Watch, May 2014 CITY OF TORONTO MUNICIPAL BREAKDOWN Sales1 Dollar Volume1 Average Price1 Median Price1 New Listings2 Active Listings3 Avg. SP/LP4 Avg. DOM5 TREB Total 1,201 $646,244,344 $538,089 $489,900 1,694 1,083 103% 13 City of Toronto Total 470 $321,940,421 $684,980 $618,500 666 387 106% 11 Toronto West 134 $74,224,247 $553,912 $529,000 201 145 103% 16 Toronto W01 8 $5,808,581 $726,073 $760,500 7 4 109% 9 Toronto W02 29 $19,640,555 $677,261 $649,000 42 25 107% 12 Toronto W03 21 $11,320,000 $539,048 $545,000 30 25 103% 16 Toronto W04 7 $3,799,000 $542,714 $510,000 10 8 97% 22 Toronto W05 48 $22,256,600 $463,679 $453,250 78 66 99% 21 Toronto W06 5 $3,132,600 $626,520 $636,000 13 7 107% 7 Toronto W07 1 $475,000 $475,000 $475,000 - - 108% 5 Toronto W08 5 $2,791,800 $558,360 $565,000 4 1 103% 8 Toronto W09 7 $3,790,111 $541,444 $455,000 8 5 100% 20 Toronto W10 3 $1,210,000 $403,333 $404,000 9 4 98% 5 Toronto Central 127 $114,510,725 $901,659 $807,000 207 130 106% 10 Toronto C01 20 $18,288,116 $914,406 $907,500 38 26 107% 9 Toronto C02 17 $21,675,700 $1,275,041 $1,178,500 37 26 103% 8 Toronto C03 9 $6,243,800 $693,756 $608,000 11 9 110% 11 Toronto C04 6 $5,681,000 $946,833 $935,000 10 4 105% 26 Toronto C06 - - - - - - - - Toronto C07 5 $3,065,123 $613,025 $635,000 5 4 103% 6 Toronto C08 9 $9,198,000 $1,022,000 $950,000 13 8 105% 11 Toronto C09 3 $7,600,000 $2,533,333 $2,350,000 7 9 98% 14 Toronto C10 11 $10,043,000 $913,000 $910,000 14 7 109% 7 Toronto C11 11 $8,768,900 $797,173 $807,000 11 3 109% 7 Toronto C12 1 $870,000 $870,000 $870,000 4 3 109% 7 Toronto C13 13 $8,277,298 $636,715 $566,000 17 8 112% 8 Toronto C14 1 $960,000 $960,000 $960,000 1 1 99% 9 Toronto C15 21 $13,839,788 $659,038 $638,000 39 22 105% 10 Toronto East 209 $133,205,449 $637,347 $606,000 258 112 107% 9 Toronto E01 60 $43,851,397 $730,857 $703,512 67 34 109% 8 Toronto E02 46 $32,381,117 $703,937 $680,000 65 27 105% 9 Toronto E03 49 $30,899,925 $630,611 $597,500 54 18 109% 10 Toronto E04 12 $5,209,910 $434,159 $415,500 13 5 102% 8 Toronto E05 7 $3,958,200 $565,457 $560,000 13 9 107% 8 Toronto E06 2 $1,191,000 $595,500 $595,500 8 5 103% 5 Toronto E07 11 $6,037,500 $548,864 $568,500 14 4 114% 6 Toronto E08 2 $909,000 $454,500 $454,500 1 - 98% 18 Toronto E09 4 $1,631,500 $407,875 $399,000 5 1 99% 8 Toronto E10 5 $2,183,000 $436,600 $422,000 2 1 99% 24 Toronto E11 11 $4,952,900 $450,264 $433,000 16 8 102% 9 SUMMARY OF EXISTING HOME TRANSACTIONS SEMI-DETACHED HOUSES, MAY 2014 10
- 11. Industrial Leasing July 2010Page 3 Toronto Real Estate Board Market Watch, May 2014 ALL TREB AREAS Sales 1 Dollar Volume 1 Average Price 1 Median Price 1 New Listings 2 Active Listings 3 Avg. SP/LP 4 Avg. DOM 5 TREB Total 812 $306,166,212 $377,052 $361,800 1,252 1,242 99% 19- - - - - - - - Halton Region 68 $24,275,388 $356,991 $318,500 96 96 99% 21 Burlington 23 $7,325,588 $318,504 $294,000 41 39 98% 25 Halton Hills 6 $1,742,100 $290,350 $278,050 10 7 100% 13 Milton 11 $3,303,900 $300,355 $309,000 17 15 99% 21 Oakville 28 $11,903,800 $425,136 $384,500 28 35 99% 19- - - - - - - - Peel Region 264 $91,736,087 $347,485 $346,000 472 464 99% 20 Brampton 61 $17,396,100 $285,182 $265,000 108 127 98% 24 Caledon 1 $338,000 $338,000 $338,000 1 - 99% 9 Mississauga 202 $74,001,987 $366,346 $368,000 363 337 99% 19- - - - - - - - City of Toronto 292 $123,804,552 $423,988 $387,090 447 467 100% 18 - - - - - - - - York Region 101 $45,089,913 $446,435 $440,500 144 142 99% 21 Aurora 10 $5,645,500 $564,550 $578,750 15 17 97% 24 E. Gwillimbury - - - - - - - - Georgina - - - - - - - - King - - - - - 1 - - Markham 44 $20,206,006 $459,227 $457,500 67 65 100% 22 Newmarket 14 $4,978,500 $355,607 $324,450 13 9 99% 16 Richmond Hill 16 $6,685,300 $417,831 $423,500 26 28 99% 19 Vaughan 15 $7,056,607 $470,440 $467,000 22 22 99% 23 Whitchurch-Stouffville 2 $518,000 $259,000 $259,000 1 - 97% 16- - - - - - - - Durham Region 80 $19,610,100 $245,126 $249,250 83 60 100% 20 Ajax 13 $3,610,400 $277,723 $275,000 15 11 99% 14 Brock - - - - 1 4 - - Clarington 5 $1,267,899 $253,580 $229,900 5 3 99% 19 Oshawa 20 $3,824,801 $191,240 $192,000 15 12 99% 22 Pickering 27 $7,442,100 $275,633 $270,000 30 21 101% 21 Scugog - - - - - - - - Uxbridge 5 $937,000 $187,400 $172,000 5 3 99% 23 Whitby 10 $2,527,900 $252,790 $232,000 12 6 100% 16- - - - - - - - Dufferin County 3 $653,000 $217,667 $218,500 5 6 98% 31 Orangeville 3 $653,000 $217,667 $218,500 5 6 98% 31- - - - - - - - Simcoe County 4 $997,172 $249,293 $253,250 5 7 97% 33 Adjala-Tosorontio - - - - - - - - Bradford West Gwillimbury 1 $260,000 $260,000 $260,000 1 - 98% 19 Essa - - - - - - - - Innisfil - - - - - - - - New Tecumseth 3 $737,172 $245,724 $246,500 4 7 96% 37 ! TURN PAGE FOR CITY OF TORONTO TABLES OR CLICK HERE: SUMMARY OF EXISTING HOME TRANSACTIONS CONDOMINIUM TOWNHOUSES, MAY 2014 11
- 12. Industrial Leasing July 2010Page 3 Toronto Real Estate Board Market Watch, May 2014 12 CITY OF TORONTO MUNICIPAL BREAKDOWN Sales1 Dollar Volume1 Average Price1 Median Price1 New Listings2 Active Listings3 Avg. SP/LP4 Avg. DOM5 TREB Total 812 $306,166,212 $377,052 $361,800 1,252 1,242 99% 19 City of Toronto Total 292 $123,804,552 $423,988 $387,090 447 467 100% 18 Toronto West 76 $28,649,940 $376,973 $371,000 114 125 99% 24 Toronto W01 5 $2,871,100 $574,220 $580,000 14 10 102% 8 Toronto W02 7 $3,378,500 $482,643 $460,000 11 10 100% 14 Toronto W03 4 $1,382,500 $345,625 $378,750 5 6 101% 7 Toronto W04 14 $4,478,600 $319,900 $299,000 15 10 98% 19 Toronto W05 20 $5,533,480 $276,674 $270,500 21 30 98% 44 Toronto W06 3 $1,900,000 $633,333 $515,000 6 12 101% 15 Toronto W07 - - - - 1 1 - - Toronto W08 16 $6,753,000 $422,063 $440,500 25 24 100% 21 Toronto W09 4 $1,643,760 $410,940 $389,880 6 8 100% 18 Toronto W10 3 $709,000 $236,333 $261,000 10 14 95% 17 Toronto Central 98 $53,944,964 $550,459 $485,750 181 193 100% 14 Toronto C01 25 $14,225,000 $569,000 $506,000 43 45 101% 15 Toronto C02 1 $481,500 $481,500 $481,500 5 8 99% 9 Toronto C03 1 $680,000 $680,000 $680,000 3 4 100% 8 Toronto C04 - - - - 2 2 - - Toronto C06 - - - - 1 4 - - Toronto C07 6 $3,003,000 $500,500 $419,000 12 13 102% 12 Toronto C08 2 $722,000 $361,000 $361,000 9 12 98% 24 Toronto C09 2 $1,610,318 $805,159 $805,159 2 1 101% 4 Toronto C10 1 $495,000 $495,000 $495,000 - - 103% 8 Toronto C11 1 $453,000 $453,000 $453,000 1 1 98% 9 Toronto C12 8 $7,592,000 $949,000 $933,000 19 19 98% 17 Toronto C13 2 $1,153,000 $576,500 $576,500 5 3 102% 11 Toronto C14 18 $10,104,900 $561,383 $574,000 45 49 99% 15 Toronto C15 31 $13,425,246 $433,072 $420,000 34 32 102% 15 Toronto East 118 $41,209,648 $349,234 $367,000 152 149 101% 17 Toronto E01 4 $1,844,900 $461,225 $430,000 7 8 100% 11 Toronto E02 6 $3,055,000 $509,167 $555,000 6 4 102% 14 Toronto E03 1 $215,000 $215,000 $215,000 - 1 94% 32 Toronto E04 12 $4,483,700 $373,642 $372,000 16 17 99% 15 Toronto E05 33 $12,153,288 $368,281 $372,000 39 23 102% 12 Toronto E06 - - - - 2 1 - - Toronto E07 14 $5,369,280 $383,520 $373,400 19 14 102% 7 Toronto E08 10 $3,362,100 $336,210 $359,000 15 15 101% 27 Toronto E09 11 $2,736,300 $248,755 $278,000 8 11 97% 31 Toronto E10 6 $1,590,000 $265,000 $256,500 11 23 99% 37 Toronto E11 21 $6,400,080 $304,766 $290,000 29 32 98% 15 SUMMARY OF EXISTING HOME TRANSACTIONS CONDOMINIUM TOWNHOUSES, MAY 2014
- 13. Industrial Leasing July 2010Page 3 Toronto Real Estate Board Market Watch, May 2014 ALL TREB AREAS Sales 1 Dollar Volume 1 Average Price 1 Median Price 1 New Listings 2 Active Listings 3 Avg. SP/LP 4 Avg. DOM 5 TREB Total 2,234 $834,419,508 $373,509 $325,500 4,774 7,266 98% 31- - - - - - - - Halton Region 80 $26,205,255 $327,566 $283,500 105 190 98% 40 Burlington 28 $8,358,100 $298,504 $258,000 33 63 98% 42 Halton Hills 3 $668,000 $222,667 $170,000 3 1 101% 17 Milton 18 $5,282,800 $293,489 $281,450 15 21 98% 37 Oakville 31 $11,896,355 $383,753 $340,000 54 105 97% 44- - - - - - - - Peel Region 337 $92,857,964 $275,543 $260,000 651 1,007 97% 35 Brampton 52 $11,397,201 $219,177 $214,750 56 95 97% 40 Caledon - - - - 4 6 - - Mississauga 285 $81,460,763 $285,827 $265,000 591 906 97% 34- - - - - - - - City of Toronto 1,565 $628,831,090 $401,809 $346,000 3,464 5,133 98% 29 - - - - - - - - York Region 203 $74,841,449 $368,677 $350,000 484 839 98% 34 Aurora 5 $2,093,900 $418,780 $475,000 8 21 97% 66 E. Gwillimbury - - - - - - - - Georgina 1 $248,000 $248,000 $248,000 1 6 99% 61 King 2 $815,000 $407,500 $407,500 3 10 99% 45 Markham 65 $24,282,402 $373,575 $353,500 156 296 98% 33 Newmarket 8 $2,417,800 $302,225 $319,950 9 5 98% 18 Richmond Hill 49 $15,857,897 $323,631 $322,000 138 241 98% 31 Vaughan 71 $28,260,950 $398,042 $375,000 165 252 97% 34 Whitchurch-Stouffville 2 $865,500 $432,750 $432,750 4 8 101% 66- - - - - - - - Durham Region 44 $10,637,250 $241,756 $215,000 61 72 98% 39 Ajax 11 $2,489,100 $226,282 $210,800 13 13 100% 35 Brock - - - - - - - - Clarington 10 $2,064,900 $206,490 $206,250 6 4 99% 17 Oshawa 4 $624,750 $156,188 $154,000 9 16 97% 38 Pickering 11 $3,492,500 $317,500 $347,000 14 16 98% 34 Scugog - - - - 2 4 - - Uxbridge 2 $383,000 $191,500 $191,500 3 3 98% 165 Whitby 6 $1,583,000 $263,833 $285,000 14 16 96% 49- - - - - - - - Dufferin County 2 $372,000 $186,000 $186,000 3 5 97% 46 Orangeville 2 $372,000 $186,000 $186,000 3 5 97% 46- - - - - - - - Simcoe County 3 $674,500 $224,833 $227,000 6 20 97% 62 Adjala-Tosorontio - - - - - - - - Bradford West Gwillimbury 2 $445,000 $222,500 $222,500 3 6 97% 70 Essa - - - - - - - - Innisfil - - - - - - - - New Tecumseth 1 $229,500 $229,500 $229,500 3 14 98% 48 ! TURN PAGE FOR CITY OF TORONTO TABLES OR CLICK HERE: SUMMARY OF EXISTING HOME TRANSACTIONS CONDOMINIUM APARTMENT, MAY 2014 13
- 14. Industrial Leasing July 2010Page 3 Toronto Real Estate Board Market Watch, May 2014 14 CITY OF TORONTO MUNICIPAL BREAKDOWN Sales1 Dollar Volume1 Average Price1 Median Price1 New Listings2 Active Listings3 Avg. SP/LP4 Avg. DOM5 TREB Total 2,234 $834,419,508 $373,509 $325,500 4,774 7,266 98% 31 City of Toronto Total 1,565 $628,831,090 $401,809 $346,000 3,464 5,133 98% 29 Toronto West 306 $97,684,737 $319,231 $305,000 709 1,161 98% 34 Toronto W01 23 $9,117,385 $396,408 $389,900 71 103 99% 29 Toronto W02 23 $7,509,800 $326,513 $336,000 28 38 101% 19 Toronto W03 10 $2,849,400 $284,940 $318,500 12 11 97% 33 Toronto W04 20 $4,361,500 $218,075 $182,000 37 72 96% 32 Toronto W05 28 $6,416,188 $229,150 $216,750 70 109 97% 52 Toronto W06 69 $27,433,330 $397,584 $340,000 206 395 98% 40 Toronto W07 2 $905,000 $452,500 $452,500 3 4 98% 20 Toronto W08 89 $30,926,384 $347,487 $308,000 192 276 98% 33 Toronto W09 17 $3,431,000 $201,824 $193,000 34 57 97% 35 Toronto W10 25 $4,734,750 $189,390 $193,500 56 96 97% 27 Toronto Central 1,006 $463,697,085 $460,931 $385,000 2,337 3,427 98% 27 Toronto C01 395 $173,057,683 $438,121 $383,000 1,009 1,527 98% 29 Toronto C02 46 $44,460,300 $966,528 $625,000 83 183 99% 34 Toronto C03 18 $11,715,800 $650,878 $564,450 32 25 100% 28 Toronto C04 13 $8,924,500 $686,500 $410,000 27 31 99% 30 Toronto C06 18 $6,461,400 $358,967 $304,500 34 56 98% 26 Toronto C07 64 $23,123,767 $361,309 $356,750 144 210 98% 26 Toronto C08 136 $63,383,523 $466,055 $421,800 294 404 99% 24 Toronto C09 12 $11,190,054 $932,505 $885,500 23 30 104% 18 Toronto C10 31 $16,073,258 $518,492 $515,000 71 90 98% 17 Toronto C11 25 $5,622,200 $224,888 $192,000 30 37 98% 21 Toronto C12 10 $8,439,000 $843,900 $595,250 28 37 96% 48 Toronto C13 37 $11,791,254 $318,683 $290,100 49 59 98% 28 Toronto C14 126 $51,434,500 $408,210 $372,000 326 472 98% 27 Toronto C15 75 $28,019,846 $373,598 $328,000 187 266 97% 28 Toronto East 253 $67,449,268 $266,598 $248,000 418 545 98% 27 Toronto E01 20 $9,372,900 $468,645 $447,450 40 47 100% 23 Toronto E02 10 $4,385,300 $438,530 $386,000 20 23 98% 22 Toronto E03 10 $2,444,300 $244,430 $182,000 14 21 95% 36 Toronto E04 28 $5,250,000 $187,500 $174,000 38 60 98% 26 Toronto E05 35 $10,879,900 $310,854 $298,000 49 44 98% 20 Toronto E06 3 $978,500 $326,167 $290,000 3 6 98% 19 Toronto E07 49 $12,089,630 $246,727 $253,000 89 117 98% 33 Toronto E08 24 $5,416,100 $225,671 $175,500 32 34 98% 26 Toronto E09 44 $11,324,788 $257,382 $254,000 95 138 98% 28 Toronto E10 2 $285,000 $142,500 $142,500 3 10 97% 36 Toronto E11 28 $5,022,850 $179,388 $178,000 35 45 98% 25 SUMMARY OF EXISTING HOME TRANSACTIONS CONDOMINIUM APARTMENT, MAY 2014
- 15. Industrial Leasing July 2010Page 3 Toronto Real Estate Board Market Watch, May 2014 ALL TREB AREAS Sales 1 Dollar Volume 1 Average Price 1 Median Price 1 New Listings 2 Active Listings 3 Avg. SP/LP 4 Avg. DOM 5 TREB Total 184 $91,218,088 $495,750 $513,500 241 147 102% 13- - - - - - - - Halton Region 8 $3,682,400 $460,300 $481,700 8 5 99% 7 Burlington 1 $442,000 $442,000 $442,000 - - 98% 4 Halton Hills 1 $284,000 $284,000 $284,000 1 - 100% 11 Milton 1 $448,000 $448,000 $448,000 - 1 98% 11 Oakville 5 $2,508,400 $501,680 $505,000 7 4 99% 6- - - - - - - - Peel Region 24 $11,010,100 $458,754 $484,500 29 18 100% 13 Brampton 10 $3,933,500 $393,350 $394,000 12 9 98% 18 Caledon 1 $437,000 $437,000 $437,000 1 1 100% 9 Mississauga 13 $6,639,600 $510,738 $525,000 16 8 101% 9- - - - - - - - City of Toronto 24 $13,944,600 $581,025 $588,500 27 15 106% 13 - - - - - - - - York Region 72 $44,680,088 $620,557 $622,500 107 63 102% 12 Aurora - - - - 1 1 - - E. Gwillimbury - - - - - - - - Georgina 2 $714,000 $357,000 $357,000 2 1 98% 9 King - - - - 2 1 - - Markham 56 $35,475,088 $633,484 $634,650 79 43 103% 10 Newmarket - - - - 2 2 - - Richmond Hill 10 $6,168,000 $616,800 $615,000 11 7 99% 18 Vaughan 4 $2,323,000 $580,750 $550,000 10 8 98% 18 Whitchurch-Stouffville - - - - - - - -- - - - - - - - Durham Region 44 $14,238,400 $323,600 $322,000 54 33 101% 14 Ajax 2 $730,000 $365,000 $365,000 2 1 96% 21 Brock - - - - - - - - Clarington 22 $6,716,000 $305,273 $303,900 28 16 100% 13 Oshawa 6 $1,596,900 $266,150 $268,450 9 6 99% 26 Pickering 2 $764,000 $382,000 $382,000 6 5 105% 7 Scugog - - - - - - - - Uxbridge 1 $396,500 $396,500 $396,500 1 1 102% 4 Whitby 11 $4,035,000 $366,818 $365,000 8 4 102% 12- - - - - - - - Dufferin County - - - - - - - - Orangeville - - - - - - - -- - - - - - - - Simcoe County 12 $3,662,500 $305,208 $295,500 16 13 98% 18 Adjala-Tosorontio - - - - - - - - Bradford West Gwillimbury 3 $1,116,500 $372,167 $370,000 5 5 99% 14 Essa 7 $1,991,000 $284,429 $291,000 9 7 98% 20 Innisfil 1 $294,000 $294,000 $294,000 - - 98% 17 New Tecumseth 1 $261,000 $261,000 $261,000 2 1 97% 14 SUMMARY OF EXISTING HOME TRANSACTIONS LINK, MAY 2014 ! TURN PAGE FOR CITY OF TORONTO TABLES OR CLICK HERE: 15
- 16. Industrial Leasing July 2010Page 3 Toronto Real Estate Board Market Watch, May 2014 16 CITY OF TORONTO MUNICIPAL BREAKDOWN Sales1 Dollar Volume1 Average Price1 Median Price1 New Listings2 Active Listings3 Avg. SP/LP4 Avg. DOM5 TREB Total 184 $91,218,088 $495,750 $513,500 241 147 102% 13 City of Toronto Total 24 $13,944,600 $581,025 $588,500 27 15 106% 13 Toronto West 1 $475,000 $475,000 $475,000 3 3 99% 53 Toronto W01 - - - - - - - - Toronto W02 - - - - - - - - Toronto W03 - - - - - - - - Toronto W04 - - - - - - - - Toronto W05 - - - - 2 2 - - Toronto W06 - - - - - - - - Toronto W07 - - - - - - - - Toronto W08 - - - - - - - - Toronto W09 1 $475,000 $475,000 $475,000 - - 99% 53 Toronto W10 - - - - 1 1 - - Toronto Central 8 $5,234,000 $654,250 $625,000 10 5 104% 11 Toronto C01 - - - - - - - - Toronto C02 - - - - - - - - Toronto C03 - - - - - - - - Toronto C04 - - - - - - - - Toronto C06 - - - - - - - - Toronto C07 3 $1,875,000 $625,000 $608,000 4 4 102% 16 Toronto C08 - - - - - - - - Toronto C09 - - - - - - - - Toronto C10 - - - - - - - - Toronto C11 - - - - - - - - Toronto C12 - - - - - - - - Toronto C13 - - - - - - - - Toronto C14 - - - - - - - - Toronto C15 5 $3,359,000 $671,800 $630,000 6 1 105% 7 Toronto East 15 $8,235,600 $549,040 $530,000 14 7 108% 11 Toronto E01 - - - - - - - - Toronto E02 - - - - - - - - Toronto E03 - - - - - - - - Toronto E04 - - - - - - - - Toronto E05 5 $3,072,100 $614,420 $590,000 3 1 107% 15 Toronto E06 - - - - - - - - Toronto E07 10 $5,163,500 $516,350 $501,000 8 3 108% 9 Toronto E08 - - - - - - - - Toronto E09 - - - - - - - - Toronto E10 - - - - - - - - Toronto E11 - - - - 3 3 - - SUMMARY OF EXISTING HOME TRANSACTIONS LINK, MAY 2014
- 17. Industrial Leasing July 2010Page 3 Toronto Real Estate Board Market Watch, May 2014 ALL TREB AREAS Sales 1 Dollar Volume 1 Average Price 1 Median Price 1 New Listings 2 Active Listings 3 Avg. SP/LP 4 Avg. DOM 5 TREB Total 911 $436,046,119 $478,646 $444,000 1,250 887 101% 14- - - - - - - - Halton Region 162 $71,338,855 $440,363 $427,750 211 159 99% 14 Burlington 13 $5,646,700 $434,362 $423,000 17 21 99% 23 Halton Hills 14 $5,641,200 $402,943 $405,000 19 10 100% 13 Milton 85 $34,260,565 $403,065 $408,900 118 72 100% 12 Oakville 50 $25,790,390 $515,808 $485,250 57 56 99% 16- - - - - - - - Peel Region 169 $66,889,350 $395,795 $390,000 243 184 99% 16 Brampton 117 $43,680,250 $373,335 $377,400 163 120 99% 16 Caledon 10 $3,983,900 $398,390 $384,950 13 14 98% 16 Mississauga 42 $19,225,200 $457,743 $448,750 67 50 100% 13- - - - - - - - City of Toronto 157 $102,373,208 $652,059 $624,000 225 172 103% 13 - - - - - - - - York Region 275 $146,769,105 $533,706 $528,000 383 257 100% 14 Aurora 18 $8,317,551 $462,086 $460,500 25 12 101% 19 E. Gwillimbury 6 $2,019,500 $336,583 $337,500 3 - 99% 16 Georgina 6 $1,892,900 $315,483 $312,500 8 7 99% 23 King 3 $2,164,900 $721,633 $735,000 5 5 99% 3 Markham 68 $37,581,664 $552,672 $545,500 87 60 101% 13 Newmarket 28 $12,426,800 $443,814 $445,000 22 7 99% 16 Richmond Hill 72 $41,916,888 $582,179 $580,750 103 66 101% 12 Vaughan 61 $34,541,502 $566,254 $557,000 113 94 99% 16 Whitchurch-Stouffville 13 $5,907,400 $454,415 $450,000 17 6 100% 9- - - - - - - - Durham Region 124 $41,704,500 $336,327 $335,000 161 87 101% 12 Ajax 42 $15,245,300 $362,983 $365,000 47 24 100% 12 Brock - - - - 1 1 - - Clarington 17 $4,596,300 $270,371 $269,900 34 15 100% 11 Oshawa 9 $2,586,800 $287,422 $277,000 18 17 100% 8 Pickering 12 $4,644,500 $387,042 $390,100 15 9 104% 14 Scugog - - - - - - - - Uxbridge 1 $455,000 $455,000 $455,000 1 1 101% 3 Whitby 43 $14,176,600 $329,688 $325,900 45 20 100% 12- - - - - - - - Dufferin County 6 $1,752,700 $292,117 $293,650 5 5 99% 21 Orangeville 6 $1,752,700 $292,117 $293,650 5 5 99% 21- - - - - - - - Simcoe County 18 $5,218,401 $289,911 $274,250 22 23 98% 25 Adjala-Tosorontio - - - - - - - - Bradford West Gwillimbury 5 $1,854,500 $370,900 $370,000 10 14 98% 36 Essa 5 $1,216,500 $243,300 $242,000 2 1 99% 21 Innisfil 1 $269,900 $269,900 $269,900 5 5 98% 28 New Tecumseth 7 $1,877,501 $268,214 $275,000 5 3 99% 20 ! TURN PAGE FOR CITY OF TORONTO TABLES OR CLICK HERE: SUMMARY OF EXISTING HOME TRANSACTIONS ATTACHED/ROW/TOWNHOUSE, MAY 2014 17
- 18. Industrial Leasing July 2010Page 3 Toronto Real Estate Board Market Watch, May 2014 18 CITY OF TORONTO MUNICIPAL BREAKDOWN Sales1 Dollar Volume1 Average Price1 Median Price1 New Listings2 Active Listings3 Avg. SP/LP4 Avg. DOM5 TREB Total 911 $436,046,119 $478,646 $444,000 1,250 887 101% 14 City of Toronto Total 157 $102,373,208 $652,059 $624,000 225 172 103% 13 Toronto West 39 $23,326,488 $598,115 $620,000 57 38 102% 14 Toronto W01 1 $486,000 $486,000 $486,000 1 1 108% 7 Toronto W02 10 $6,353,500 $635,350 $630,500 11 5 105% 11 Toronto W03 - - - - 4 4 - - Toronto W04 3 $1,439,900 $479,967 $445,000 3 1 99% 17 Toronto W05 5 $2,167,300 $433,460 $430,000 7 9 99% 23 Toronto W06 11 $6,743,788 $613,072 $625,000 16 9 100% 15 Toronto W07 2 $1,484,000 $742,000 $742,000 4 2 102% 7 Toronto W08 6 $4,314,000 $719,000 $727,000 9 5 100% 9 Toronto W09 - - - - - - - - Toronto W10 1 $338,000 $338,000 $338,000 2 2 100% 24 Toronto Central 54 $43,166,100 $799,372 $777,500 84 75 103% 15 Toronto C01 20 $15,957,100 $797,855 $801,400 32 19 106% 10 Toronto C02 3 $2,373,000 $791,000 $775,000 5 7 98% 10 Toronto C03 - - - - - 3 - - Toronto C04 6 $4,874,000 $812,333 $777,500 3 7 97% 53 Toronto C06 1 $735,000 $735,000 $735,000 - 2 98% 10 Toronto C07 4 $2,804,500 $701,125 $726,000 7 8 98% 12 Toronto C08 10 $7,301,000 $730,100 $717,500 13 6 102% 12 Toronto C09 2 $1,890,000 $945,000 $945,000 1 1 106% 7 Toronto C10 - - - - 1 1 - - Toronto C11 1 $574,000 $574,000 $574,000 4 3 103% 7 Toronto C12 - - - - - - - - Toronto C13 2 $1,476,000 $738,000 $738,000 6 5 106% 7 Toronto C14 5 $5,181,500 $1,036,300 $1,124,500 12 13 106% 10 Toronto C15 - - - - - - - - Toronto East 64 $35,880,620 $560,635 $504,500 84 59 105% 12 Toronto E01 15 $11,111,188 $740,746 $750,000 19 9 110% 7 Toronto E02 9 $6,736,622 $748,514 $623,000 11 7 105% 7 Toronto E03 1 $681,000 $681,000 $681,000 2 2 105% 7 Toronto E04 5 $2,603,110 $520,622 $535,000 14 13 102% 8 Toronto E05 3 $1,554,200 $518,067 $510,000 5 3 111% 11 Toronto E06 2 $817,500 $408,750 $408,750 2 2 105% 43 Toronto E07 5 $2,344,000 $468,800 $460,000 6 1 102% 4 Toronto E08 6 $2,621,000 $436,833 $436,000 5 6 100% 28 Toronto E09 - - - - 2 4 - - Toronto E10 2 $895,000 $447,500 $447,500 2 4 97% 16 Toronto E11 16 $6,517,000 $407,313 $398,600 16 8 100% 12 SUMMARY OF EXISTING HOME TRANSACTIONS ATTACHED/ROW/TOWNHOUSE, MAY 2014
- 19. Industrial Leasing July 2010Page 3 Toronto Real Estate Board Market Watch, May 2014 ALL TREB AREAS Sales 1 Dollar Volume 1 Average Price 1 Median Price 1 New Listings 2 Active Listings 3 Avg. SP/LP 4 Avg. DOM 5 TREB Total 10 $2,357,500 $235,750 $206,500 20 34 93% 41- - - - - - - - Halton Region - - - - - - - - Burlington - - - - - - - - Halton Hills - - - - - - - - Milton - - - - - - - - Oakville - - - - - - - -- - - - - - - - Peel Region 2 $685,500 $342,750 $342,750 - 1 94% 24 Brampton - - - - - - - - Caledon - - - - - - - - Mississauga 2 $685,500 $342,750 $342,750 - 1 94% 24- - - - - - - - City of Toronto 8 $1,672,000 $209,000 $200,000 19 32 93% 46 - - - - - - - - York Region - - - - 1 1 - - Aurora - - - - - - - - E. Gwillimbury - - - - - - - - Georgina - - - - - - - - King - - - - - - - - Markham - - - - - - - - Newmarket - - - - - - - - Richmond Hill - - - - 1 1 - - Vaughan - - - - - - - - Whitchurch-Stouffville - - - - - - - -- - - - - - - - Durham Region - - - - - - - - Ajax - - - - - - - - Brock - - - - - - - - Clarington - - - - - - - - Oshawa - - - - - - - - Pickering - - - - - - - - Scugog - - - - - - - - Uxbridge - - - - - - - - Whitby - - - - - - - -- - - - - - - - Dufferin County - - - - - - - - Orangeville - - - - - - - -- - - - - - - - Simcoe County - - - - - - - - Adjala-Tosorontio - - - - - - - - Bradford West Gwillimbury - - - - - - - - Essa - - - - - - - - Innisfil - - - - - - - - New Tecumseth - - - - - - - - SUMMARY OF EXISTING HOME TRANSACTIONS CO-OP APARTMENT, MAY 2014 ! TURN PAGE FOR CITY OF TORONTO TABLES OR CLICK HERE: 19
- 20. Industrial Leasing July 2010Page 3 Toronto Real Estate Board Market Watch, May 2014 20 CITY OF TORONTO MUNICIPAL BREAKDOWN Sales1 Dollar Volume1 Average Price1 Median Price1 New Listings2 Active Listings3 Avg. SP/LP4 Avg. DOM5 TREB Total 10 $2,357,500 $235,750 $206,500 20 34 93% 41 City of Toronto Total 8 $1,672,000 $209,000 $200,000 19 32 93% 46 Toronto West 3 $500,000 $166,667 $195,000 7 11 94% 35 Toronto W01 - - - - - - - - Toronto W02 2 $400,000 $200,000 $200,000 1 1 97% 34 Toronto W03 - - - - - - - - Toronto W04 - - - - - - - - Toronto W05 1 $100,000 $100,000 $100,000 2 3 83% 36 Toronto W06 - - - - 1 3 - - Toronto W07 - - - - - - - - Toronto W08 - - - - 3 3 - - Toronto W09 - - - - - 1 - - Toronto W10 - - - - - - - - Toronto Central 3 $963,000 $321,000 $230,000 12 20 92% 52 Toronto C01 - - - - 4 4 - - Toronto C02 - - - - - - - - Toronto C03 - - - - - 3 - - Toronto C04 - - - - - 1 - - Toronto C06 - - - - - - - - Toronto C07 - - - - - - - - Toronto C08 1 $230,000 $230,000 $230,000 2 1 85% 72 Toronto C09 2 $733,000 $366,500 $366,500 6 10 94% 42 Toronto C10 - - - - - - - - Toronto C11 - - - - - - - - Toronto C12 - - - - - - - - Toronto C13 - - - - - - - - Toronto C14 - - - - - 1 - - Toronto C15 - - - - - - - - Toronto East 2 $209,000 $104,500 $104,500 - 1 95% 54 Toronto E01 - - - - - - - - Toronto E02 - - - - - - - - Toronto E03 - - - - - - - - Toronto E04 - - - - - 1 - - Toronto E05 - - - - - - - - Toronto E06 - - - - - - - - Toronto E07 - - - - - - - - Toronto E08 - - - - - - - - Toronto E09 - - - - - - - - Toronto E10 2 $209,000 $104,500 $104,500 - - 95% 54 Toronto E11 - - - - - - - - SUMMARY OF EXISTING HOME TRANSACTIONS CO-OP APARTMENT, MAY 2014
- 21. Industrial Leasing July 2010Page 3 Toronto Real Estate Board Market Watch, May 2014 ALL TREB AREAS Sales 1 Dollar Volume 1 Average Price 1 Median Price 1 New Listings 2 Active Listings 3 Avg. SP/LP 4 Avg. DOM 5 TREB Total 10 $3,735,500 $373,550 $356,000 16 38 96% 72- - - - - - - - Halton Region - - - - 4 1 - - Burlington - - - - 3 1 - - Halton Hills - - - - - - - - Milton - - - - - - - - Oakville - - - - 1 - - -- - - - - - - - Peel Region 2 $887,500 $443,750 $443,750 6 13 95% 49 Brampton 2 $887,500 $443,750 $443,750 4 8 95% 49 Caledon - - - - 1 2 - - Mississauga - - - - 1 3 - -- - - - - - - - City of Toronto - - - - - - - - - - - - - - - - York Region - - - - - - - - Aurora - - - - - - - - E. Gwillimbury - - - - - - - - Georgina - - - - - - - - King - - - - - - - - Markham - - - - - - - - Newmarket - - - - - - - - Richmond Hill - - - - - - - - Vaughan - - - - - - - - Whitchurch-Stouffville - - - - - - - -- - - - - - - - Durham Region - - - - - - - - Ajax - - - - - - - - Brock - - - - - - - - Clarington - - - - - - - - Oshawa - - - - - - - - Pickering - - - - - - - - Scugog - - - - - - - - Uxbridge - - - - - - - - Whitby - - - - - - - -- - - - - - - - Dufferin County - - - - - - - - Orangeville - - - - - - - -- - - - - - - - Simcoe County 8 $2,848,000 $356,000 $345,000 6 24 97% 78 Adjala-Tosorontio - - - - - - - - Bradford West Gwillimbury - - - - - - - - Essa - - - - - - - - Innisfil - - - - - - - - New Tecumseth 8 $2,848,000 $356,000 $345,000 6 24 97% 78 ! TURN PAGE FOR CITY OF TORONTO TABLES OR CLICK HERE: SUMMARY OF EXISTING HOME TRANSACTIONS DETACHED CONDOMINIUM, MAY 2014 21
- 22. Industrial Leasing July 2010Page 3 Toronto Real Estate Board Market Watch, May 2014 22 CITY OF TORONTO MUNICIPAL BREAKDOWN Sales1 Dollar Volume1 Average Price1 Median Price1 New Listings2 Active Listings3 Avg. SP/LP4 Avg. DOM5 TREB Total 10 $3,735,500 $373,550 $356,000 16 38 96% 72 City of Toronto Total - - - - - - - - Toronto West - - - - - - - - Toronto W01 - - - - - - - - Toronto W02 - - - - - - - - Toronto W03 - - - - - - - - Toronto W04 - - - - - - - - Toronto W05 - - - - - - - - Toronto W06 - - - - - - - - Toronto W07 - - - - - - - - Toronto W08 - - - - - - - - Toronto W09 - - - - - - - - Toronto W10 - - - - - - - - Toronto Central - - - - - - - - Toronto C01 - - - - - - - - Toronto C02 - - - - - - - - Toronto C03 - - - - - - - - Toronto C04 - - - - - - - - Toronto C06 - - - - - - - - Toronto C07 - - - - - - - - Toronto C08 - - - - - - - - Toronto C09 - - - - - - - - Toronto C10 - - - - - - - - Toronto C11 - - - - - - - - Toronto C12 - - - - - - - - Toronto C13 - - - - - - - - Toronto C14 - - - - - - - - Toronto C15 - - - - - - - - Toronto East - - - - - - - - Toronto E01 - - - - - - - - Toronto E02 - - - - - - - - Toronto E03 - - - - - - - - Toronto E04 - - - - - - - - Toronto E05 - - - - - - - - Toronto E06 - - - - - - - - Toronto E07 - - - - - - - - Toronto E08 - - - - - - - - Toronto E09 - - - - - - - - Toronto E10 - - - - - - - - Toronto E11 - - - - - - - - SUMMARY OF EXISTING HOME TRANSACTIONS DETACHED CONDOMINIUM, MAY 2014
- 23. Industrial Leasing July 2010Page 3 Toronto Real Estate Board Market Watch, May 2014 23 ALL TREB AREAS Sales 1 Dollar Volume 1 Average Price 1 Median Price 1 New Listings 2 Active Listings 3 Avg. SP/LP 4 Avg. DOM 5 TREB Total 2 $514,000 $257,000 $257,000 13 23 99% 14- - - - - - - - Halton Region - - - - - - - - Burlington - - - - - - - - Halton Hills - - - - - - - - Milton - - - - - - - - Oakville - - - - - - - -- - - - - - - - Peel Region - - - - - - - - Brampton - - - - - - - - Caledon - - - - - - - - Mississauga - - - - - - - -- - - - - - - - City of Toronto 2 $514,000 $257,000 $257,000 13 23 99% 14 - - - - - - - - York Region - - - - - - - - Aurora - - - - - - - - E. Gwillimbury - - - - - - - - Georgina - - - - - - - - King - - - - - - - - Markham - - - - - - - - Newmarket - - - - - - - - Richmond Hill - - - - - - - - Vaughan - - - - - - - - Whitchurch-Stouffville - - - - - - - -- - - - - - - - Durham Region - - - - - - - - Ajax - - - - - - - - Brock - - - - - - - - Clarington - - - - - - - - Oshawa - - - - - - - - Pickering - - - - - - - - Scugog - - - - - - - - Uxbridge - - - - - - - - Whitby - - - - - - - -- - - - - - - - Dufferin County - - - - - - - - Orangeville - - - - - - - -- - - - - - - - Simcoe County - - - - - - - - Adjala-Tosorontio - - - - - - - - Bradford West Gwillimbury - - - - - - - - Essa - - - - - - - - Innisfil - - - - - - - - New Tecumseth - - - - - - - - ! TURN PAGE FOR CITY OF TORONTO TABLES OR CLICK HERE: SUMMARY OF EXISTING HOME TRANSACTIONS CO-OWNERSHIP APARTMENT, MAY 2014
- 24. Industrial Leasing July 2010Page 3 Toronto Real Estate Board Market Watch, May 2014 24 CITY OF TORONTO MUNICIPAL BREAKDOWN Sales1 Dollar Volume1 Average Price1 Median Price1 New Listings2 Active Listings3 Avg. SP/LP4 Avg. DOM5 TREB Total 2 $514,000 $257,000 $257,000 13 23 99% 14 City of Toronto Total 2 $514,000 $257,000 $257,000 13 23 99% 14 Toronto West 1 $189,000 $189,000 $189,000 6 10 100% 13 Toronto W01 - - - - - - - - Toronto W02 - - - - - - - - Toronto W03 - - - - - - - - Toronto W04 - - - - - - - - Toronto W05 - - - - 6 10 - - Toronto W06 - - - - - - - - Toronto W07 1 $189,000 $189,000 $189,000 - - 100% 13 Toronto W08 - - - - - - - - Toronto W09 - - - - - - - - Toronto W10 - - - - - - - - Toronto Central 1 $325,000 $325,000 $325,000 6 12 98% 15 Toronto C01 - - - - - - - - Toronto C02 - - - - 2 4 - - Toronto C03 1 $325,000 $325,000 $325,000 1 2 98% 15 Toronto C04 - - - - 2 3 - - Toronto C06 - - - - - - - - Toronto C07 - - - - - - - - Toronto C08 - - - - - - - - Toronto C09 - - - - - - - - Toronto C10 - - - - - - - - Toronto C11 - - - - - - - - Toronto C12 - - - - - - - - Toronto C13 - - - - - 1 - - Toronto C14 - - - - 1 2 - - Toronto C15 - - - - - - - - Toronto East - - - - 1 1 - - Toronto E01 - - - - - - - - Toronto E02 - - - - 1 1 - - Toronto E03 - - - - - - - - Toronto E04 - - - - - - - - Toronto E05 - - - - - - - - Toronto E06 - - - - - - - - Toronto E07 - - - - - - - - Toronto E08 - - - - - - - - Toronto E09 - - - - - - - - Toronto E10 - - - - - - - - Toronto E11 - - - - - - - - SUMMARY OF EXISTING HOME TRANSACTIONS CO-OWNERSHIP APARTMENT, MAY 2014
- 25. Industrial Leasing July 2010Page 3 Toronto Real Estate Board Market Watch, May 2014 25 FOCUS ON THE MLS® HOME PRICE INDEX INDEX AND BENCHMARK PRICE, MAY 2014 ALL TREB AREAS Index Benchmark Yr./Yr. % Chg. Index Benchmark Yr./Yr. % Chg. Index Benchmark Yr./Yr. % Chg. Index Benchmark Yr./Yr. % Chg. Index Benchmark Yr./Yr. % Chg. TREB Total 166.3 $507,300 7.08% 167.5 $622,800 7.72% 172.8 $488,200 7.66% 162.0 $354,800 6.79% 155.2 $311,700 3.81% Halton Region 175.9 $577,000 7.39% 173.0 $641,500 6.59% 176.2 $457,300 7.64% 167.5 $331,600 6.48% - - - Burlington 182.8 $526,800 6.53% 180.6 $617,300 5.18% 179.3 $427,400 8.14% 177.3 $356,000 6.49% - - - Halton Hills 160.0 $465,900 4.37% 159.8 $511,200 4.31% 170.4 $419,700 6.50% 156.8 $282,700 3.29% - - - Milton 166.9 $468,100 7.61% 155.1 $540,300 5.51% 169.5 $423,200 7.35% - - - - - - Oakville 184.8 $681,800 7.57% 183.8 $761,800 7.23% 186.3 $504,300 7.69% 168.2 $371,500 7.54% - - - Peel Region 158.7 $434,100 5.52% 159.8 $540,900 5.69% 161.2 $411,300 5.64% 164.4 $340,200 5.66% 142.3 $244,900 3.04% Brampton 151.5 $386,500 5.28% 151.7 $443,400 4.77% 152.9 $360,200 5.01% 149.2 $277,200 6.19% 127.1 $198,900 3.42% Caledon 148.8 $530,200 3.19% 149.8 $549,900 3.45% 160.7 $397,300 3.28% - - - - - - Mississauga 165.1 $461,500 5.97% 171.4 $638,600 7.13% 170.9 $467,100 6.61% 169.3 $363,600 5.61% 145.1 $254,100 3.13% City of Toronto 170.4 $558,500 7.04% 177.3 $768,600 9.51% 183.7 $609,200 8.31% 166.5 $402,700 7.84% 158.2 $326,700 3.67% York Region 176.7 $606,400 8.60% 176.9 $695,000 7.73% 180.8 $523,800 9.05% 162.3 $413,700 6.92% 155.9 $338,700 5.55% Aurora 168.9 $543,900 9.04% 168.0 $624,100 9.38% 173.6 $449,300 9.80% 143.4 $363,200 0.21% 149.3 $310,200 4.41% E. Gwillimbury 156.7 $506,600 7.70% 157.2 $516,400 7.16% 165.8 $351,000 9.73% - - - - - - Georgina 154.5 $320,700 2.59% 159.9 $329,400 3.50% 166.2 $327,500 8.91% - - - - - - King 163.8 $694,400 7.13% 165.3 $697,500 7.27% - - - - - - - - - Markham 182.2 $627,600 9.43% 185.4 $762,400 8.80% 185.7 $553,000 10.21% 167.6 $416,400 8.62% 159.9 $369,800 5.41% Newmarket 161.2 $475,400 9.14% 159.2 $535,900 9.72% 166.6 $392,600 8.60% 162.1 $327,300 1.25% 150.1 $252,800 2.46% Richmond Hill 185.8 $672,700 8.46% 195.8 $829,500 8.48% 191.4 $579,800 7.95% 154.1 $435,700 6.79% 152.4 $317,400 5.18% Vaughan 175.5 $634,400 8.53% 168.0 $699,100 5.66% 180.1 $548,300 8.89% 171.0 $467,200 11.69% 154.9 $343,700 6.17% Whitchurch-Stouffville 171.0 $644,700 6.41% 171.1 $656,600 6.54% 153.2 $420,800 5.44% - - - - - - Durham Region 147.3 $346,600 7.91% 146.2 $381,200 7.34% 153.0 $306,400 8.43% 137.2 $225,500 7.78% 139.3 $249,200 10.21% Ajax 153.3 $378,800 7.73% 152.8 $409,200 6.18% 160.1 $344,300 7.52% 140.5 $256,800 8.33% 135.2 $229,600 10.19% Brock 131.0 $248,300 5.05% 131.6 $250,100 5.20% 145.2 $231,400 12.04% - - - - - - Clarington 144.9 $306,600 9.86% 139.2 $334,500 7.49% 148.5 $283,500 10.24% 158.2 $283,200 8.88% 139.6 $197,600 12.13% Oshawa 142.5 $272,700 7.71% 141.6 $301,500 7.76% 147.8 $247,500 8.04% 122.8 $164,300 8.29% 138.9 $166,200 6.93% Pickering 154.9 $419,000 10.01% 157.4 $492,400 11.00% 159.5 $371,800 9.77% 146.3 $263,900 7.57% 143.7 $281,400 12.27% Scugog 143.9 $373,400 2.64% 148.0 $381,100 2.71% 140.0 $293,000 15.61% - - - - - - Uxbridge 143.3 $438,200 8.56% 143.6 $444,800 8.05% 140.5 $344,800 8.66% - - - - - - Whitby 145.8 $380,400 6.27% 146.0 $419,400 6.34% 151.1 $333,300 7.62% 137.8 $252,600 5.67% 136.1 $265,500 6.41% Dufferin County 152.2 $348,800 5.69% 156.8 $357,300 6.16% 149.8 $280,800 3.10% - - - - - - Orangeville 152.2 $348,800 5.69% 156.8 $357,300 6.16% 149.8 $280,800 3.10% - - - - - - Simcoe County 148.4 $315,400 5.40% 144.2 $318,000 4.80% 155.2 $298,000 6.52% - - - - - - Adjala-Tosorontio 137.6 $433,400 8.35% 137.4 $433,200 8.19% - - - - - - - - - Bradford West Gwillimbury 165.5 $411,300 8.38% 150.4 $460,700 8.91% 170.3 $354,100 7.72% - - - - - - Essa 146.3 $331,800 4.35% 143.9 $355,900 4.96% 148.0 $252,100 3.14% - - - - - - Innisfil 145.4 $269,400 3.34% 145.8 $270,600 2.82% 156.8 $243,900 10.19% - - - - - - New Tecumseth 136.8 $316,000 4.83% 133.6 $344,100 4.70% 143.0 $273,500 5.22% - - - - - - Townhouse Apartment ! TURN PAGE FOR CITY OF TORONTO TABLES OR CLICK HERE: Composite Single-Family Detached Single-Family Attached CLICK HERE FOR MORE BACKGROUND INFORMATION ON THE MLS® HPI
- 26. Industrial Leasing July 2010Page 3 Toronto Real Estate Board Market Watch, May 2014 26 FOCUS ON THE MLS® HOME PRICE INDEX INDEX AND BENCHMARK PRICE, MAY 2014 CITY OF TORONTO Index Benchmark Yr./Yr. % Chg. Index Benchmark Yr./Yr. % Chg. Index Benchmark Yr./Yr. % Chg. Index Benchmark Yr./Yr. % Chg. Index Benchmark Yr./Yr. % Chg. TREB Total 166.3 $507,300 7.08% 167.5 $622,800 7.72% 172.8 $488,200 7.66% 162.0 $354,800 6.79% 155.2 $311,700 3.81% City of Toronto 170.4 $558,500 7.04% 177.3 $768,600 9.51% 183.7 $609,200 8.31% 166.5 $402,700 7.84% 158.2 $326,700 3.67% Toronto W01 164.4 $670,900 0.31% 167.4 $862,800 3.65% 175.6 $677,500 2.03% 214.2 $441,100 0.09% 140.8 $328,500 -2.76% Toronto W02 191.8 $691,800 4.92% 195.7 $803,300 8.00% 218.6 $669,600 6.53% 148.0 $408,100 6.02% 132.1 $549,100 7.40% Toronto W03 176.7 $456,400 9.34% 180.4 $490,600 10.34% 182.2 $466,800 7.56% - - - 134.8 $250,000 9.42% Toronto W04 154.4 $404,300 7.67% 164.2 $518,200 9.47% 160.2 $466,500 8.83% 140.9 $342,800 -1.74% 131.6 $193,900 3.87% Toronto W05 147.2 $350,500 5.37% 162.2 $540,700 8.79% 150.1 $439,000 7.37% 141.9 $233,600 14.71% 122.6 $161,000 -7.89% Toronto W06 152.5 $442,700 2.42% 185.3 $588,100 9.71% 152.5 $462,400 1.40% 158.2 $466,100 1.15% 125.0 $309,200 -4.58% Toronto W07 168.7 $719,000 11.06% 176.2 $761,500 10.47% 161.0 $660,200 6.48% 138.1 $507,600 12.28% 114.0 $462,300 11.22% Toronto W08 148.5 $604,200 6.38% 162.2 $848,400 7.06% 165.0 $619,800 5.30% 144.1 $352,300 4.57% 133.2 $268,100 6.47% Toronto W09 155.1 $398,600 9.00% 170.2 $636,800 7.45% 154.7 $437,900 7.88% 141.0 $357,700 -3.62% 131.2 $168,200 14.29% Toronto W10 146.4 $339,800 6.78% 158.6 $466,700 7.31% 154.9 $420,900 5.30% 128.8 $232,000 10.18% 128.1 $195,600 2.81% Toronto C01 187.4 $464,800 3.65% 202.9 $716,200 5.35% 210.6 $730,700 6.90% 174.7 $524,300 3.19% 183.6 $382,100 2.91% Toronto C02 183.1 $869,400 6.33% 166.9 $1,322,900 5.90% 186.6 $981,900 4.83% 178.0 $832,400 3.85% 184.6 $514,800 7.89% Toronto C03 183.8 $946,000 7.67% 181.1 $1,091,400 8.57% 185.9 $688,200 4.32% - - - 184.7 $487,900 6.82% Toronto C04 169.1 $1,047,700 7.23% 175.1 $1,224,000 8.29% 173.7 $830,400 8.02% 157.9 $589,900 5.69% 142.3 $338,300 1.72% Toronto C06 180.6 $714,700 8.21% 184.7 $790,600 8.01% 158.4 $582,500 1.41% 156.7 $427,600 14.71% 177.9 $393,400 9.75% Toronto C07 168.4 $578,400 7.06% 193.6 $886,300 10.63% 164.8 $585,700 4.57% 146.8 $430,900 12.92% 150.5 $354,500 2.10% Toronto C08 173.6 $447,000 4.26% 155.6 $483,600 -7.05% 184.1 $762,000 7.41% 186.5 $565,600 4.36% 172.5 $380,500 4.17% Toronto C09 135.8 $1,008,500 4.30% 124.4 $1,562,700 1.14% 145.1 $1,180,700 1.97% 171.1 $883,200 6.60% 143.7 $476,100 7.72% Toronto C10 191.0 $745,100 7.06% 179.3 $1,100,300 7.69% 182.8 $902,800 4.16% 222.8 $510,900 1.32% 196.5 $470,800 9.35% Toronto C11 161.0 $576,900 11.88% 165.3 $1,106,700 7.83% 189.8 $832,800 9.58% 115.2 $183,700 5.30% 156.8 $223,200 17.28% Toronto C12 157.1 $1,346,400 5.01% 150.2 $1,614,200 4.31% 176.0 $760,500 6.09% 164.2 $556,200 15.39% 175.4 $551,700 3.06% Toronto C13 162.9 $601,000 8.17% 176.8 $947,300 10.57% 163.3 $523,900 8.79% 157.9 $449,600 13.27% 147.1 $291,000 3.52% Toronto C14 175.6 $596,700 3.05% 200.2 $1,086,200 9.94% 187.1 $912,800 5.89% 241.4 $815,700 14.03% 161.5 $406,100 -0.98% Toronto C15 168.8 $564,300 8.83% 191.9 $899,500 9.22% 176.9 $577,300 8.53% 181.8 $447,900 10.92% 140.8 $329,100 7.40% Toronto E01 205.2 $637,300 11.10% 204.0 $687,300 12.03% 212.9 $668,000 13.30% 217.8 $440,400 3.52% 183.0 $434,100 1.10% Toronto E02 189.5 $704,900 12.20% 176.3 $776,400 9.44% 198.9 $663,400 12.95% 173.4 $579,700 3.34% 179.6 $475,300 8.91% Toronto E03 173.7 $535,100 10.85% 176.9 $594,300 11.96% 174.2 $567,300 9.15% - - - 137.7 $206,000 6.58% Toronto E04 175.1 $439,600 12.68% 182.8 $539,800 13.47% 176.6 $428,500 11.77% 168.6 $364,400 8.22% 171.3 $259,500 13.07% Toronto E05 165.7 $443,100 11.28% 188.1 $664,200 14.14% 185.6 $511,600 14.71% 165.1 $358,900 10.43% 140.4 $275,800 6.69% Toronto E06 186.2 $526,200 9.92% 186.8 $533,900 9.62% 192.7 $455,800 8.87% - - - 164.1 $361,800 8.53% Toronto E07 177.4 $437,300 11.92% 194.7 $637,200 15.55% 188.6 $493,000 15.85% 178.6 $386,200 11.28% 154.0 $263,700 6.94% Toronto E08 163.3 $400,200 9.52% 177.6 $554,400 10.11% 164.1 $420,000 7.40% 163.4 $330,800 9.22% 133.9 $213,800 9.13% Toronto E09 159.6 $385,400 8.72% 175.0 $498,000 12.40% 165.0 $404,900 11.49% 152.3 $280,700 10.44% 142.2 $266,700 2.97% Toronto E10 167.2 $473,400 9.93% 169.5 $542,600 9.71% 165.7 $431,000 6.49% 167.9 $294,100 11.49% 126.4 $203,700 18.46% Toronto E11 158.0 $348,300 10.96% 176.2 $489,300 9.24% 169.8 $385,300 10.62% 127.2 $250,000 13.17% 132.8 $198,200 18.36% ApartmentComposite Single-Family Detached Single-Family Attached Townhouse CLICK HERE FOR MORE BACKGROUND INFORMATION ON THE MLS® HPI
- 27. July 2010Page 3 Toronto Real Estate Board Market Watch, May 2014 27 YEAR SALES AVERAGE PRICE 2003 78,898 $293,067 2004 83,501 $315,231 2005 84,145 $335,907 2006 83,084 $351,941 2007 93,193 $376,236 2008 74,552 $379,347 2009 87,308 $395,460 2010 85,545 $431,276 2011 89,096 $465,014 2012 85,496 $497,130 2013 87,059 $523,007 January 4,229 $482,080 February 5,613 $509,396 March 7,537 $517,232 April 9,535 $524,868 May 9,946 $540,544 June 8,821 $529,614 July 8,367 $512,286 August 7,391 $501,677 September 7,258 $532,631 October 7,947 $539,431 November 6,356 $538,845 December 4,059 $520,260 Annual 87,059 $523,007 January 4,103 $526,965 February 5,698 $552,792 March 8,062 $557,889 April 9,683 $578,118 May 11,079 $585,204 June - - July - - August - - September - - October - - November - - December - - Year-to-Date 38,625 $566,758 HISTORIC ANNUAL STATISTICS1,6,7 2014 MONTHLY STATISTICS1,7 2013 MONTHLY STATISTICS1,7 *For historic annual sales and average price data over a longer time frame go to: http://www.torontorealestateboard.com/market_news/market_watch/histori c_stats/pdf/TREB_historic_statistics.pdf NOTES 8 SNLR = Sales-to-New Listings Ratio. Calculated using a 12-month moving average (sales/new listings). 9 Mos. Inv. = Months of Inventory. Calculated using a 12-month moving average (active listings/sales). 7 Past monthly and year-to-date figures are revised on a monthly basis. 1 Sales, dollar volume, average sale prices and median sale prices are based on firm transactions entered into the TorontoMLS® system between the first and last day of the month/period being reported. 2 New listings entered into the TorontoMLS® system between the first and last day of the month/period being reported. 3 Active listings at the end of the last day of the month/period being reported. 4 Ratio of the average selling price to the average listing price for firm transactions entered into the TorontoMLS® system between the first and last day of the month/period being reported. 5 Average number of days on the market for firm transactions entered into the TorontoMLS® system between the first and last day of the month/period being reported. 6 Due to past changes to TREB's service area, caution should be exercised when making historical comparisons. Copyright® 2014 Toronto Real Estate Board