SlideShare una empresa de Scribd logo
1 de 4
Descargar para leer sin conexión
Cooper Inds Plc (CBE)                                                                             Price: $45.54

 Industry: Electronics
 Chaikin Power Gauge Report | Generated: Thu Sep 22 16:08 EDT 2011

   CBE
   Cooper Inds Plc                    $45.54          Power Gauge Rating

                                                      CBE - Very Bearish
                                                                                                         TM
                                                      The Chaikin Power Gauge Rating for CBE is very bearish due to very poor
                                                      financial metrics and negative expert opinions. The rating also reflects bullish
                                                      price/volume activity.
   Financial Metrics

                                                      CBE's financial metrics are very poor due to a high price to sales ratio and
   Earnings Performance                               relatively low cash flow.

   Price/Volume Activity


   Expert Opinions


                                                      News Sentiment Rating
                                                      Neutral
   CBE Cooper Inds P..       September 21, 2011                                              TM
                                                      Chaikin Sentiment Gauge for CBE is neutral. Stories concerning CBE have a
                                                      balanced or neutral sentiment.
   News Sentiment :Neutral


     Power Trend - 5 Year Chart


     The Power Gauge distills a 20 factor model into a concise picture of a stock's potential.                 High Potential     Neutral       Low Potential


I want to receive special offers about trading stocks with your brokerage partner, optionsXpress. Click here                    www.chaikinpowertools.com
Financials & Earnings


    Financial Metrics
                                                              Financial Metrics Rating

    LT Debt/Equity Ratio
                                                              Very Bearish

    Price to Book Value                                       CBE's financial metrics are very poor. The company has relatively low revenue
                                                              per share and generates relatively low free cash flow relative to market
    Return on Equity
                                                              capitalization.
                                                              The rank is based on a high long term debt to equity ratio, high return on equity,
    Price to Sales Ratio                                      high price to sales ratio and relatively low cash flow.

    Business Value


    Assets and Liabilities                                                   Valuation                                                   Returns


    Ratio                                                TTM                 Ratio                                      TTM              Ratio                                         TTM

    Current Ratio                                        2.59                Price/Book                                  2.03            Return on Invest                             12.6%

    LT Debt/Equity                                       0.44                Price/Sales                                 1.48            Return on Equity                             17.4%


    Earnings Performance
                                                              Earnings Performance Rating

    Earnings Growth
                                                              Neutral

    Earnings Surprise                                         CBE's earnings performance has been neutral. The company has a stable 5 year
                                                              earnings trend and has a history of weak earnings growth.
    Earnings Trend                                            The rank is based on poor EPS growth over the past 3-5 years, worse than
                                                              expected earnings in recent quarters, an upward trend in earnings this year, a
    Projected P/E Ratio                                       relatively high projected P/E ratio and consistent earnings over the past 5 years.

    Earnings Consistency


   5 Year Revenue and Earnings Growth                                                                   EPS Estimates


                             12/06          12/07              12/08            12/09           12/10   Factor                       Actual EPS Prev        EST EPS Current          Change

   Revenue(M)              5,184.60       5,903.10       6,521.30           5,069.60         5,065.90   Quarterly EPS                            $0.86                 $0.96          +0.10

   Rev % Growth              9.60%         13.86%         10.47%             -22.26%           -0.07%   Yearly EPS                               $2.67                 $3.80          +1.13

   EPS                       $2.52          $3.80              $3.64            $2.63           $2.67   Factor                  Actual EPS Growth            Est EPS Growth          Change

   EPS % Growth             19.39%         50.50%             -4.21%         -27.75%           1.52%    3-5 year EPS                          2.32%                   13.67%         +11.35


    EPS Surprise                                                                                        EPS Quarterly Results


                               Estimate              Actual            Difference       % Difference    FY                   Qtr 1           Qtr 2            Qtr 3        Qtr 4       Total

    Latest Qtr                    $0.95              $0.96                 $0.01               1.05     12/09               $0.60            $0.53           $0.72         $0.77      $2.62

    1 Qtr Ago                     $0.84              $0.84                 $0.00               0.00     12/10               $0.71            $0.25           $0.86         $0.87      $2.69

    2 Qtr Ago                     $0.85              $0.85                 $0.00               0.00     12/11               $2.10            $0.98                -            -           -

    3 Qtr Ago                     $0.84              $0.85                 $0.01               1.19     Fiscal Year End Month is December.


 I want to receive special offers about trading stocks with your brokerage partner, optionsXpress. Click here                                            www.chaikinpowertools.com
Price Trend & Expert Opinions

    Price/Volume Activity
                                                     Price/Volume Activity Rating

    Relative Strength vs Market                      Bullish

    Chaikin Money Flow
                                                     Price and volume activity for CBE is bullish. CBE is trading on higher volume than
                                                     its 90 day average volume and is in an accelerating price trend compared to 4
    Price Trend                                      months ago.

    Price Trend ROC
                                                     The rank for CBE is based on its relative weakness versus the market, negative
                                                     Chaikin money flow, a negative Chaikin price trend, a positive Chaikin price trend
                                                     ROC and an increasing volume trend.
    Volume Trend


   Relative Strength vs S&P500 Index                                                          Chaikin Money Flow


   Chart shows whether CBE is performing better or worse than the market.                      Chaikin Money Flow analyzes supply and demand for a company's stock.


    Price Activity                                               Price Activity                                           Volume Activity

    Factor                                         Value        Factor                                          Value    Factor                                         Value

    52 Week High                                   69.76        % Change Price - 4 Weeks                        2.34%    Average Volume 20 Days                     1,685,504

    52 Week Low                                    41.72        % Change Price - 24 Weeks                   -33.00%      Average Volume 90 Days                     1,669,142

    % Change YTD Rel S&P 500                     -15.45%        % Change Price - 4 Wks Rel to S&P               3.29%    Chaikin Money Flow Persistency                  32%

                                                                % Change Price - 24 Wks Rel to S&P          -23.30%


    Expert Opinions
                                                     Expert Opinions

    Earnings Estimate Revisions                      Bearish
    Short Interest                                   Expert opinions about CBE are negative. Analysts are lowering their EPS
                                                     estimates for CBE and analysts's opinions on CBE have been more negative
    Insider Activity                                 recently.
                                                     The rank for CBE is based on analysts revising earnings estimates downward, a
    Analyst Opinions
                                                     low short interest ratio and pessimistic analyst opinions.

    Relative Strength vs Industry


    Earnings Estimate Revisions                                  Analyst Recommendations                                  EPS Estimates Revision Summary

                       Current      7 Days Ago % Change         Factor                                          Value                             Last Week    Last 4 Weeks

   Current Qtr           0.96             1.03    -6.80%        Mean this Week                            Strong Buy                           Up     Down         Up   Down

   Next Qtr              0.96             1.01    -4.95%        Mean Last Week                            Strong Buy     Curr Qtr                 0       10        0      10

                                                                                                                         Curr Yr                  0       8         0       8
                       Current      30 Days Ago % Change        Change                                           0.00
                                                                                                                         Next Qtr                 0       10        0      10
   Current FY            3.80             3.91     -0.11        Mean 5 Weeks Ago                          Strong Buy
                                                                                                                         Next Yr                  0       9         0      10


 I want to receive special offers about trading stocks with your brokerage partner, optionsXpress. Click here                          www.chaikinpowertools.com
The Company & Its Competitors


   CBE's Competitors in Electronics                                                                                News Headlines for CBE

   Company     Power   Historic EPS   Projected EPS    Profit Margin       PEG           PE    Revenue(M)           Cooper Industries Provides Updated Third
               Gauge         growth           growth                                                                Quarter and Full Year Guidance and Preliminary
   CBE                       2.32%          13.67%          15.37%         0.88        13.01         5,066          Outlook for 2012 - Sep 15, 2011

   TRMB                     11.94%          18.50%          11.36%         1.01        20.09         1,294
                                                                                                                    Cooper Lighting's Outdoor LED Product Wins
                                                                                                                    Two Top Awards in Architectural SSL Product
   SI                        2.18%          35.48%           5.92%         0.23         8.04       103,125          Innovation Competition - Aug 25, 2011

   GRMN                     27.47%          15.00%          22.77%         1.04        11.97         2,690          Cooper Lighting's Outdoor LED Product Wins
                                                                                                                    Two Top Awards in Architectural SSL Product
   PHG                       1.63%                 -        -1.30%            -        17.09        34,596          Innovation Competition - Aug 25, 2011
                                                                                                                    Cooper Lighting Introduces a Series of Metalux
                                                                                                                    Retrofit ...
                                                                                                                    Cooper Industries may withdraw bid to buy Laird
                                                                                                                    - Jul ...


        Company Details                                            Company Profile

        COOPER INDS PLC                                            Cooper Industries Plc, formerly Cooper Industries, Ltd., operates in two business
        5 FITZWILLIAM SQUARE                                       segments: Electrical Products and Tools. The Company manufactures, markets and sells
        DUBLIN 2, L2 00000                                         its products and provides services throughout the world. Operations in the United States
        USA                                                        are conducted by wholly owned subsidiaries of Cooper, organized by the two business
        Phone: 7132098400                                          segments. Cooper serves four major markets: the industrial, commercial, utility and
        Fax: 713-209-8981                                          residential markets. Cooper also serves the electronics and telecommunications markets.
        Website:                                                   Markets for Cooper's products and services are worldwide, with United States being the
        http://http://www.cooperindustries.c                       key market. The Electrical Products segment manufactures, markets and sells electrical
        om                                                         and circuit protection products. The Tools segment manufactures, markets and sells
        Full Time Employees: 24,795                                hand tools for industrial, construction, electronics and consumer markets.
        Sector: Computer and Technology


  Power Gauge Ratings are created using a relative ranking system that assigns a rank of 0 to 100 (100 being the highest) to each stock in the universe. Rank is calculated
  by evaluating each of the stocks factors and combining them into a single number using a weighting formula. A stock's rank ranges from 100-0, where 100 is the
  strongest, and a rank of 95 indicates the stock is better than 95% of the stocks in the universe.

  Chaikin Stock Research(CSR) is not registered as a securities broker dealer or investment advisor with either the U.S. Securities and Exchange Commission or with any
  state securities regulatory authority. CSR is not responsible for trades executed by users of this research report, our web site or mobile app based on the information
  included herein. The information presented in this report does not represent a recommendation to buy or sell stocks or any financial instrument nor is it intended as an
  endorsement of any security or investment. The information in this report is generic by nature and is not personalized to the specific financial situation of any individual.
  The user bears complete responsibility for their own investment research and should seek the advice of a qualified investment professional before making any investment
  decisions.

  Copyright (c) 1978-(Present) by ZACKS Investment Research, Inc ("ZACKS"). The information, data, analyses and opinions contained herein (1) includes the
  confidential and proprietary information of ZACKS, (2) may not be copied or redistributed, for any purpose, (3) does not constitute investment advice offered by
  ZACKS, (4) are provided solely for informational purposes, and (5) are not warranted or represented to be correct, complete, accurate or timely. ZACKS shall not be
  responsible for investment decisions, damages or other losses resulting from, or related to, use of this information, data, analyses or opinions. Past performance is no
  guarantee of future performance. ZACKS is not affiliated with Chaikin Power Tools.

  This report from Chaikin Power Tools is for informational purposes only and is not a recommendation to buy or sell securities.


                                                                                                                                                                     LM 2.3 DS 3.0 LS 2.1


 Data Provided by ZACKS Investment Research, Inc., www.zacks.com                     Special offers to trade stocks from optionsXpress: www.chaikinpowertools.com

Más contenido relacionado

Más de Dan Oconnor

How Chaikin Analytics Helps You Make More Money - Stock Analysis and Tips
How Chaikin Analytics Helps You Make More Money - Stock Analysis and TipsHow Chaikin Analytics Helps You Make More Money - Stock Analysis and Tips
How Chaikin Analytics Helps You Make More Money - Stock Analysis and TipsDan Oconnor
 
Investing Tips for Beginners and Experts - Invest Smarter in 5 Simple Steps
Investing Tips for Beginners and Experts - Invest Smarter in 5 Simple StepsInvesting Tips for Beginners and Experts - Invest Smarter in 5 Simple Steps
Investing Tips for Beginners and Experts - Invest Smarter in 5 Simple StepsDan Oconnor
 
Combining fundamental and technical analysis to increase trading profits
Combining fundamental and technical analysis to increase trading profitsCombining fundamental and technical analysis to increase trading profits
Combining fundamental and technical analysis to increase trading profitsDan Oconnor
 
How to start investing and trading in 5 simple steps
How to start investing and trading in 5 simple stepsHow to start investing and trading in 5 simple steps
How to start investing and trading in 5 simple stepsDan Oconnor
 
Stock market tips from marc chaikin
Stock market tips from marc chaikinStock market tips from marc chaikin
Stock market tips from marc chaikinDan Oconnor
 
Find Stock Ideas, Manage Stock Portfolios and Tame Big Data with Chaikin
Find Stock Ideas, Manage Stock Portfolios and Tame Big Data with ChaikinFind Stock Ideas, Manage Stock Portfolios and Tame Big Data with Chaikin
Find Stock Ideas, Manage Stock Portfolios and Tame Big Data with ChaikinDan Oconnor
 
Rachel Fox: Short-Term Trading Tips and Strategies with Chaikin Analytics
Rachel Fox: Short-Term Trading Tips and Strategies with Chaikin AnalyticsRachel Fox: Short-Term Trading Tips and Strategies with Chaikin Analytics
Rachel Fox: Short-Term Trading Tips and Strategies with Chaikin AnalyticsDan Oconnor
 

Más de Dan Oconnor (9)

How Chaikin Analytics Helps You Make More Money - Stock Analysis and Tips
How Chaikin Analytics Helps You Make More Money - Stock Analysis and TipsHow Chaikin Analytics Helps You Make More Money - Stock Analysis and Tips
How Chaikin Analytics Helps You Make More Money - Stock Analysis and Tips
 
Investing Tips for Beginners and Experts - Invest Smarter in 5 Simple Steps
Investing Tips for Beginners and Experts - Invest Smarter in 5 Simple StepsInvesting Tips for Beginners and Experts - Invest Smarter in 5 Simple Steps
Investing Tips for Beginners and Experts - Invest Smarter in 5 Simple Steps
 
Investing Tips for Beginners and Experts - Invest Smarter in 5 Simple Steps
Investing Tips for Beginners and Experts - Invest Smarter in 5 Simple StepsInvesting Tips for Beginners and Experts - Invest Smarter in 5 Simple Steps
Investing Tips for Beginners and Experts - Invest Smarter in 5 Simple Steps
 
Combining fundamental and technical analysis to increase trading profits
Combining fundamental and technical analysis to increase trading profitsCombining fundamental and technical analysis to increase trading profits
Combining fundamental and technical analysis to increase trading profits
 
Combining fundamental and technical analysis to increase trading profits
Combining fundamental and technical analysis to increase trading profitsCombining fundamental and technical analysis to increase trading profits
Combining fundamental and technical analysis to increase trading profits
 
How to start investing and trading in 5 simple steps
How to start investing and trading in 5 simple stepsHow to start investing and trading in 5 simple steps
How to start investing and trading in 5 simple steps
 
Stock market tips from marc chaikin
Stock market tips from marc chaikinStock market tips from marc chaikin
Stock market tips from marc chaikin
 
Find Stock Ideas, Manage Stock Portfolios and Tame Big Data with Chaikin
Find Stock Ideas, Manage Stock Portfolios and Tame Big Data with ChaikinFind Stock Ideas, Manage Stock Portfolios and Tame Big Data with Chaikin
Find Stock Ideas, Manage Stock Portfolios and Tame Big Data with Chaikin
 
Rachel Fox: Short-Term Trading Tips and Strategies with Chaikin Analytics
Rachel Fox: Short-Term Trading Tips and Strategies with Chaikin AnalyticsRachel Fox: Short-Term Trading Tips and Strategies with Chaikin Analytics
Rachel Fox: Short-Term Trading Tips and Strategies with Chaikin Analytics
 

Último

Malegaon Call Girls Service ☎ ️82500–77686 ☎️ Enjoy 24/7 Escort Service
Malegaon Call Girls Service ☎ ️82500–77686 ☎️ Enjoy 24/7 Escort ServiceMalegaon Call Girls Service ☎ ️82500–77686 ☎️ Enjoy 24/7 Escort Service
Malegaon Call Girls Service ☎ ️82500–77686 ☎️ Enjoy 24/7 Escort ServiceDamini Dixit
 
Katrina Personal Brand Project and portfolio 1
Katrina Personal Brand Project and portfolio 1Katrina Personal Brand Project and portfolio 1
Katrina Personal Brand Project and portfolio 1kcpayne
 
Falcon Invoice Discounting: Empowering Your Business Growth
Falcon Invoice Discounting: Empowering Your Business GrowthFalcon Invoice Discounting: Empowering Your Business Growth
Falcon Invoice Discounting: Empowering Your Business GrowthFalcon investment
 
Phases of Negotiation .pptx
 Phases of Negotiation .pptx Phases of Negotiation .pptx
Phases of Negotiation .pptxnandhinijagan9867
 
Call Now ☎️🔝 9332606886🔝 Call Girls ❤ Service In Bhilwara Female Escorts Serv...
Call Now ☎️🔝 9332606886🔝 Call Girls ❤ Service In Bhilwara Female Escorts Serv...Call Now ☎️🔝 9332606886🔝 Call Girls ❤ Service In Bhilwara Female Escorts Serv...
Call Now ☎️🔝 9332606886🔝 Call Girls ❤ Service In Bhilwara Female Escorts Serv...Anamikakaur10
 
Mysore Call Girls 8617370543 WhatsApp Number 24x7 Best Services
Mysore Call Girls 8617370543 WhatsApp Number 24x7 Best ServicesMysore Call Girls 8617370543 WhatsApp Number 24x7 Best Services
Mysore Call Girls 8617370543 WhatsApp Number 24x7 Best ServicesDipal Arora
 
Cracking the Cultural Competence Code.pptx
Cracking the Cultural Competence Code.pptxCracking the Cultural Competence Code.pptx
Cracking the Cultural Competence Code.pptxWorkforce Group
 
RSA Conference Exhibitor List 2024 - Exhibitors Data
RSA Conference Exhibitor List 2024 - Exhibitors DataRSA Conference Exhibitor List 2024 - Exhibitors Data
RSA Conference Exhibitor List 2024 - Exhibitors DataExhibitors Data
 
Organizational Transformation Lead with Culture
Organizational Transformation Lead with CultureOrganizational Transformation Lead with Culture
Organizational Transformation Lead with CultureSeta Wicaksana
 
The Abortion pills for sale in Qatar@Doha [+27737758557] []Deira Dubai Kuwait
The Abortion pills for sale in Qatar@Doha [+27737758557] []Deira Dubai KuwaitThe Abortion pills for sale in Qatar@Doha [+27737758557] []Deira Dubai Kuwait
The Abortion pills for sale in Qatar@Doha [+27737758557] []Deira Dubai Kuwaitdaisycvs
 
Marel Q1 2024 Investor Presentation from May 8, 2024
Marel Q1 2024 Investor Presentation from May 8, 2024Marel Q1 2024 Investor Presentation from May 8, 2024
Marel Q1 2024 Investor Presentation from May 8, 2024Marel
 
Famous Olympic Siblings from the 21st Century
Famous Olympic Siblings from the 21st CenturyFamous Olympic Siblings from the 21st Century
Famous Olympic Siblings from the 21st Centuryrwgiffor
 
It will be International Nurses' Day on 12 May
It will be International Nurses' Day on 12 MayIt will be International Nurses' Day on 12 May
It will be International Nurses' Day on 12 MayNZSG
 
Russian Call Girls In Rajiv Chowk Gurgaon ❤️8448577510 ⊹Best Escorts Service ...
Russian Call Girls In Rajiv Chowk Gurgaon ❤️8448577510 ⊹Best Escorts Service ...Russian Call Girls In Rajiv Chowk Gurgaon ❤️8448577510 ⊹Best Escorts Service ...
Russian Call Girls In Rajiv Chowk Gurgaon ❤️8448577510 ⊹Best Escorts Service ...lizamodels9
 
SEO Case Study: How I Increased SEO Traffic & Ranking by 50-60% in 6 Months
SEO Case Study: How I Increased SEO Traffic & Ranking by 50-60%  in 6 MonthsSEO Case Study: How I Increased SEO Traffic & Ranking by 50-60%  in 6 Months
SEO Case Study: How I Increased SEO Traffic & Ranking by 50-60% in 6 MonthsIndeedSEO
 
Falcon's Invoice Discounting: Your Path to Prosperity
Falcon's Invoice Discounting: Your Path to ProsperityFalcon's Invoice Discounting: Your Path to Prosperity
Falcon's Invoice Discounting: Your Path to Prosperityhemanthkumar470700
 
PHX May 2024 Corporate Presentation Final
PHX May 2024 Corporate Presentation FinalPHX May 2024 Corporate Presentation Final
PHX May 2024 Corporate Presentation FinalPanhandleOilandGas
 

Último (20)

Malegaon Call Girls Service ☎ ️82500–77686 ☎️ Enjoy 24/7 Escort Service
Malegaon Call Girls Service ☎ ️82500–77686 ☎️ Enjoy 24/7 Escort ServiceMalegaon Call Girls Service ☎ ️82500–77686 ☎️ Enjoy 24/7 Escort Service
Malegaon Call Girls Service ☎ ️82500–77686 ☎️ Enjoy 24/7 Escort Service
 
Katrina Personal Brand Project and portfolio 1
Katrina Personal Brand Project and portfolio 1Katrina Personal Brand Project and portfolio 1
Katrina Personal Brand Project and portfolio 1
 
Falcon Invoice Discounting: Empowering Your Business Growth
Falcon Invoice Discounting: Empowering Your Business GrowthFalcon Invoice Discounting: Empowering Your Business Growth
Falcon Invoice Discounting: Empowering Your Business Growth
 
Phases of Negotiation .pptx
 Phases of Negotiation .pptx Phases of Negotiation .pptx
Phases of Negotiation .pptx
 
unwanted pregnancy Kit [+918133066128] Abortion Pills IN Dubai UAE Abudhabi
unwanted pregnancy Kit [+918133066128] Abortion Pills IN Dubai UAE Abudhabiunwanted pregnancy Kit [+918133066128] Abortion Pills IN Dubai UAE Abudhabi
unwanted pregnancy Kit [+918133066128] Abortion Pills IN Dubai UAE Abudhabi
 
Call Now ☎️🔝 9332606886🔝 Call Girls ❤ Service In Bhilwara Female Escorts Serv...
Call Now ☎️🔝 9332606886🔝 Call Girls ❤ Service In Bhilwara Female Escorts Serv...Call Now ☎️🔝 9332606886🔝 Call Girls ❤ Service In Bhilwara Female Escorts Serv...
Call Now ☎️🔝 9332606886🔝 Call Girls ❤ Service In Bhilwara Female Escorts Serv...
 
Falcon Invoice Discounting platform in india
Falcon Invoice Discounting platform in indiaFalcon Invoice Discounting platform in india
Falcon Invoice Discounting platform in india
 
(Anamika) VIP Call Girls Napur Call Now 8617697112 Napur Escorts 24x7
(Anamika) VIP Call Girls Napur Call Now 8617697112 Napur Escorts 24x7(Anamika) VIP Call Girls Napur Call Now 8617697112 Napur Escorts 24x7
(Anamika) VIP Call Girls Napur Call Now 8617697112 Napur Escorts 24x7
 
Mysore Call Girls 8617370543 WhatsApp Number 24x7 Best Services
Mysore Call Girls 8617370543 WhatsApp Number 24x7 Best ServicesMysore Call Girls 8617370543 WhatsApp Number 24x7 Best Services
Mysore Call Girls 8617370543 WhatsApp Number 24x7 Best Services
 
Cracking the Cultural Competence Code.pptx
Cracking the Cultural Competence Code.pptxCracking the Cultural Competence Code.pptx
Cracking the Cultural Competence Code.pptx
 
RSA Conference Exhibitor List 2024 - Exhibitors Data
RSA Conference Exhibitor List 2024 - Exhibitors DataRSA Conference Exhibitor List 2024 - Exhibitors Data
RSA Conference Exhibitor List 2024 - Exhibitors Data
 
Organizational Transformation Lead with Culture
Organizational Transformation Lead with CultureOrganizational Transformation Lead with Culture
Organizational Transformation Lead with Culture
 
The Abortion pills for sale in Qatar@Doha [+27737758557] []Deira Dubai Kuwait
The Abortion pills for sale in Qatar@Doha [+27737758557] []Deira Dubai KuwaitThe Abortion pills for sale in Qatar@Doha [+27737758557] []Deira Dubai Kuwait
The Abortion pills for sale in Qatar@Doha [+27737758557] []Deira Dubai Kuwait
 
Marel Q1 2024 Investor Presentation from May 8, 2024
Marel Q1 2024 Investor Presentation from May 8, 2024Marel Q1 2024 Investor Presentation from May 8, 2024
Marel Q1 2024 Investor Presentation from May 8, 2024
 
Famous Olympic Siblings from the 21st Century
Famous Olympic Siblings from the 21st CenturyFamous Olympic Siblings from the 21st Century
Famous Olympic Siblings from the 21st Century
 
It will be International Nurses' Day on 12 May
It will be International Nurses' Day on 12 MayIt will be International Nurses' Day on 12 May
It will be International Nurses' Day on 12 May
 
Russian Call Girls In Rajiv Chowk Gurgaon ❤️8448577510 ⊹Best Escorts Service ...
Russian Call Girls In Rajiv Chowk Gurgaon ❤️8448577510 ⊹Best Escorts Service ...Russian Call Girls In Rajiv Chowk Gurgaon ❤️8448577510 ⊹Best Escorts Service ...
Russian Call Girls In Rajiv Chowk Gurgaon ❤️8448577510 ⊹Best Escorts Service ...
 
SEO Case Study: How I Increased SEO Traffic & Ranking by 50-60% in 6 Months
SEO Case Study: How I Increased SEO Traffic & Ranking by 50-60%  in 6 MonthsSEO Case Study: How I Increased SEO Traffic & Ranking by 50-60%  in 6 Months
SEO Case Study: How I Increased SEO Traffic & Ranking by 50-60% in 6 Months
 
Falcon's Invoice Discounting: Your Path to Prosperity
Falcon's Invoice Discounting: Your Path to ProsperityFalcon's Invoice Discounting: Your Path to Prosperity
Falcon's Invoice Discounting: Your Path to Prosperity
 
PHX May 2024 Corporate Presentation Final
PHX May 2024 Corporate Presentation FinalPHX May 2024 Corporate Presentation Final
PHX May 2024 Corporate Presentation Final
 

Stock Research Report for Cooper Inds Plc CBE as of 9/22/11 - Chaikin Power Tools

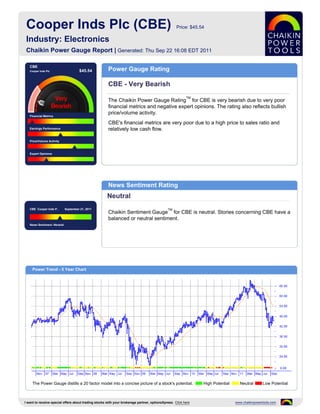
  • 1. Cooper Inds Plc (CBE) Price: $45.54 Industry: Electronics Chaikin Power Gauge Report | Generated: Thu Sep 22 16:08 EDT 2011 CBE Cooper Inds Plc $45.54 Power Gauge Rating CBE - Very Bearish TM The Chaikin Power Gauge Rating for CBE is very bearish due to very poor financial metrics and negative expert opinions. The rating also reflects bullish price/volume activity. Financial Metrics CBE's financial metrics are very poor due to a high price to sales ratio and Earnings Performance relatively low cash flow. Price/Volume Activity Expert Opinions News Sentiment Rating Neutral CBE Cooper Inds P.. September 21, 2011 TM Chaikin Sentiment Gauge for CBE is neutral. Stories concerning CBE have a balanced or neutral sentiment. News Sentiment :Neutral Power Trend - 5 Year Chart The Power Gauge distills a 20 factor model into a concise picture of a stock's potential. High Potential Neutral Low Potential I want to receive special offers about trading stocks with your brokerage partner, optionsXpress. Click here www.chaikinpowertools.com
  • 2. Financials & Earnings Financial Metrics Financial Metrics Rating LT Debt/Equity Ratio Very Bearish Price to Book Value CBE's financial metrics are very poor. The company has relatively low revenue per share and generates relatively low free cash flow relative to market Return on Equity capitalization. The rank is based on a high long term debt to equity ratio, high return on equity, Price to Sales Ratio high price to sales ratio and relatively low cash flow. Business Value Assets and Liabilities Valuation Returns Ratio TTM Ratio TTM Ratio TTM Current Ratio 2.59 Price/Book 2.03 Return on Invest 12.6% LT Debt/Equity 0.44 Price/Sales 1.48 Return on Equity 17.4% Earnings Performance Earnings Performance Rating Earnings Growth Neutral Earnings Surprise CBE's earnings performance has been neutral. The company has a stable 5 year earnings trend and has a history of weak earnings growth. Earnings Trend The rank is based on poor EPS growth over the past 3-5 years, worse than expected earnings in recent quarters, an upward trend in earnings this year, a Projected P/E Ratio relatively high projected P/E ratio and consistent earnings over the past 5 years. Earnings Consistency 5 Year Revenue and Earnings Growth EPS Estimates 12/06 12/07 12/08 12/09 12/10 Factor Actual EPS Prev EST EPS Current Change Revenue(M) 5,184.60 5,903.10 6,521.30 5,069.60 5,065.90 Quarterly EPS $0.86 $0.96 +0.10 Rev % Growth 9.60% 13.86% 10.47% -22.26% -0.07% Yearly EPS $2.67 $3.80 +1.13 EPS $2.52 $3.80 $3.64 $2.63 $2.67 Factor Actual EPS Growth Est EPS Growth Change EPS % Growth 19.39% 50.50% -4.21% -27.75% 1.52% 3-5 year EPS 2.32% 13.67% +11.35 EPS Surprise EPS Quarterly Results Estimate Actual Difference % Difference FY Qtr 1 Qtr 2 Qtr 3 Qtr 4 Total Latest Qtr $0.95 $0.96 $0.01 1.05 12/09 $0.60 $0.53 $0.72 $0.77 $2.62 1 Qtr Ago $0.84 $0.84 $0.00 0.00 12/10 $0.71 $0.25 $0.86 $0.87 $2.69 2 Qtr Ago $0.85 $0.85 $0.00 0.00 12/11 $2.10 $0.98 - - - 3 Qtr Ago $0.84 $0.85 $0.01 1.19 Fiscal Year End Month is December. I want to receive special offers about trading stocks with your brokerage partner, optionsXpress. Click here www.chaikinpowertools.com
  • 3. Price Trend & Expert Opinions Price/Volume Activity Price/Volume Activity Rating Relative Strength vs Market Bullish Chaikin Money Flow Price and volume activity for CBE is bullish. CBE is trading on higher volume than its 90 day average volume and is in an accelerating price trend compared to 4 Price Trend months ago. Price Trend ROC The rank for CBE is based on its relative weakness versus the market, negative Chaikin money flow, a negative Chaikin price trend, a positive Chaikin price trend ROC and an increasing volume trend. Volume Trend Relative Strength vs S&P500 Index Chaikin Money Flow Chart shows whether CBE is performing better or worse than the market. Chaikin Money Flow analyzes supply and demand for a company's stock. Price Activity Price Activity Volume Activity Factor Value Factor Value Factor Value 52 Week High 69.76 % Change Price - 4 Weeks 2.34% Average Volume 20 Days 1,685,504 52 Week Low 41.72 % Change Price - 24 Weeks -33.00% Average Volume 90 Days 1,669,142 % Change YTD Rel S&P 500 -15.45% % Change Price - 4 Wks Rel to S&P 3.29% Chaikin Money Flow Persistency 32% % Change Price - 24 Wks Rel to S&P -23.30% Expert Opinions Expert Opinions Earnings Estimate Revisions Bearish Short Interest Expert opinions about CBE are negative. Analysts are lowering their EPS estimates for CBE and analysts's opinions on CBE have been more negative Insider Activity recently. The rank for CBE is based on analysts revising earnings estimates downward, a Analyst Opinions low short interest ratio and pessimistic analyst opinions. Relative Strength vs Industry Earnings Estimate Revisions Analyst Recommendations EPS Estimates Revision Summary Current 7 Days Ago % Change Factor Value Last Week Last 4 Weeks Current Qtr 0.96 1.03 -6.80% Mean this Week Strong Buy Up Down Up Down Next Qtr 0.96 1.01 -4.95% Mean Last Week Strong Buy Curr Qtr 0 10 0 10 Curr Yr 0 8 0 8 Current 30 Days Ago % Change Change 0.00 Next Qtr 0 10 0 10 Current FY 3.80 3.91 -0.11 Mean 5 Weeks Ago Strong Buy Next Yr 0 9 0 10 I want to receive special offers about trading stocks with your brokerage partner, optionsXpress. Click here www.chaikinpowertools.com
  • 4. The Company & Its Competitors CBE's Competitors in Electronics News Headlines for CBE Company Power Historic EPS Projected EPS Profit Margin PEG PE Revenue(M) Cooper Industries Provides Updated Third Gauge growth growth Quarter and Full Year Guidance and Preliminary CBE 2.32% 13.67% 15.37% 0.88 13.01 5,066 Outlook for 2012 - Sep 15, 2011 TRMB 11.94% 18.50% 11.36% 1.01 20.09 1,294 Cooper Lighting's Outdoor LED Product Wins Two Top Awards in Architectural SSL Product SI 2.18% 35.48% 5.92% 0.23 8.04 103,125 Innovation Competition - Aug 25, 2011 GRMN 27.47% 15.00% 22.77% 1.04 11.97 2,690 Cooper Lighting's Outdoor LED Product Wins Two Top Awards in Architectural SSL Product PHG 1.63% - -1.30% - 17.09 34,596 Innovation Competition - Aug 25, 2011 Cooper Lighting Introduces a Series of Metalux Retrofit ... Cooper Industries may withdraw bid to buy Laird - Jul ... Company Details Company Profile COOPER INDS PLC Cooper Industries Plc, formerly Cooper Industries, Ltd., operates in two business 5 FITZWILLIAM SQUARE segments: Electrical Products and Tools. The Company manufactures, markets and sells DUBLIN 2, L2 00000 its products and provides services throughout the world. Operations in the United States USA are conducted by wholly owned subsidiaries of Cooper, organized by the two business Phone: 7132098400 segments. Cooper serves four major markets: the industrial, commercial, utility and Fax: 713-209-8981 residential markets. Cooper also serves the electronics and telecommunications markets. Website: Markets for Cooper's products and services are worldwide, with United States being the http://http://www.cooperindustries.c key market. The Electrical Products segment manufactures, markets and sells electrical om and circuit protection products. The Tools segment manufactures, markets and sells Full Time Employees: 24,795 hand tools for industrial, construction, electronics and consumer markets. Sector: Computer and Technology Power Gauge Ratings are created using a relative ranking system that assigns a rank of 0 to 100 (100 being the highest) to each stock in the universe. Rank is calculated by evaluating each of the stocks factors and combining them into a single number using a weighting formula. A stock's rank ranges from 100-0, where 100 is the strongest, and a rank of 95 indicates the stock is better than 95% of the stocks in the universe. Chaikin Stock Research(CSR) is not registered as a securities broker dealer or investment advisor with either the U.S. Securities and Exchange Commission or with any state securities regulatory authority. CSR is not responsible for trades executed by users of this research report, our web site or mobile app based on the information included herein. The information presented in this report does not represent a recommendation to buy or sell stocks or any financial instrument nor is it intended as an endorsement of any security or investment. The information in this report is generic by nature and is not personalized to the specific financial situation of any individual. The user bears complete responsibility for their own investment research and should seek the advice of a qualified investment professional before making any investment decisions. Copyright (c) 1978-(Present) by ZACKS Investment Research, Inc ("ZACKS"). The information, data, analyses and opinions contained herein (1) includes the confidential and proprietary information of ZACKS, (2) may not be copied or redistributed, for any purpose, (3) does not constitute investment advice offered by ZACKS, (4) are provided solely for informational purposes, and (5) are not warranted or represented to be correct, complete, accurate or timely. ZACKS shall not be responsible for investment decisions, damages or other losses resulting from, or related to, use of this information, data, analyses or opinions. Past performance is no guarantee of future performance. ZACKS is not affiliated with Chaikin Power Tools. This report from Chaikin Power Tools is for informational purposes only and is not a recommendation to buy or sell securities. LM 2.3 DS 3.0 LS 2.1 Data Provided by ZACKS Investment Research, Inc., www.zacks.com Special offers to trade stocks from optionsXpress: www.chaikinpowertools.com