Stock Research Report for PAY as of 9/8/11 - Chaikin Power Tools
•
0 likes•134 views

To order a free Chaikin Power Gauge stock research report for PAY go to http://www.chaikinpowertools.com/reports

Recommended
Recommended
More Related Content
Recently uploaded
Recently uploaded (20)
Featured
Featured (20)
Stock Research Report for PAY as of 9/8/11 - Chaikin Power Tools
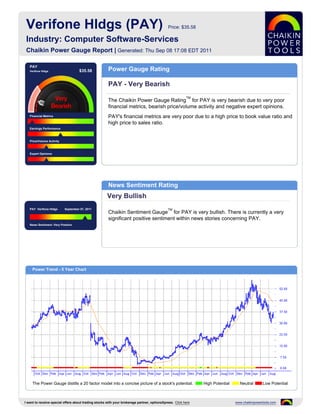
- 1. Verifone Hldgs (PAY) Price: $35.58 Industry: Computer Software-Services Chaikin Power Gauge Report | Generated: Thu Sep 08 17:08 EDT 2011 PAY Verifone Hldgs $35.58 Power Gauge Rating PAY - Very Bearish TM The Chaikin Power Gauge Rating for PAY is very bearish due to very poor financial metrics, bearish price/volume activity and negative expert opinions. Financial Metrics PAY's financial metrics are very poor due to a high price to book value ratio and high price to sales ratio. Earnings Performance Price/Volume Activity Expert Opinions News Sentiment Rating Very Bullish PAY Verifone Hldgs September 07, 2011 TM Chaikin Sentiment Gauge for PAY is very bullish. There is currently a very significant positive sentiment within news stories concerning PAY. News Sentiment :Very Positive Power Trend - 5 Year Chart The Power Gauge distills a 20 factor model into a concise picture of a stock's potential. High Potential Neutral Low Potential I want to receive special offers about trading stocks with your brokerage partner, optionsXpress. Click here www.chaikinpowertools.com
- 2. Financials & Earnings Financial Metrics Financial Metrics Rating LT Debt/Equity Ratio Very Bearish Price to Book Value PAY's financial metrics are very poor. The company may be overvalued and has relatively low revenue per share. Return on Equity The rank is based on a high price to book value ratio, high return on equity and high price to sales ratio. Price to Sales Ratio Business Value Assets and Liabilities Valuation Returns Ratio TTM Ratio TTM Ratio TTM Current Ratio 3.08 Price/Book 7.54 Return on Invest 17.3% LT Debt/Equity 2.27 Price/Sales 3.17 Return on Equity 52.2% Earnings Performance Earnings Performance Rating Earnings Growth Neutral Earnings Surprise PAY's earnings performance has been neutral. The company experienced superior earnings growth in the past 12 months and is priced relatively high compared to next year's projected EPS. Earnings Trend The rank is based on an upward trend in earnings this year, a relatively high Projected P/E Ratio projected P/E ratio and consistent earnings over the past 5 years. Earnings Consistency 5 Year Revenue and Earnings Growth EPS Estimates 10/06 10/07 10/08 10/09 10/10 Factor Actual EPS Prev EST EPS Current Change Revenue(M) 581.07 902.89 921.93 844.71 1,001.54 Quarterly EPS $0.58 $0.40 -0.18 Rev % Growth 19.72% 55.38% 2.11% -8.38% 18.57% Yearly EPS $1.16 $1.55 +0.39 EPS $0.90 $-0.41 $-5.00 $-1.63 $1.16 Factor Actual EPS Growth Est EPS Growth Change EPS % Growth 57.89% -145.56% -1,119.51% 67.40% 171.17% 3-5 year EPS 17.48% 21.67% +4.19 EPS Surprise EPS Quarterly Results Estimate Actual Difference % Difference FY Qtr 1 Qtr 2 Qtr 3 Qtr 4 Total Latest Qtr $0.40 $0.40 $0.00 0.00 10/09 $-2.15 $0.22 $0.26 $0.04 $-1.63 1 Qtr Ago $0.38 $0.38 $0.00 0.00 10/10 $0.13 $0.24 $0.22 $0.58 $1.17 2 Qtr Ago $0.33 $0.35 $0.02 6.06 10/11 $0.37 $0.29 - - - 3 Qtr Ago $0.30 $0.33 $0.03 10.00 Fiscal Year End Month is October. I want to receive special offers about trading stocks with your brokerage partner, optionsXpress. Click here www.chaikinpowertools.com
- 3. Price Trend & Expert Opinions Price/Volume Activity Price/Volume Activity Rating Relative Strength vs Market Bearish Chaikin Money Flow Price and volume activity for PAY is bearish. PAY has underperformed the S&P 500 over 26 weeks and has a declining price trend. Price Trend The rank for PAY is based on its relative weakness versus the market, positive Price Trend ROC Chaikin money flow, a negative Chaikin price trend, a positive Chaikin price trend ROC and a decreasing volume trend. Volume Trend Relative Strength vs S&P500 Index Chaikin Money Flow Chart shows whether PAY is performing better or worse than the market. Chaikin Money Flow analyzes supply and demand for a company's stock. Price Activity Price Activity Volume Activity Factor Value Factor Value Factor Value 52 Week High 56.84 % Change Price - 4 Weeks 2.42% Average Volume 20 Days 2,471,960 52 Week Low 26.14 % Change Price - 24 Weeks -33.40% Average Volume 90 Days 2,903,273 % Change YTD Rel S&P 500 -3.32% % Change Price - 4 Wks Rel to S&P -4.23% Chaikin Money Flow Persistency 54% % Change Price - 24 Wks Rel to S&P -27.91% Expert Opinions Expert Opinions Earnings Estimate Revisions Bearish Short Interest Expert opinions about PAY are negative. Insiders are not net buyers of PAY's stock and PAY has been under-performing the Computer Software-Services Insider Activity industry over the past 13 weeks. The rank for PAY is based on analysts revising earnings estimates upward, a Analyst Opinions high short interest ratio, insiders not purchasing significant amounts of stock, optimistic analyst opinions and relative weakness of the stock versus the Relative Strength vs Industry Computer Software-Services industry group. Earnings Estimate Revisions Analyst Recommendations EPS Estimates Revision Summary Current 7 Days Ago % Change Factor Value Last Week Last 4 Weeks Current Qtr 0.40 0.41 -2.44% Mean this Week Buy Up Down Up Down Next Qtr 0.46 0.47 -2.13% Mean Last Week Buy Curr Qtr 0 1 1 1 Curr Yr 0 1 1 1 Current 30 Days Ago % Change Change 0.00 Next Qtr 0 1 0 1 Current FY 1.55 1.53 0.02 Mean 5 Weeks Ago Buy Next Yr 2 0 2 1 I want to receive special offers about trading stocks with your brokerage partner, optionsXpress. Click here www.chaikinpowertools.com
- 4. The Company & Its Competitors PAY's Competitors in Computer Software-Services News Headlines for PAY Company Power Historic EPS Projected EPS Profit Margin PEG PE Revenue(M) Standard & Poor's Announces Change to U.S. Gauge growth growth Index - Sep 7, 2011 PAY 17.48% 21.67% 11.24% 1.06 24.36 1,002 VeriFone, Hypercom complete merger - Aug 4, MSFT 9.84% 11.08% 33.10% 0.84 9.85 69,943 2011 VeriFone to Acquire South Africa Payments CA 3.31% 12.00% 18.64% 0.83 10.61 4,429 Solutions Provider - May 24, 2011 INTU 10.53% 14.00% 16.46% 1.30 21.80 3,851 VeriFone and MICROS First to Bring NFC Services to the Table - May 19, 2011 ORCL 20.32% 15.00% 23.99% 0.80 13.03 35,622 ViVOtech Ready, Willing, Able to Buy Hypercom SYMC 8.78% 9.00% 9.49% 1.26 13.37 6,190 U.S. Assets - May 13, 2011 SAP 10.55% 13.00% 14.45% 1.08 15.65 17,003 INFY 23.83% 16.80% 24.50% 1.02 18.47 6,041 Company Details Company Profile VERIFONE HLDGS Verifone Holdings, Inc., a global leader in secure electronic payment technologies, 2099 GATEWAY PLACE provides expertise, solutions and services for today with a migration strategy for SAN JOSE, CA 95110 tomorrow. VeriFone delivers solutions that add value to the point of sale, resulting in USA improved merchant retention and the generation of new sources of revenue for its Phone: (408) 232-7800 partners and customers. VeriFone solutions are specifically designed to meet the needs Fax: 312-279-1710 of vertical markets including financial, retail, petroleum, government and healthcare. Website: http://http://www.verifone.com Full Time Employees: 2,565 Sector: Computer and Technology Power Gauge Ratings are created using a relative ranking system that assigns a rank of 0 to 100 (100 being the highest) to each stock in the universe. Rank is calculated by evaluating each of the stocks factors and combining them into a single number using a weighting formula. A stock's rank ranges from 100-0, where 100 is the strongest, and a rank of 95 indicates the stock is better than 95% of the stocks in the universe. Chaikin Stock Research(CSR) is not registered as a securities broker dealer or investment advisor with either the U.S. Securities and Exchange Commission or with any state securities regulatory authority. CSR is not responsible for trades executed by users of this research report, our web site or mobile app based on the information included herein. The information presented in this report does not represent a recommendation to buy or sell stocks or any financial instrument nor is it intended as an endorsement of any security or investment. The information in this report is generic by nature and is not personalized to the specific financial situation of any individual. The user bears complete responsibility for their own investment research and should seek the advice of a qualified investment professional before making any investment decisions. Copyright (c) 1978-(Present) by ZACKS Investment Research, Inc ("ZACKS"). The information, data, analyses and opinions contained herein (1) includes the confidential and proprietary information of ZACKS, (2) may not be copied or redistributed, for any purpose, (3) does not constitute investment advice offered by ZACKS, (4) are provided solely for informational purposes, and (5) are not warranted or represented to be correct, complete, accurate or timely. ZACKS shall not be responsible for investment decisions, damages or other losses resulting from, or related to, use of this information, data, analyses or opinions. Past performance is no guarantee of future performance. ZACKS is not affiliated with Chaikin Power Tools. This report from Chaikin Power Tools is for informational purposes only and is not a recommendation to buy or sell securities. LM 2.3 DS 3.0 LS 2.1 Data Provided by ZACKS Investment Research, Inc., www.zacks.com Special offers to trade stocks from optionsXpress: www.chaikinpowertools.com