Stock Research Report for Yamana Gold Inc AES as of 11/17/11 - Chaikin Power Tools
•
1 like•182 views

To order a Chaikin Power Gauge stock research report for AES go to http://www.chaikinpowertools.com/reports

Recommended
More Related Content
Viewers also liked
More from Dan Oconnor
More from Dan Oconnor (10)
Recently uploaded
Recently uploaded (20)
Stock Research Report for Yamana Gold Inc AES as of 11/17/11 - Chaikin Power Tools
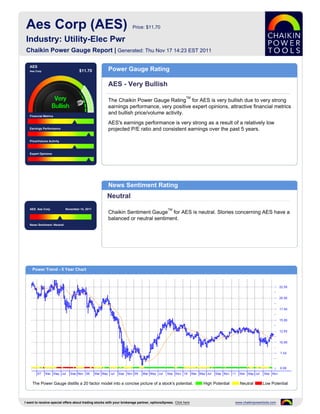
- 1. Aes Corp (AES) Price: $11.70 Industry: Utility-Elec Pwr Chaikin Power Gauge Report | Generated: Thu Nov 17 14:23 EST 2011 AES Aes Corp $11.70 Power Gauge Rating AES - Very Bullish TM The Chaikin Power Gauge Rating for AES is very bullish due to very strong earnings performance, very positive expert opinions, attractive financial metrics and bullish price/volume activity. Financial Metrics AES's earnings performance is very strong as a result of a relatively low Earnings Performance projected P/E ratio and consistent earnings over the past 5 years. Price/Volume Activity Expert Opinions News Sentiment Rating Neutral AES Aes Corp November 14, 2011 TM Chaikin Sentiment Gauge for AES is neutral. Stories concerning AES have a balanced or neutral sentiment. News Sentiment :Neutral Power Trend - 5 Year Chart The Power Gauge distills a 20 factor model into a concise picture of a stock's potential. High Potential Neutral Low Potential I want to receive special offers about trading stocks with your brokerage partner, optionsXpress. Click here www.chaikinpowertools.com
- 2. Financials & Earnings Financial Metrics Financial Metrics Rating LT Debt/Equity Ratio Bullish Price to Book Value AES's financial metrics are very good. The company has high revenue per share and generates high free cash flow relative to market capitalization. Return on Equity The rank is based on a high long term debt to equity ratio, low price to book value, low return on equity, low price to sales ratio and relatively high cash flow. Price to Sales Ratio Business Value Assets and Liabilities Valuation Returns Ratio TTM Ratio TTM Ratio TTM Current Ratio 1.39 Price/Book 0.93 Return on Invest 3.2% LT Debt/Equity 1.60 Price/Sales 0.55 Return on Equity 7.2% Earnings Performance Earnings Performance Rating Earnings Growth Very Bullish Earnings Surprise AES's earnings performance has been very strong. The company is priced relatively low compared to next year's projected EPS and has a stable 5 year earnings trend. Earnings Trend The rank is based on worse than expected earnings in recent quarters, a Projected P/E Ratio relatively low projected P/E ratio and consistent earnings over the past 5 years. Earnings Consistency 5 Year Revenue and Earnings Growth EPS Estimates 12/06 12/07 12/08 12/09 12/10 Factor Actual EPS Prev EST EPS Current Change Revenue(M) 12,299.00 13,588.00 16,070.00 14,119.00 16,647.00 Quarterly EPS $-0.55 $0.25 +0.80 Rev % Growth 10.94% 10.48% 18.27% -12.14% 17.90% Yearly EPS $0.01 $0.99 +0.98 EPS $0.39 $-0.14 $1.82 $0.98 $0.01 Factor Actual EPS Growth Est EPS Growth Change EPS % Growth -58.95% -135.90% 1,400.00% -46.15% -98.98% 3-5 year EPS 9.09% 8.00% -1.09 EPS Surprise EPS Quarterly Results Estimate Actual Difference % Difference FY Qtr 1 Qtr 2 Qtr 3 Qtr 4 Total Latest Qtr $0.24 $0.17 $-0.07 -29.17 12/09 $0.33 $0.45 $0.28 $-0.07 $0.99 1 Qtr Ago $0.24 $0.28 $0.04 16.67 12/10 $0.27 $0.18 $0.14 $-0.55 $0.04 2 Qtr Ago $0.26 $0.29 $0.03 11.54 12/11 $0.28 $0.22 $-0.17 - - 3 Qtr Ago $0.25 $0.23 $-0.02 -8.00 Fiscal Year End Month is December. I want to receive special offers about trading stocks with your brokerage partner, optionsXpress. Click here www.chaikinpowertools.com
- 3. Price Trend & Expert Opinions Price/Volume Activity Price/Volume Activity Rating Relative Strength vs Market Bullish Chaikin Money Flow Price and volume activity for AES is bullish. AES has a rising price trend and has outperformed the S&P 500 over 26 weeks. Price Trend The rank for AES is based on its price strength versus the market, a positive Price Trend ROC Chaikin price trend and a decreasing volume trend. Volume Trend Relative Strength vs S&P500 Index Chaikin Money Flow Chart shows whether AES is performing better or worse than the market. Chaikin Money Flow analyzes supply and demand for a company's stock. Price Activity Price Activity Volume Activity Factor Value Factor Value Factor Value 52 Week High 13.38 % Change Price - 4 Weeks 8.43% Average Volume 20 Days 5,758,490 52 Week Low 9.44 % Change Price - 24 Weeks -8.16% Average Volume 90 Days 7,318,501 % Change YTD Rel S&P 500 -3.76% % Change Price - 4 Wks Rel to S&P 6.06% Chaikin Money Flow Persistency 48% % Change Price - 24 Wks Rel to S&P -2.40% Expert Opinions Expert Opinions Earnings Estimate Revisions Very Bullish Short Interest Expert opinions about AES are very positive. Shorting of AES is low and insiders are net buyers of AES's stock. Insider Activity The rank for AES is based on analysts revising earnings estimates upward, a low short interest ratio, insiders purchasing stock, optimistic analyst opinions and Analyst Opinions price strength of the stock versus the Utility-Elec Pwr industry group. Relative Strength vs Industry Earnings Estimate Revisions Analyst Recommendations EPS Estimates Revision Summary Current 7 Days Ago % Change Factor Value Last Week Last 4 Weeks Current Qtr 0.25 0.25 0.00% Mean this Week Strong Buy Up Down Up Down Next Qtr 0.28 0.28 0.00% Mean Last Week Strong Buy Curr Qtr 0 0 0 0 Curr Yr 0 0 0 0 Current 30 Days Ago % Change Change 0.00 Next Qtr 0 0 0 0 Current FY 0.99 1.03 -0.04 Mean 5 Weeks Ago Strong Buy Next Yr 0 0 0 0 I want to receive special offers about trading stocks with your brokerage partner, optionsXpress. Click here www.chaikinpowertools.com
- 4. The Company & Its Competitors AES's Competitors in Utility-Elec Pwr News Headlines for AES Company Power Historic EPS Projected EPS Profit Margin PEG PE Revenue(M) DPL Inc. Announces Pro Rated Dividend In Gauge growth growth Anticipation of Completing The Pending Merger AES 9.09% 8.00% -0.96% 1.47 12.06 16,647 with Dolphin Sub, Inc., a Wholly-owned Subsidiary of The AES Corporation - Nov 8, EXC 4.39% 0.00% 12.42% - 10.16 18,644 2011 KEP 9.63% - - - - 34,872 BRIEF: DPL shareholders approve buyout by AES - Sep 23, 2011 NGG 8.44% 4.37% - 2.83 - 23,242 DPL urges merger approval - Sep 13, 2011 DPL jobs to stay after merger - Sep 3, 2011 DPL jobs to stay after merger - Sep 3, 2011 Company Details Company Profile AES CORP AES Corporation and its subsidiaries and affiliates are a global power company 4300 WILSON BOULEVARD committed to serving the world's needs for electricity in a socially responsible way. AES's ARLINGTON, VA 22203 electricity generation business consists of sales to wholesale customers for further resale USA to end users. AES also sells electricity directly to end users such as commercial, Phone: 7035221315 industrial, governmental and residential customers through its distribution business. Fax: 703-528-4510 Website: http://http://www.aes.com Full Time Employees: 29,000 Sector: Utilities Power Gauge Ratings are created using a relative ranking system that assigns a rank of 0 to 100 (100 being the highest) to each stock in the universe. Rank is calculated by evaluating each of the stocks factors and combining them into a single number using a weighting formula. A stock's rank ranges from 100-0, where 100 is the strongest, and a rank of 95 indicates the stock is better than 95% of the stocks in the universe. Chaikin Stock Research(CSR) is not registered as a securities broker dealer or investment advisor with either the U.S. Securities and Exchange Commission or with any state securities regulatory authority. CSR is not responsible for trades executed by users of this research report, our web site or mobile app based on the information included herein. The information presented in this report does not represent a recommendation to buy or sell stocks or any financial instrument nor is it intended as an endorsement of any security or investment. The information in this report is generic by nature and is not personalized to the specific financial situation of any individual. The user bears complete responsibility for their own investment research and should seek the advice of a qualified investment professional before making any investment decisions. Copyright (c) 1978-(Present) by ZACKS Investment Research, Inc ("ZACKS"). The information, data, analyses and opinions contained herein (1) includes the confidential and proprietary information of ZACKS, (2) may not be copied or redistributed, for any purpose, (3) does not constitute investment advice offered by ZACKS, (4) are provided solely for informational purposes, and (5) are not warranted or represented to be correct, complete, accurate or timely. ZACKS shall not be responsible for investment decisions, damages or other losses resulting from, or related to, use of this information, data, analyses or opinions. Past performance is no guarantee of future performance. ZACKS is not affiliated with Chaikin Power Tools. This report from Chaikin Power Tools is for informational purposes only and is not a recommendation to buy or sell securities. LM 2.3 DS 3.0 LS 2.1 Data Provided by ZACKS Investment Research, Inc., www.zacks.com Special offers to trade stocks from optionsXpress: www.chaikinpowertools.com