China Port Throughput Figures (August 2007)
•
0 recomendaciones•406 vistas

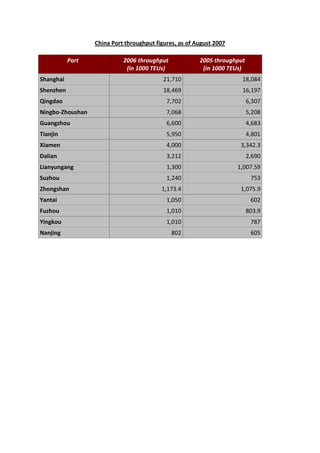
TEU throughput figures for China's major ports as of August 2007.

Recomendados
Más contenido relacionado
Más de China Intelligence Online
Más de China Intelligence Online (17)
Último
Último (20)
China Port Throughput Figures (August 2007)
- 1. China Port throughput figures, as of August 2007 Port2006 throughput (in 1000 TEUs)2005 throughput (in 1000 TEUs)Shanghai21,71018,084Shenzhen18,46916,197Qingdao7,7026,307Ningbo-Zhoushan7,0685,208Guangzhou6,6004,683Tianjin5,9504,801Xiamen4,0003,342.3Dalian3,2122,690Lianyungang1,3001,007.59Suzhou1,240753Zhongshan1,173.41,075.9Yantai1,050602Fuzhou1,010803.9Yingkou1,010787Nanjing802605 Top Ten Ports’ Container Throughput, March and January to March, 2007 PortMar. 2007(in 1000 TEUs)Jan. to Mar. 2007(in 1000 TEUs)% increase over Jan. to Mar previous yearShanghai2,0255,882.428Shenzhen1,196.84,262.98.2Qingdao783.82,196.526.5Ningbo-Zhoushan708.82,084.344Guangzhou649.61,989.536Tianjin560.61,565.327.6Xiamen3491,039.716.9Dalian25377518.3Liangyungang13539027.6Suzhou37050.4 Top Ten Ports’ Container Throughput of May and January – May, 2007 PortMay, 2007 (in 1000 TEUs)Jan. to May, 2007 (in 1000 TEUs)% increase over Jan. to May previous yearShanghai1,822.08,196.016.90Shenzhen1,410.06,795.711.10Qingdao632.12,992.519.58Ningbo-Zhoushan584.12,619.638.20Guangzhou506.02,519.149.80Tianjin520.02,254.021.73Xiamen311.31,527.715.40Dalian264.01,176.317.08Liangyungang100.0502.473.20Yingkou84.0421.026.50 In 2006 TEU throughput figures for the entire country reached 93,610,000 TEUs, an increase of 23.8% over 2005. Of this figure coastal ports accounted for 85,790,000TEUs, an increase of 22.5%, IWW accounted for 7,820,000 an increase of 39.1% over the previous year. Between 2005 and 2006 the number of ports with a throughput volume exceeding 1mn TEUs rose from 9 to 14. Namely Shanghai, Shenzhen, Qingdao, Ningbo, Tianjin, Guangzhou, Xiamen, Dalian, Zhongshan and Lianyungang, Suzhou, Yantai, Fuzhou and Yingkou.