SlideShare a Scribd company logo
1 of 43
Download to read offline
A. L. WAGNER APPRAISAL GROUP PRESENTS
                                        The Chicagoland Monthly Housing Market Pulse
                                          Attached Properties - August 1, 2011 Report
                                     The monthly analysis of inventory levels by price range
 Sponsored by:
 Alvin "Chip" Wagner III, SRA, SCRP
 A. L. Wagner Appraisal Group, Inc.                                                Specializing in Relocation, Litigation & Lending Appraisals
 1807 Washington Street, Suite 110, Naperville, IL 60565                         Serving the Chicagoland Area since 1970
 (630) 416-6556 ~ www.wagnerappraisal.com ~ chip@rac.net                         Offices in Naperville, Plainfield, Chicago, Flossmoor
                                     as of June 1, 2011                         as of July 1, 2011                       as of August 1, 2011
                                # Actives   DOM      Months Supply     # Actives     DOM       Months Supply   # Actives   DOM      Months Supply
 Addison - 101
 $         0 $ 199,999             85       246           15.94           77         263           13.20          70       262           10.91
 $ 200,000 $ 349,999               26       311           39.00           24         295           48.00          21       394           36.00
 $ 350,000 $ 499,999                0        0             0.00            0          0             0.00           0        0             0.00
 $ 500,000 $ 749,999                0        0             0.00            0          0             0.00           0        0             0.00
 $ 750,000 $ 999,999                0        0             0.00            0          0             0.00           0        0             0.00
 $ 1,000,000 $ 1,499,999           0         0             0.00            0          0             0.00           0        0             0.00
 $ 1,500,000 and up                0         0             0.00            0          0             0.00           0        0             0.00
           ALL                    111       261           18.25          101         270           15.74          91       293           12.85

 Algonquin - 102
 $         0 $ 199,999             80       223           12.80           79         237           13.17          75       227           12.68
 $ 200,000 $ 349,999               18       261           24.00           17         239           25.50          17       256           25.50
 $ 350,000 $ 499,999                0        0             0.00            0          0             0.00           0        0             0.00
 $ 500,000 $ 749,999                0        0             0.00            0          0             0.00           0        0             0.00
 $ 750,000 $ 999,999                0        0             0.00            0          0             0.00           0        0             0.00
 $ 1,000,000 $ 1,499,999            0        0             0.00            0          0             0.00           0        0             0.00
 $ 1,500,000 and up                 0        0             0.00            0          0             0.00           0        0             0.00
           ALL                     98       230           14.00           96         237           14.40          92       233           13.97

 Antioch - 2
 $         0 $ 199,999             12       246            8.47           11         265            9.43          10       309           8.57
 $ 200,000 $ 349,999                4       242            8.00            3         158            6.00           3       189            5.14
 $ 350,000 $ 499,999                2       267           24.00            1         468           12.00           1       499           12.00
 $ 500,000 $ 749,999                0        0             0.00            0          0             0.00           0        0             0.00
 $ 750,000 $ 999,999                0        0             0.00            0          0             0.00           0        0             0.00
 $ 1,000,000 $ 1,499,999            0        0            0.00             0          0             0.00           0        0             0.00
 $ 1,500,000 and up                 0        0            0.00             0          0             0.00           0        0             0.00
           ALL                     18       248           9.00            15         257           8.57           14       297           7.64

Data Source: MRED LLC                             (C) Copyright 2011, A.L. Wagner Appraisal Group, Inc.
Midwest Real Estate Data, LLC                        www.WagnerAppraisal.com ~ (630) 416-6556                                                    Page 1
as of June 1, 2011                      as of July 1, 2011                     as of August 1, 2011
                                # Actives   DOM      Months Supply     # Actives     DOM       Months Supply   # Actives    DOM     Months Supply


 Arlington Heights - 5
 $         0 $ 199,999            216       262           8.85           215         266           8.81          225        269         8.79
 $ 200,000 $ 349,999               85       200           8.03            82         182           7.87           68        198         6.58
 $ 350,000 $ 499,999                5       511          10.00             5         469          10.00            6        388        24.00
 $ 500,000 $ 749,999                6       130          14.40             6         107          14.40            4        164        12.00
 $ 750,000 $ 999,999                1       493         No Sales           1         523         No Sales          1        554       No Sales
 $ 1,000,000 $ 1,499,999           0         0            0.00             0          0            0.00            0         0          0.00
 $ 1,500,000 and up                0         0            0.00             0          0            0.00            0         0          0.00
           ALL                    313       248           8.71           309         245           8.64          304        255         8.33

 Aurora - 507
 $         0 $ 199,999            401       198            9.80          399         207            9.69         386        205         9.05
 $ 200,000 $ 349,999               43       356           11.47           42         351           12.00          41        379         12.30
 $ 350,000 $ 499,999               11       377          132.00           11         364          132.00          11        353        132.00
 $ 500,000 $ 749,999                1       125         No Sales           1         155         No Sales          1        186       No Sales
 $ 750,000 $ 999,999                0        0             0.00            0          0             0.00           0         0           0.00
 $ 1,000,000 $ 1,499,999           0         0            0.00             0          0             0.00           0         0           0.00
 $ 1,500,000 and up                0         0            0.00             0          0             0.00           0         0           0.00
           ALL                    456       217          10.19           453         224          10.12          439        225         9.53

 Barrington Area - 10
 $         0 $ 199,999             35       205           12.35           32         243           12.00          32        248        13.24
 $ 200,000 $ 349,999               56       232           21.68           57         210           25.33          56        226        28.00
 $ 350,000 $ 499,999               23       131           23.00           26         141           31.20          23        163        23.00
 $ 500,000 $ 749,999                3       370           12.00            2         432            8.00           4        238        16.00
 $ 750,000 $ 999,999                0        0             0.00            0          0             0.00           0         0          0.00
 $ 1,000,000 $ 1,499,999           0         0             0.00            0          0             0.00           0         0          0.00
 $ 1,500,000 and up                0         0             0.00            0          0             0.00           0         0          0.00
           ALL                    117       208           17.55          117         207           19.50         115        220        20.29

 Bartlett - 104
 $         0 $ 199,999             87       245          10.88            89         239          11.61           94        235        12.13
 $ 200,000 $ 349,999               35       196          32.31            30         180          27.69           29        121        34.80
 $ 350,000 $ 499,999                2       182         No Sales           2         212         No Sales          1        188        12.00
 $ 500,000 $ 749,999                0        0            0.00             0          0            0.00            0         0          0.00
 $ 750,000 $ 999,999                0        0            0.00             0          0            0.00            0         0          0.00
 $ 1,000,000 $ 1,499,999           0         0            0.00             0          0            0.00            0         0          0.00
 $ 1,500,000 and up                0         0            0.00             0          0            0.00            0         0          0.00
            ALL                   124       230          13.53           121         224          13.70          124        208        14.17


Data Source: MRED LLC                             (C) Copyright 2011, A.L. Wagner Appraisal Group, Inc.
Midwest Real Estate Data, LLC                        www.WagnerAppraisal.com ~ (630) 416-6556                                                  Page 2
as of June 1, 2011                        as of July 1, 2011                     as of August 1, 2011
                                # Actives   DOM        Months Supply     # Actives     DOM       Months Supply   # Actives    DOM     Months Supply
 Batavia - 510
 $         0 $ 199,999             27        198           16.20            26         225          15.60           27        226        17.05
 $ 200,000 $ 349,999               12        296           18.00            16         222          21.33           14        238        16.80
 $ 350,000 $ 499,999                6       1,197         No Sales           1         193         No Sales          1        224       No Sales
 $ 500,000 $ 749,999                1        847          No Sales           0          0            0.00            0         0          0.00
 $ 750,000 $ 999,999                0         0             0.00             0          0            0.00            0         0          0.00
 $ 1,000,000 $ 1,499,999            0         0             0.00             0          0            0.00            0         0          0.00
 $ 1,500,000 and up                 0         0             0.00             0          0            0.00            0         0          0.00
           ALL                     46        368           19.71            43         223          17.79           42        230        17.38

 Bensenville - 106
 $         0 $ 199,999             33       355             13.66           28         333          10.50           31        323        12.40
 $ 200,000 $ 349,999                2       219             12.00           2          249         No Sales          2        280       No Sales
 $ 350,000 $ 499,999                0        0               0.00            0          0            0.00            0         0          0.00
 $ 500,000 $ 749,999                0        0               0.00            0          0            0.00            0         0          0.00
 $ 750,000 $ 999,999                0        0               0.00            0          0            0.00            0         0          0.00
 $ 1,000,000 $ 1,499,999            0        0               0.00            0          0            0.00            0         0          0.00
 $ 1,500,000 and up                 0        0               0.00            0          0            0.00            0         0          0.00
           ALL                     35       347             13.55           30         328          11.25           33        321        13.20

       y
 Berwyn - 402
 $         0 $ 199,999             51       282             15.30           46         265           12.55          47        291        12.82
 $ 200,000 $ 349,999                2       341             24.00           6          138           72.00          5         129       No Sales
 $ 350,000 $ 499,999                0        0               0.00            0          0             0.00           0         0          0.00
 $ 500,000 $ 749,999                0        0               0.00            0          0             0.00           0         0          0.00
 $ 750,000 $ 999,999                0        0               0.00            0          0             0.00           0         0          0.00
 $ 1,000,000 $ 1,499,999            0        0               0.00            0          0             0.00           0         0          0.00
 $ 1,500,000 and up                 0        0               0.00            0          0             0.00           0         0          0.00
           ALL                     53       284             15.51           52         250           13.87          52        275        14.18

 Bloomingdale - 108
 $         0 $ 199,999             96       284            14.96            89         298          13.87           87        290        13.22
 $ 200,000 $ 349,999               53       215            14.45            48         209          13.71           46        232        12.00
 $ 350,000 $ 499,999                9       308            21.60             9         283          21.60           7         354        16.80
 $ 500,000 $ 749,999                3       172           No Sales           2         256         No Sales          2        287       No Sales
 $ 750,000 $ 999,999                0        0              0.00             0          0            0.00            0         0          0.00
 $ 1,000,000 $ 1,499,999           0         0              0.00             0          0            0.00            0         0          0.00
 $ 1,500,000 and up                0         0              0.00             0          0            0.00            0         0          0.00
           ALL                    161       260            15.33           148         268          14.32          142        274        13.11


Data Source: MRED LLC                               (C) Copyright 2011, A.L. Wagner Appraisal Group, Inc.
Midwest Real Estate Data, LLC                          www.WagnerAppraisal.com ~ (630) 416-6556                                                 Page 3
as of June 1, 2011                      as of July 1, 2011                     as of August 1, 2011
                                # Actives   DOM      Months Supply     # Actives     DOM       Months Supply   # Actives    DOM     Months Supply
 Bolingbrook - 440
 $         0 $ 199,999            112       211           7.72           111         190           7.84          107        189        7.47
 $ 200,000 $ 349,999               10       327           13.33           10         319           13.33          12        295        18.00
 $ 350,000 $ 499,999                1       303           12.00            1         333           12.00          1         364        12.00
 $ 500,000 $ 749,999                0        0             0.00            0          0             0.00           0         0          0.00
 $ 750,000 $ 999,999                0        0             0.00            0          0             0.00           0         0          0.00
 $ 1,000,000 $ 1,499,999           0         0            0.00             0          0             0.00           0         0          0.00
 $ 1,500,000 and up                0         0            0.00             0          0             0.00           0         0          0.00
           ALL                    123       221           8.02           122         202           8.13          120        201        7.96

 Brookfield - 513
 $         0 $ 199,999             20       277           21.82           23         278           27.60          19        273        17.54
 $ 200,000 $ 349,999                5       218            2.86            5         248            4.00           5        279         4.62
 $ 350,000 $ 499,999                0        0             0.00            0          0             0.00           0         0          0.00
 $ 500,000 $ 749,999                0        0             0.00            0          0             0.00           0         0          0.00
 $ 750,000 $ 999,999                0        0             0.00            0          0             0.00           0         0          0.00
 $ 1,000,000 $ 1,499,999            0        0            0.00             0          0             0.00           0         0          0.00
 $ 1,500,000 and up                 0        0            0.00             0          0             0.00           0         0          0.00
           ALL                     25       265           9.38            28         272           13.44          24        274        11.08

 Buffalo Grove - 89
 $         0 $ 199,999            146       240            8.72          155         234            9.64         158        224         9.53
 $ 200,000 $ 349,999               60       216           12.63           57         196           13.15          66        206        16.85
 $ 350,000 $ 499,999               13       127           19.50           12         146           16.00          10        168        10.00
 $ 500,000 $ 749,999                0        0             0.00            0          0             0.00           0         0          0.00
 $ 750,000 $ 999,999                0        0             0.00            0          0             0.00           0         0          0.00
 $ 1,000,000 $ 1,499,999           0         0            0.00             0          0             0.00           0         0          0.00
 $ 1,500,000 and up                0         0            0.00             0          0             0.00           0         0          0.00
           ALL                    219       227           9.88           224         220           10.58         234        216        10.88

 Burr Ridge - 522
 $         0 $ 199,999             12       231          14.40            10         271           13.33          11        263         13.20
 $ 200,000 $ 349,999               20       199           9.23            21         187           10.50          22        189         12.00
 $ 350,000 $ 499,999               16       362          32.00            16         352           38.40          16        378         38.40
 $ 500,000 $ 749,999               10       511          30.00            13         419          156.00          12        423        144.00
 $ 750,000 $ 999,999                1        45         No Sales           1          75         No Sales          1        106       No Sales
 $ 1,000,000 $ 1,499,999            0        0            0.00             0          0             0.00           0         0           0.00
 $ 1,500,000 and up                 0        0            0.00             0          0             0.00           0         0           0.00
           ALL                     59       300          15.39            61         292          18.77           62        295        19.58


Data Source: MRED LLC                             (C) Copyright 2011, A.L. Wagner Appraisal Group, Inc.
Midwest Real Estate Data, LLC                        www.WagnerAppraisal.com ~ (630) 416-6556                                                  Page 4
as of June 1, 2011                      as of July 1, 2011                     as of August 1, 2011
                                # Actives   DOM      Months Supply     # Actives     DOM       Months Supply   # Actives    DOM     Months Supply
 Carol Stream - 188
 $         0 $ 199,999             95       261            8.38          101         259           9.04           96        280         8.86
 $ 200,000 $ 349,999               22       251           17.60           20         238          15.00           16        227        11.29
 $ 350,000 $ 499,999                0        0             0.00           1          531         No Sales          1        562       No Sales
 $ 500,000 $ 749,999                0        0             0.00            0          0            0.00            0         0          0.00
 $ 750,000 $ 999,999                0        0             0.00            0          0            0.00            0         0          0.00
 $ 1,000,000 $ 1,499,999           0         0            0.00             0          0            0.00            0         0          0.00
 $ 1,500,000 and up                0         0            0.00             0          0            0.00            0         0          0.00
           ALL                    117       259           9.30           122         258           9.76          113        275         9.22

 Carpentersville, Lake Marion - 110
 $         0 $ 199,999    107       214                   11.57          102         213          10.55           95        222         9.66
 $ 200,000 $ 349,999       0         0                     0.00           1          16          No Sales          1         47       No Sales
 $ 350,000 $ 499,999       0         0                     0.00           0           0            0.00            0         0          0.00
 $ 500,000 $ 749,999       0         0                     0.00           0           0            0.00            0         0          0.00
 $ 750,000 $ 999,999       0         0                     0.00           0           0            0.00            0         0          0.00
 $ 1,000,000 $ 1,499,999   0         0                     0.00           0           0            0.00            0         0          0.00
 $ 1,500,000 and up        0         0                     0.00           0           0            0.00            0         0          0.00
           ALL            107       214                   11.57          103         211          10.66           96        220         9.76

     y,
 Cary, Oakwood Hills - 13
 $         0 $ 199,999    46                189           12.84           48         176           15.57          44        213        13.89
 $ 200,000 $ 349,999       2                167            8.00            2         197           24.00           1         82        12.00
 $ 350,000 $ 499,999       0                 0             0.00            0          0             0.00           0          0         0.00
 $ 500,000 $ 749,999       0                 0             0.00            0          0             0.00           0          0         0.00
 $ 750,000 $ 999,999       0                 0             0.00            0          0             0.00           0          0         0.00
 $ 1,000,000 $ 1,499,999   0                 0             0.00            0          0             0.00           0          0         0.00
 $ 1,500,000 and up        0                 0             0.00            0          0             0.00           0          0         0.00
           ALL            48                188           12.52           50         176           15.79          45        210        13.85

 Cicero - 650
 $         0 $ 199,999             11       261           4.40            10         267            4.44          11        290         4.55
 $ 200,000 $ 349,999                0        0            0.00             0          0             0.00           0         0          0.00
 $ 350,000 $ 499,999                0        0            0.00             0          0             0.00           0         0          0.00
 $ 500,000 $ 749,999                0        0            0.00             0          0             0.00           0         0          0.00
 $ 750,000 $ 999,999                0        0            0.00             0          0             0.00           0         0          0.00
 $ 1,000,000 $ 1,499,999            0        0            0.00             0          0             0.00           0         0          0.00
 $ 1,500,000 and up                 0        0            0.00             0          0             0.00           0         0          0.00
           ALL                     11       261           4.40            10         267            4.44          11        290         4.55


Data Source: MRED LLC                             (C) Copyright 2011, A.L. Wagner Appraisal Group, Inc.
Midwest Real Estate Data, LLC                        www.WagnerAppraisal.com ~ (630) 416-6556                                                  Page 5
as of June 1, 2011                      as of July 1, 2011                     as of August 1, 2011
                                # Actives   DOM      Months Supply     # Actives     DOM       Months Supply   # Actives    DOM     Months Supply
 Clarendon Hills - 514
 $         0 $ 199,999             14       256           9.88            16         251          12.00           18        252        15.43
 $ 200,000 $ 349,999               14       355          28.00            14         357          28.00           12        433        24.00
 $ 350,000 $ 499,999                4       221           9.60             5         201          15.00            4        183        16.00
 $ 500,000 $ 749,999                0        0            0.00             0          0            0.00            0         0          0.00
 $ 750,000 $ 999,999                0        0            0.00             0          0            0.00            0         0          0.00
 $ 1,000,000 $ 1,499,999            0        0            0.00             0          0            0.00            0         0          0.00
 $ 1,500,000 and up                 1       915         No Sales           1         945         No Sales          1        975       No Sales
           ALL                     33       313          14.14            36         305          16.62           35        327        18.26

 Countryside - 527
 $         0 $ 199,999             32       340          19.20            32         347          16.70           30        379        13.33
 $ 200,000 $ 349,999                2       273          24.00             2         303          24.00            2        334        24.00
 $ 350,000 $ 499,999                2       351         No Sales           2         381         No Sales          2        412       No Sales
 $ 500,000 $ 749,999                0        0            0.00            0           0            0.00           1         26        No Sales
 $ 750,000 $ 999,999                0        0            0.00             0          0            0.00            0         0          0.00
 $ 1,000,000 $ 1,499,999            0        0            0.00             0          0            0.00            0         0          0.00
 $ 1,500,000 and up                 0        0            0.00             0          0            0.00            0         0          0.00
           ALL                     36       337          20.57            36         346          18.00           35        368        15.00

 Crest Hill - 498
 $         0 $ 199,999            107       246          14.43           111         247          15.67          110        259        16.30
 $ 200,000 $ 349,999               2         33         No Sales          3           45         No Sales         3          72       No Sales
 $ 350,000 $ 499,999               0          0           0.00            0           0            0.00           0          0          0.00
 $ 500,000 $ 749,999               0          0           0.00            0           0            0.00           0          0          0.00
 $ 750,000 $ 999,999               0          0           0.00            0           0            0.00           0          0          0.00
 $ 1,000,000 $ 1,499,999           0         0            0.00            0           0            0.00           0          0          0.00
 $ 1,500,000 and up                0         0            0.00            0           0            0.00           0          0          0.00
           ALL                    109       242          14.70           114         241          16.09          113        254        16.74

 Crystal Lake, Lakewood,          Prairie Grove - 14
 $         0 $ 199,999            122       268          13.56           122         269          13.81          128        277        14.22
 $ 200,000 $ 349,999               14       320          28.00            15         308          60.00           15        357        60.00
 $ 350,000 $ 499,999                2       264         No Sales           2         294         No Sales          1        179       No Sales
 $ 500,000 $ 749,999                0        0            0.00             0          0            0.00            0         0          0.00
 $ 750,000 $ 999,999                0        0            0.00             0          0            0.00            0         0          0.00
 $ 1,000,000 $ 1,499,999           0         0            0.00             0          0            0.00            0         0          0.00
 $ 1,500,000 and up                0         0            0.00             0          0            0.00            0         0          0.00
           ALL                    138       273          14.53           139         274          15.30          144        284        15.57


Data Source: MRED LLC                             (C) Copyright 2011, A.L. Wagner Appraisal Group, Inc.
Midwest Real Estate Data, LLC                        www.WagnerAppraisal.com ~ (630) 416-6556                                                 Page 6
as of June 1, 2011                      as of July 1, 2011                     as of August 1, 2011
                                # Actives   DOM      Months Supply     # Actives     DOM       Months Supply   # Actives    DOM     Months Supply
 Darien - 562
 $         0 $ 199,999             71       251           21.30           75         240          21.95           72        245        19.20
 $ 200,000 $ 349,999               38       213           21.71           42         206          25.20           46        214        26.29
 $ 350,000 $ 499,999               13       240          156.00          11          244         No Sales         10        268       No Sales
 $ 500,000 $ 749,999                0        0             0.00            0          0            0.00            0         0          0.00
 $ 750,000 $ 999,999                0        0             0.00            0          0            0.00            0         0          0.00
 $ 1,000,000 $ 1,499,999            0        0             0.00            0          0            0.00            0         0          0.00
 $ 1,500,000 and up                 0        0             0.00            0          0            0.00            0         0          0.00
           ALL                    122       238           23.61          128         229          25.18          128        236        23.27

 Deerfield - 15
 $         0 $ 199,999             40       283          15.48            37         251          11.68           38        247        11.69
 $ 200,000 $ 349,999               24       186           9.29            23         188           8.63           24        148         9.29
 $ 350,000 $ 499,999                9       221          15.43             8         154          10.67            8        220         9.60
 $ 500,000 $ 749,999                1       212         No Sales           1         242         No Sales          0         0          0.00
 $ 750,000 $ 999,999                0        0            0.00             0          0            0.00            0         0          0.00
 $ 1,000,000 $ 1,499,999            0        0            0.00             0          0            0.00            0         0          0.00
 $ 1,500,000 and up                 0        0            0.00             0          0            0.00            0         0          0.00
           ALL                     74       243          12.87            69         218          10.48           70        210        10.37

 Des Plaines - 16
 $         0 $ 199,999            378       299          10.10           374         283           9.84          381        282         9.61
 $ 200,000 $ 349,999               74       230          20.18            74         256          21.66           70        260        21.54
 $ 350,000 $ 499,999                3       312         No Sales           4         481         No Sales          5        414       No Sales
 $ 500,000 $ 749,999                0        0            0.00             0          0            0.00            0         0          0.00
 $ 750,000 $ 999,999                0        0            0.00             0          0            0.00            0         0          0.00
 $ 1,000,000 $ 1,499,999           0         0            0.00             0          0            0.00            0         0          0.00
 $ 1,500,000 and up                0         0            0.00             0          0            0.00            0         0          0.00
           ALL                    455       288          11.08           452         280          10.91          456        280        10.63

 Downers Grove - 515
 $         0 $ 199,999            173       345          18.21           184         354          19.20          177        371        18.31
 $ 200,000 $ 349,999               47       479          15.67            41         530          14.47           40        519        13.71
 $ 350,000 $ 499,999               25       573          21.43            26         564          26.00           24        618        26.18
 $ 500,000 $ 749,999               13       470          39.00            13         500          31.20           13        531        31.20
 $ 750,000 $ 999,999                2        65         No Sales           2          95         No Sales          2        126       No Sales
 $ 1,000,000 $ 1,499,999           0         0            0.00             0          0            0.00            0         0          0.00
 $ 1,500,000 and up                0          0           0.00             0          0            0.00            0         0          0.00
           ALL                    260       395          18.57           266         407          19.23          256        424        18.40


Data Source: MRED LLC                             (C) Copyright 2011, A.L. Wagner Appraisal Group, Inc.
Midwest Real Estate Data, LLC                        www.WagnerAppraisal.com ~ (630) 416-6556                                                  Page 7
as of June 1, 2011                      as of July 1, 2011                     as of August 1, 2011
                                # Actives   DOM      Months Supply     # Actives     DOM       Months Supply   # Actives    DOM     Months Supply
 Dundee, East & West Dundee, Sleepy Hollow              - 118
 $         0 $ 199,999   24      286                      11.52           18         296           8.00           21        255        9.00
 $ 200,000 $ 349,999      2      427                      12.00            2         457           24.00           2        488        24.00
 $ 350,000 $ 499,999      0       0                        0.00            0          0             0.00           0         0          0.00
 $ 500,000 $ 749,999      0       0                        0.00            0          0             0.00           0         0          0.00
 $ 750,000 $ 999,999      0       0                        0.00            0          0             0.00           0         0          0.00
 $ 1,000,000 $ 1,499,999  0       0                        0.00            0          0             0.00           0         0          0.00
 $ 1,500,000 and up       0       0                        0.00            0          0             0.00           0         0          0.00
           ALL           26      297                      11.56           20         312           8.57           23        275        9.52

 Elgin - 123
 $         0 $ 199,999            247       228          10.82           250         232          10.95          259        226        11.10
 $ 200,000 $ 349,999               24       422          12.52            24         428          16.00           25        381        18.75
 $ 350,000 $ 499,999                1       576         No Sales           1         606         No Sales          1        637       No Sales
 $ 500,000 $ 749,999                0        0            0.00             0          0            0.00            0         0          0.00
 $ 750,000 $ 999,999                0        0            0.00             0          0            0.00            0         0          0.00
 $ 1,000,000 $ 1,499,999           0         0            0.00            0           0            0.00           1         140       No Sales
 $ 1,500,000 and up                0         0            0.00             0          0            0.00            0         0          0.00
           ALL                    272       247          10.99           275         250          11.30          286        241        11.59

                 g
 Elk Grove Village - 7
 $         0 $ 199,999            151       265           12.24          143         279           11.59         141        288        11.21
 $ 200,000 $ 349,999               28       242           28.00           24         197           32.00          28        147        42.00
 $ 350,000 $ 499,999                0        0             0.00            0          0             0.00           0         0          0.00
 $ 500,000 $ 749,999                0        0             0.00            0          0             0.00           0         0          0.00
 $ 750,000 $ 999,999                0        0             0.00            0          0             0.00           0         0          0.00
 $ 1,000,000 $ 1,499,999           0         0             0.00            0          0             0.00           0         0          0.00
 $ 1,500,000 and up                0         0             0.00            0          0             0.00           0         0          0.00
           ALL                    179       261           13.43          167         267           12.76         169        265        12.75

 Elmhurst - 126
 $         0 $ 199,999             52       341           26.00           50         342           24.00          52        347        24.96
 $ 200,000 $ 349,999               18       277            9.00           17         285           10.74          17        326        10.74
 $ 350,000 $ 499,999                7       156           12.00            6         168            9.00           4        176         5.33
 $ 500,000 $ 749,999                3        55           12.00            6          53           24.00           7         75        28.00
 $ 750,000 $ 999,999                0         0            0.00            0           0            0.00           0          0         0.00
 $ 1,000,000 $ 1,499,999            0        0             0.00            0           0            0.00           0          0         0.00
 $ 1,500,000 and up                 0        0             0.00            0           0            0.00           0          0         0.00
           ALL                     80       300           16.55           79         295           17.24          80        311        17.14


Data Source: MRED LLC                             (C) Copyright 2011, A.L. Wagner Appraisal Group, Inc.
Midwest Real Estate Data, LLC                        www.WagnerAppraisal.com ~ (630) 416-6556                                                  Page 8
as of June 1, 2011                      as of July 1, 2011                     as of August 1, 2011
                                # Actives   DOM      Months Supply     # Actives     DOM       Months Supply   # Actives    DOM     Months Supply
 Elmwood Park - 635
 $         0 $ 199,999             92       311           12.55           80         351           10.11          76        343         9.50
 $ 200,000 $ 349,999                6       328            9.00            6         358           12.00           5        366         8.57
 $ 350,000 $ 499,999                0        0             0.00            0          0             0.00           0         0          0.00
 $ 500,000 $ 749,999                0        0             0.00            0          0             0.00           0         0          0.00
 $ 750,000 $ 999,999                0        0             0.00            0          0             0.00           0         0          0.00
 $ 1,000,000 $ 1,499,999            0        0             0.00            0          0             0.00           0         0          0.00
 $ 1,500,000 and up                 0        0             0.00            0          0             0.00           0         0          0.00
           ALL                     98       312           12.25           86         351           10.22          81        345         9.44

 Evanston - 201
 $         0 $ 199,999            214       264           14.43          213         266           14.12         212        260        12.98
 $ 200,000 $ 349,999              181       184           12.48          169         185           12.52         165        194        12.61
 $ 350,000 $ 499,999               45       183            9.00           37         227            8.71          43        181        10.75
 $ 500,000 $ 749,999               27       186           11.17           30         186           14.40          21        212         8.69
 $ 750,000 $ 999,999               10       228           24.00            9         277           27.00           9        308        27.00
 $ 1,000,000 $ 1,499,999           2        234            8.00           2          264            8.00          2         295        24.00
 $ 1,500,000 and up                0         0             0.00            0          0             0.00           0         0          0.00
           ALL                    479       221           12.80          460         228           12.96         452        227        12.47

 Flossmoor - 422
 $         0 $ 199,999             31       357           14.31           28         349          14.61           32        318        16.00
 $ 200,000 $ 349,999                2       298           24.00           2          328         No Sales          1        655       No Sales
 $ 350,000 $ 499,999                0        0             0.00            0          0            0.00            0         0          0.00
 $ 500,000 $ 749,999                0        0             0.00            0          0            0.00            0         0          0.00
 $ 750,000 $ 999,999                0        0             0.00            0          0            0.00            0         0          0.00
 $ 1,000,000 $ 1,499,999            0        0             0.00            0          0            0.00            0         0          0.00
 $ 1,500,000 and up                 0        0             0.00            0          0            0.00            0         0          0.00
           ALL                     33       354           14.67           30         348          15.65           33        328        16.50

 Fox Lake - 20
 $         0 $ 199,999             87       237           14.30           86         242           13.40          84        230        12.44
 $ 200,000 $ 349,999                7       166           84.00            5         163           60.00           3        113        36.00
 $ 350,000 $ 499,999                0        0             0.00            0          0             0.00           0         0          0.00
 $ 500,000 $ 749,999                0        0             0.00            0          0             0.00           0         0          0.00
 $ 750,000 $ 999,999                0        0             0.00            0          0             0.00           0         0          0.00
 $ 1,000,000 $ 1,499,999            0        0             0.00            0          0             0.00           0         0          0.00
 $ 1,500,000 and up                 0        0             0.00            0          0             0.00           0         0          0.00
           ALL                     94       232           15.24           91         238           14.00          87        226        12.73


Data Source: MRED LLC                             (C) Copyright 2011, A.L. Wagner Appraisal Group, Inc.
Midwest Real Estate Data, LLC                        www.WagnerAppraisal.com ~ (630) 416-6556                                                  Page 9
as of June 1, 2011                      as of July 1, 2011                     as of August 1, 2011
                                # Actives   DOM      Months Supply     # Actives     DOM       Months Supply   # Actives    DOM     Months Supply
 Frankfort, Green Garden - 423
 $         0 $ 199,999     39               233          22.29            35         250          17.50           32        279        16.00
 $ 200,000 $ 349,999       76               281          25.33            74         294          23.37           75        306        25.71
 $ 350,000 $ 499,999       10               263          40.00            10         319          24.00           10        326        30.00
 $ 500,000 $ 749,999        6               494         No Sales           3         602         No Sales          3        633       No Sales
 $ 750,000 $ 999,999        0                0            0.00             0          0            0.00            0         0          0.00
 $ 1,000,000 $ 1,499,999    0                0            0.00             0          0            0.00            0         0          0.00
 $ 1,500,000 and up         0                0            0.00             0          0            0.00            0         0          0.00
           ALL            131               275          26.20           122         291          21.85          120        308        22.86

 Geneva - 134
 $         0 $ 199,999             28       317           15.27           26         297           12.48          24        269        10.67
 $ 200,000 $ 349,999               44       299           18.86           48         261           22.15          46        249        19.03
 $ 350,000 $ 499,999                6       277           36.00            4         110           24.00           4        141        24.00
 $ 500,000 $ 749,999                1        93           12.00            1         123           12.00           0         0          0.00
 $ 750,000 $ 999,999                0         0            0.00            0          0             0.00           0         0          0.00
 $ 1,000,000 $ 1,499,999            0        0             0.00            0          0             0.00           0         0          0.00
 $ 1,500,000 and up                 0        0             0.00            0          0             0.00           0         0          0.00
           ALL                     79       301           17.89           79         264           17.56          74        249        15.05

 Gilberts - 136
 $         0 $ 199,999             47       155           11.75           45         153           11.02          42        154        10.96
 $ 200,000 $ 349,999                6       630            2.88            6         660            2.88           6        691         6.55
 $ 350,000 $ 499,999                0        0             0.00            0          0             0.00           0         0          0.00
 $ 500,000 $ 749,999                0        0             0.00            0          0             0.00           0         0          0.00
 $ 750,000 $ 999,999                0        0             0.00            0          0             0.00           0         0          0.00
 $ 1,000,000 $ 1,499,999            0        0            0.00             0          0             0.00           0         0          0.00
 $ 1,500,000 and up                 0        0            0.00             0          0             0.00           0         0          0.00
           ALL                     53       209           8.71            51         213           8.27           48        221        10.11

 Glen Ellyn - 137
 $         0 $ 199,999             84       321           15.51           82         320           14.69          76        330        13.82
 $ 200,000 $ 349,999               25       351           15.00           27         331           17.05          22        349        13.20
 $ 350,000 $ 499,999               13       120           19.50           14         112           28.00          11        152        16.50
 $ 500,000 $ 749,999                4       232            4.36            5         359            6.67           5        390         6.67
 $ 750,000 $ 999,999                1       721            4.00            0          0             0.00           0         0          0.00
 $ 1,000,000 $ 1,499,999           0         0             0.00            0          0             0.00           0         0          0.00
 $ 1,500,000 and up                0         0             0.00            0          0             0.00           0         0          0.00
           ALL                    127       306           14.24          128         301           14.77         114        319        12.91


Data Source: MRED LLC                             (C) Copyright 2011, A.L. Wagner Appraisal Group, Inc.
Midwest Real Estate Data, LLC                        www.WagnerAppraisal.com ~ (630) 416-6556                                                 Page 10
as of June 1, 2011                      as of July 1, 2011                     as of August 1, 2011
                                # Actives   DOM      Months Supply     # Actives     DOM       Months Supply   # Actives    DOM     Months Supply
 Glendale Heights - 139
 $         0 $ 199,999            140       194           6.80           147         193           7.35          145        201        7.28
 $ 200,000 $ 349,999               13       185          156.00           10         184           60.00          8         197        48.00
 $ 350,000 $ 499,999                0        0            0.00             0          0             0.00          0          0          0.00
 $ 500,000 $ 749,999                0        0            0.00             0          0             0.00          0          0          0.00
 $ 750,000 $ 999,999                0        0            0.00             0          0             0.00          0          0          0.00
 $ 1,000,000 $ 1,499,999           0         0            0.00             0          0             0.00          0          0          0.00
 $ 1,500,000 and up                0         0            0.00             0          0             0.00          0          0          0.00
           ALL                    153       194           7.40           157         192           7.79          153        201        7.62

 Glenview, Golf - 25
 $         0 $ 199,999             95       282          10.18            95         256           10.00          94        268        10.16
 $ 200,000 $ 349,999               49       223          13.67            50         266           13.64          47        257        11.75
 $ 350,000 $ 499,999               41       213          10.93            40         204           10.43          38        234        10.86
 $ 500,000 $ 749,999               18       142           9.82            14         191            7.00          12        213         6.26
 $ 750,000 $ 999,999                1        1          No Sales           1          31           12.00           1         62        12.00
 $ 1,000,000 $ 1,499,999           0         0            0.00             0          0             0.00           0         0          0.00
 $ 1,500,000 and up                0         0            0.00             0          0             0.00           0         0          0.00
           ALL                    204       240          11.03           200         242           10.48         192        254        10.24

 Glenwood - 425
 $         0 $ 199,999             30       211           21.18           28         243           16.00          24        256        11.08
 $ 200,000 $ 349,999                0        0             0.00            0          0             0.00           0         0          0.00
 $ 350,000 $ 499,999                0        0             0.00            0          0             0.00           0         0          0.00
 $ 500,000 $ 749,999                0        0             0.00            0          0             0.00           0         0          0.00
 $ 750,000 $ 999,999                0        0             0.00            0          0             0.00           0         0          0.00
 $ 1,000,000 $ 1,499,999            0        0             0.00            0          0             0.00           0         0          0.00
 $ 1,500,000 and up                 0        0             0.00            0          0             0.00           0         0          0.00
           ALL                     30       211           21.18           28         243           16.00          24        256        11.08

 Grayslake, Gages Lake, Hainesville, Third Lake, Wildwood                - 30
 $         0 $ 199,999   114       176        11.21                      110         176           11.79         104        184        10.06
 $ 200,000 $ 349,999      8        214        12.00                       14         144           18.67          17        147        29.14
 $ 350,000 $ 499,999      3        200        36.00                       2          97            24.00          1         53        No Sales
 $ 500,000 $ 749,999      0         0          0.00                        0          0             0.00           0         0          0.00
 $ 750,000 $ 999,999      0         0          0.00                        0          0             0.00           0         0          0.00
 $ 1,000,000 $ 1,499,999  0         0          0.00                        0          0             0.00           0         0          0.00
 $ 1,500,000 and up       0         0          0.00                        0          0             0.00           0         0          0.00
           ALL           125       179        11.45                      126         171           12.39         122        178        11.18


Data Source: MRED LLC                             (C) Copyright 2011, A.L. Wagner Appraisal Group, Inc.
Midwest Real Estate Data, LLC                        www.WagnerAppraisal.com ~ (630) 416-6556                                                 Page 11
as of June 1, 2011                      as of July 1, 2011                     as of August 1, 2011
                                # Actives   DOM      Months Supply     # Actives     DOM       Months Supply   # Actives    DOM     Months Supply
 Gurnee - 31
 $         0 $ 199,999            105       259           11.35          105         256           11.35         100        274        10.71
 $ 200,000 $ 349,999               16       213           27.43           12         230           18.00          13        236        39.00
 $ 350,000 $ 499,999                0        0             0.00            0          0             0.00           0         0          0.00
 $ 500,000 $ 749,999                0        0             0.00            0          0             0.00           0         0          0.00
 $ 750,000 $ 999,999                0        0             0.00            0          0             0.00           0         0          0.00
 $ 1,000,000 $ 1,499,999           0         0             0.00            0          0             0.00           0         0          0.00
 $ 1,500,000 and up                0         0             0.00            0          0             0.00           0         0          0.00
           ALL                    121       253           12.31          117         253           11.80         113        270        11.69

 Hanover Park - 103
 $         0 $ 199,999            145       197            8.70          142         193            8.78         140        193         8.94
 $ 200,000 $ 349,999               9        157           13.50           6          135            9.00          5         128         7.50
 $ 350,000 $ 499,999               0         0             0.00           0           0             0.00          0          0          0.00
 $ 500,000 $ 749,999               0         0             0.00           0           0             0.00          0          0          0.00
 $ 750,000 $ 999,999               0         0             0.00           0           0             0.00          0          0          0.00
 $ 1,000,000 $ 1,499,999           0         0            0.00            0           0             0.00          0          0          0.00
 $ 1,500,000 and up                0         0            0.00            0           0             0.00          0          0          0.00
           ALL                    154       194           8.88           148         191            8.79         145        191         8.88

   g
 Highland Park - 35
 $         0 $ 199,999             15       366           8.57            15         346          11.25           20        305        13.33
 $ 200,000 $ 349,999               34       321          18.55            30         317          18.00           29        354        17.40
 $ 350,000 $ 499,999               15       310          12.86            19         290          19.00           21        269        25.20
 $ 500,000 $ 749,999               16       304          17.45            14         327          14.00           15        299        13.85
 $ 750,000 $ 999,999               10        77          30.00            11         122          33.00           10        129        20.00
 $ 1,000,000 $ 1,499,999           1        331         No Sales           0          0            0.00            0         0          0.00
 $ 1,500,000 and up                 2       825         No Sales           1        1,342        No Sales          2        696       No Sales
           ALL                     93       308          15.50            90         305          16.88           97        301        17.37

 Hinsdale - 521
 $         0 $ 199,999              6       463          12.00             9         422          15.43            8        417        12.00
 $ 200,000 $ 349,999               24       371          22.15            20         325          20.00           24        297        24.00
 $ 350,000 $ 499,999               10       191          40.00            16         174          96.00           16        195        96.00
 $ 500,000 $ 749,999                8       243          19.20            10         177          24.00           10        208        24.00
 $ 750,000 $ 999,999                2        53          24.00             2          83          24.00            4         88        48.00
 $ 1,000,000 $ 1,499,999            3       202         No Sales           3         232         No Sales          1        517       No Sales
 $ 1,500,000 and up                 0         0           0.00             0           0           0.00            0          0         0.00
           ALL                     53       306          22.71            60         262          26.67           63        262        27.00


Data Source: MRED LLC                             (C) Copyright 2011, A.L. Wagner Appraisal Group, Inc.
Midwest Real Estate Data, LLC                        www.WagnerAppraisal.com ~ (630) 416-6556                                                  Page 12
as of June 1, 2011                      as of July 1, 2011                     as of August 1, 2011
                                # Actives   DOM      Months Supply     # Actives     DOM       Months Supply   # Actives    DOM     Months Supply
 Hoffman Estates - 194
 $         0 $ 199,999            150       259           10.34          141         256           9.56          132        252        8.43
 $ 200,000 $ 349,999               42       161           12.60           34         154           12.00          31        174        12.40
 $ 350,000 $ 499,999                0        0             0.00            0          0             0.00           0         0          0.00
 $ 500,000 $ 749,999                0        0             0.00            0          0             0.00           0         0          0.00
 $ 750,000 $ 999,999                0        0             0.00            0          0             0.00           0         0          0.00
 $ 1,000,000 $ 1,499,999           0         0             0.00            0          0             0.00           0         0          0.00
 $ 1,500,000 and up                0         0             0.00            0          0             0.00           0         0          0.00
           ALL                    192       238           10.77          175         237           9.95          163        237        8.97

 Homewood - 430
 $         0 $ 199,999             53       379           13.53           65         290           15.92          60        326        15.00
 $ 200,000 $ 349,999                0        0             0.00            0          0             0.00           0         0          0.00
 $ 350,000 $ 499,999                0        0             0.00            0          0             0.00           0         0          0.00
 $ 500,000 $ 749,999                0        0             0.00            0          0             0.00           0         0          0.00
 $ 750,000 $ 999,999                0        0             0.00            0          0             0.00           0         0          0.00
 $ 1,000,000 $ 1,499,999            0        0             0.00            0          0             0.00           0         0          0.00
 $ 1,500,000 and up                 0        0             0.00            0          0             0.00           0         0          0.00
           ALL                     53       379           13.53           65         290           15.92          60        326        15.00

        y
 Huntley - 142
 $         0 $ 199,999             60       318           8.00            54         319           7.04           58        294         7.33
 $ 200,000 $ 349,999                2       201         No Sales           2         231         No Sales          1        362       No Sales
 $ 350,000 $ 499,999                0        0            0.00             0          0            0.00            0         0          0.00
 $ 500,000 $ 749,999                0        0            0.00             0          0            0.00            0         0          0.00
 $ 750,000 $ 999,999                0        0            0.00             0          0            0.00            0         0          0.00
 $ 1,000,000 $ 1,499,999            0        0            0.00             0          0            0.00            0         0          0.00
 $ 1,500,000 and up                 0        0            0.00             0          0            0.00            0         0          0.00
           ALL                     62       314           8.27            56         316           7.30           59        296         7.45

 Indian Head Park - 531
  $         0 $ 199,999            32       255           10.97           34         248          12.00           40        227        15.00
  $ 200,000 $ 349,999              11       263            7.33           15         258          15.00           14        283        15.27
  $ 350,000 $ 499,999               4       295           48.00           3          279         No Sales          3        310       No Sales
  $ 500,000 $ 749,999               0        0             0.00            0          0            0.00            0         0          0.00
  $ 750,000 $ 999,999               0        0             0.00            0          0            0.00            0         0          0.00
  $ 1,000,000 $ 1,499,999           0        0             0.00            0          0            0.00            0         0          0.00
  $ 1,500,000 and up                0        0             0.00            0          0            0.00            0         0          0.00
            ALL                    47       260           10.25           52         253          13.28           57        245        15.55


Data Source: MRED LLC                             (C) Copyright 2011, A.L. Wagner Appraisal Group, Inc.
Midwest Real Estate Data, LLC                        www.WagnerAppraisal.com ~ (630) 416-6556                                                 Page 13
as of June 1, 2011                      as of July 1, 2011                     as of August 1, 2011
                                # Actives   DOM      Months Supply     # Actives     DOM       Months Supply   # Actives    DOM     Months Supply
 Itasca - 143
  $         0 $ 199,999             7       390           5.25            11         282           7.33           14        210        11.20
  $ 200,000 $ 349,999              33       230          15.84            33         244          16.50           26        284        13.00
  $ 350,000 $ 499,999               8       299         No Sales           8         329         No Sales          7        396       No Sales
  $ 500,000 $ 749,999               0        0            0.00             0          0            0.00            0         0          0.00
  $ 750,000 $ 999,999               0        0            0.00             0          0            0.00            0         0          0.00
  $ 1,000,000 $ 1,499,999           0        0            0.00             0          0            0.00            0         0          0.00
  $ 1,500,000 and up                0        0            0.00             0          0            0.00            0         0          0.00
            ALL                    48       265          14.05            52         265          14.86           47        278        14.46

 Joliet - 499
 $         0 $ 199,999            211       238          14.89           212         239          15.42          195        246         13.15
 $ 200,000 $ 349,999               21       279          126.00           23         284          276.00          22        314        132.00
 $ 350,000 $ 499,999                0        0            0.00             0          0            0.00            0         0           0.00
 $ 500,000 $ 749,999                0        0            0.00             0          0            0.00            0         0           0.00
 $ 750,000 $ 999,999                0        0            0.00             0          0            0.00            0         0           0.00
 $ 1,000,000 $ 1,499,999           0         0            0.00             0          0            0.00            0         0           0.00
 $ 1,500,000 and up                0         0            0.00             0          0            0.00            0         0           0.00
            ALL                   232       241          16.19           235         243          16.99          217        253        14.47

         g
 LaGrange - 525
 $         0 $ 199,999             37       280           18.50           35         276           15.56          32        297        16.00
 $ 200,000 $ 349,999               16       242           14.77           16         264           14.77          16        257        16.00
 $ 350,000 $ 499,999                1       782            1.71            1         812            3.00           2        426         6.00
 $ 500,000 $ 749,999                0        0             0.00            0          0             0.00           0         0          0.00
 $ 750,000 $ 999,999                0        0             0.00            0          0             0.00           0         0          0.00
 $ 1,000,000 $ 1,499,999            0        0             0.00           0           0            0.00           1         28        No Sales
 $ 1,500,000 and up                 0        0             0.00            0          0             0.00           0         0          0.00
           ALL                     54       278           14.73           52         283           14.18          51        285        15.30

 Lake Bluff - 44
 $         0 $ 199,999             16       268            9.14           18         269           14.40          19        276        14.25
 $ 200,000 $ 349,999                6       148           72.00            3         116           36.00           2         78        12.00
 $ 350,000 $ 499,999                1       121            6.00            2          92           24.00           2        123        24.00
 $ 500,000 $ 749,999                3       429           18.00            3         343           18.00           3        375        18.00
 $ 750,000 $ 999,999                0        0             0.00            0           0            0.00           0          0         0.00
 $ 1,000,000 $ 1,499,999            0        0             0.00            0           0            0.00           0          0         0.00
 $ 1,500,000 and up                 0        0             0.00            0           0            0.00           0          0         0.00
           ALL                     26       253           12.00           26         246           16.42          26        261        14.86


Data Source: MRED LLC                             (C) Copyright 2011, A.L. Wagner Appraisal Group, Inc.
Midwest Real Estate Data, LLC                        www.WagnerAppraisal.com ~ (630) 416-6556                                                 Page 14
as of June 1, 2011                      as of July 1, 2011                     as of August 1, 2011
                                # Actives   DOM      Months Supply     # Actives     DOM       Months Supply   # Actives    DOM     Months Supply
 Lake Forest - 45
 $         0 $ 199,999              6       269           10.29            6         418            9.00           5        264          6.00
 $ 200,000 $ 349,999               21       282           18.00           20         283           15.00          23        267         16.24
 $ 350,000 $ 499,999               20       187           12.00           20         218           14.12          18        216         12.71
 $ 500,000 $ 749,999               14       247           12.00           12         318           11.08          11        351         10.15
 $ 750,000 $ 999,999               18       464          108.00           18         494          108.00          18        525        108.00
 $ 1,000,000 $ 1,499,999            1       276           6.00            1          306           6.00           1         337       No Sales
 $ 1,500,000 and up                 3       469          18.00             4         381          24.00           4         412        24.00
           ALL                     83       299          16.33            81         334          16.20           80        333        15.74

 Lake In The Hills - 156
 $         0 $ 199,999             93       230          15.50            93         253          15.72           81        258        11.85
 $ 200,000 $ 349,999                7       230          14.00             5         226          12.00            4        260         8.00
 $ 350,000 $ 499,999                3        72           9.00            3          102          12.00            5         86        20.00
 $ 500,000 $ 749,999                1       485         No Sales           1         515         No Sales          1        546       No Sales
 $ 750,000 $ 999,999                0         0           0.00             0          0            0.00            0          0         0.00
 $ 1,000,000 $ 1,499,999           0         0            0.00             0          0            0.00            0          0         0.00
 $ 1,500,000 and up                0         0            0.00             0          0            0.00            0          0         0.00
           ALL                    104       228          15.22           102         250          15.49           91        252        12.00

            ,
 Lake Villa, Lindenhurst - 46
 $         0 $ 199,999      39              226           16.14           36         225           14.40          31        164        11.27
 $ 200,000 $ 349,999         2              182           12.00            2         212           12.00           2        243        24.00
 $ 350,000 $ 499,999         0               0             0.00            0          0             0.00           0         0          0.00
 $ 500,000 $ 749,999         0               0             0.00            0          0             0.00           0         0          0.00
 $ 750,000 $ 999,999         0               0             0.00            0          0             0.00           0         0          0.00
 $ 1,000,000 $ 1,499,999     0               0             0.00            0          0             0.00           0         0          0.00
 $ 1,500,000 and up          0               0             0.00            0          0             0.00           0         0          0.00
           ALL              41              224           15.87           38         224           14.25          33        169        11.65

 Lemont - 439
 $         0 $ 199,999              6       306            4.80            5         324            5.00           6        276         8.00
 $ 200,000 $ 349,999               26       404           14.86           24         434           13.71          25        382        13.04
 $ 350,000 $ 499,999               16       257           21.33           16         261           24.00          10        242        13.33
 $ 500,000 $ 749,999                0        0             0.00            0          0             0.00           0         0          0.00
 $ 750,000 $ 999,999                0        0             0.00            0          0             0.00           0         0          0.00
 $ 1,000,000 $ 1,499,999            0        0             0.00            0          0             0.00           0         0          0.00
 $ 1,500,000 and up                 0        0             0.00            0          0             0.00           0         0          0.00
           ALL                     48       343           12.80           45         360           13.17          41        332        12.00


Data Source: MRED LLC                             (C) Copyright 2011, A.L. Wagner Appraisal Group, Inc.
Midwest Real Estate Data, LLC                        www.WagnerAppraisal.com ~ (630) 416-6556                                                 Page 15
as of June 1, 2011                      as of July 1, 2011                     as of August 1, 2011
                                # Actives   DOM      Months Supply     # Actives     DOM       Months Supply   # Actives    DOM     Months Supply
 Libertyville, Green Oaks - 48
 $         0 $ 199,999      36              157          25.41            35         171          22.11           35        169        19.09
 $ 200,000 $ 349,999        30              265          25.71            29         251          29.00           30        272        30.00
 $ 350,000 $ 499,999        10              256          60.00             9         295          54.00            7        341        84.00
 $ 500,000 $ 749,999         1              234         No Sales           1         264         No Sales          1        295       No Sales
 $ 750,000 $ 999,999         1               44         No Sales           1          74         No Sales          1        105       No Sales
 $ 1,000,000 $ 1,499,999     0               0            0.00             0          0            0.00            0         0          0.00
 $ 1,500,000 and up          0               0            0.00             0          0            0.00            0         0          0.00
           ALL              78              211          28.36            75         217          27.27           74        228        25.37

 Lisle - 532
 $         0 $ 199,999            119       256           9.04           104         258           8.10          103        224         7.87
 $ 200,000 $ 349,999               36       259          22.74            34         284          22.67           30        316        20.00
 $ 350,000 $ 499,999                6       627         No Sales           6         657         No Sales          7        689       No Sales
 $ 500,000 $ 749,999                2       350          24.00             2         380          24.00           1         130        12.00
 $ 750,000 $ 999,999                0        0            0.00             0          0            0.00            0         0          0.00
 $ 1,000,000 $ 1,499,999           0         0            0.00             0          0            0.00            0         0          0.00
 $ 1,500,000 and up                0         0            0.00             0          0            0.00            0         0          0.00
           ALL                    163       271          10.99           146         282          10.13          141        266         9.61

      p    ,             p
 Lockport, Homer Township - 495
 $         0 $ 199,999    91                275          14.00            92         284          15.55           96        283        16.46
 $ 200,000 $ 349,999      17                433          22.67            19         416          45.60           16        465        38.40
 $ 350,000 $ 499,999       1                895         No Sales           1         925         No Sales          1        956       No Sales
 $ 500,000 $ 749,999       0                 0            0.00             0          0            0.00            0         0          0.00
 $ 750,000 $ 999,999       0                 0            0.00             0          0            0.00            0         0          0.00
 $ 1,000,000 $ 1,499,999  0                  0            0.00             0          0            0.00            0         0          0.00
 $ 1,500,000 and up       0                  0            0.00             0          0            0.00            0         0          0.00
            ALL          109                305          15.03           112         312          17.68          113        314        18.08

 Lombard - 148
 $         0 $ 199,999            142       262          12.72           140         260          12.00          138        256        11.58
 $ 200,000 $ 349,999               45       189          21.60            43         187          17.79           34        211        13.16
 $ 350,000 $ 499,999                1       718         No Sales           1         748         No Sales          0         0          0.00
 $ 500,000 $ 749,999                0        0            0.00             0          0            0.00            0         0          0.00
 $ 750,000 $ 999,999                0        0            0.00             0          0            0.00            0         0          0.00
 $ 1,000,000 $ 1,499,999           0         0            0.00             0          0            0.00            0         0          0.00
 $ 1,500,000 and up                0         0            0.00             0          0            0.00            0         0          0.00
           ALL                    188       247          14.19           184         246          13.07          172        247        11.86


Data Source: MRED LLC                             (C) Copyright 2011, A.L. Wagner Appraisal Group, Inc.
Midwest Real Estate Data, LLC                        www.WagnerAppraisal.com ~ (630) 416-6556                                                 Page 16
as of June 1, 2011                        as of July 1, 2011                     as of August 1, 2011
                                # Actives   DOM        Months Supply     # Actives     DOM       Months Supply   # Actives    DOM     Months Supply
 Long Grove, Lake Zurich,         Hawthorn Woods, Kildeer - 47
 $         0 $ 199,999             8       68        5.65                   10          80           8.00            9        127         6.75
 $ 200,000 $ 349,999              16      318       11.29                   17         328           13.60          15        378        11.25
 $ 350,000 $ 499,999               5      458       20.00                    4         592           16.00           3        487        12.00
 $ 500,000 $ 749,999               0        0        0.00                    0           0            0.00           0         0          0.00
 $ 750,000 $ 999,999               0        0        0.00                    0           0            0.00           0         0          0.00
 $ 1,000,000 $ 1,499,999           0       0         0.00                    0           0            0.00           0         0          0.00
 $ 1,500,000 and up                0       0         0.00                    0           0            0.00           0         0          0.00
           ALL                    29      273        9.41                   31         282           11.27          27        306        9.26

 Lyons - 534
 $         0 $ 199,999             14       316             6.72            15         383            7.83          13        414         6.50
 $ 200,000 $ 349,999                0        0              0.00            0           0             0.00          1         776       No Sales
 $ 350,000 $ 499,999                0        0              0.00             0          0             0.00           0         0          0.00
 $ 500,000 $ 749,999                0        0              0.00             0          0             0.00           0         0          0.00
 $ 750,000 $ 999,999                0        0              0.00             0          0             0.00           0         0          0.00
 $ 1,000,000 $ 1,499,999            0        0              0.00             0          0             0.00           0         0          0.00
 $ 1,500,000 and up                 0        0              0.00             0          0             0.00           0         0          0.00
           ALL                     14       316             6.72            15         383            7.83          14        440         7.00

          y,           ,            ,  g     ,    y     ,         g
 McHenry, Lake Moor, McCullom Lake, Ringwood, Sunnyside, Johnsburg - 50
 $         0 $ 199,999   102    316       11.77        101     344                                   11.88          97        367        11.19
 $ 200,000 $ 349,999      3      39       12.00          6      52                                   24.00           5         73        20.00
 $ 350,000 $ 499,999      0       0        0.00          0       0                                    0.00           0          0         0.00
 $ 500,000 $ 749,999      0       0        0.00          0       0                                    0.00           0          0         0.00
 $ 750,000 $ 999,999      0       0        0.00          0       0                                    0.00           0          0         0.00
 $ 1,000,000 $ 1,499,999  0      0         0.00          0       0                                    0.00           0          0         0.00
 $ 1,500,000 and up       0      0         0.00          0       0                                    0.00           0          0         0.00
            ALL          105    308       11.78        107     328                                   12.23         102        352        11.44

 Melrose Park - 160
 $         0 $ 199,999             17        267           12.00            17         265           11.33          18        258        11.37
 $ 200,000 $ 349,999                1       1,665          12.00            1         1,695          12.00          2         872        24.00
 $ 350,000 $ 499,999                1       1,062         No Sales           0          0             0.00           0         0          0.00
 $ 500,000 $ 749,999                0         0             0.00             0          0             0.00           0         0          0.00
 $ 750,000 $ 999,999                0         0             0.00             0          0             0.00           0         0          0.00
 $ 1,000,000 $ 1,499,999            0         0             0.00             0          0             0.00           0         0          0.00
 $ 1,500,000 and up                 0         0             0.00             0          0             0.00           0         0          0.00
           ALL                     19        383           12.67            18         345           11.37          20        320        12.00


Data Source: MRED LLC                               (C) Copyright 2011, A.L. Wagner Appraisal Group, Inc.
Midwest Real Estate Data, LLC                          www.WagnerAppraisal.com ~ (630) 416-6556                                                 Page 17
as of June 1, 2011                      as of July 1, 2011                     as of August 1, 2011
                                # Actives   DOM      Months Supply     # Actives     DOM       Months Supply   # Actives    DOM     Months Supply
 Mokena - 448
 $         0 $ 199,999             29       150          12.43            29         164          11.60           31        176        11.63
 $ 200,000 $ 349,999               37       177          11.68            40         224          16.00           35        240        14.48
 $ 350,000 $ 499,999                4       524         No Sales           2         207         No Sales          2        148        24.00
 $ 500,000 $ 749,999                0        0            0.00             0          0            0.00            0         0          0.00
 $ 750,000 $ 999,999                0        0            0.00             0          0            0.00            0         0          0.00
 $ 1,000,000 $ 1,499,999            0        0            0.00             0          0            0.00            0         0          0.00
 $ 1,500,000 and up                 0        0            0.00             0          0            0.00            0         0          0.00
           ALL                     70       186          12.73            71         199          14.20           68        208        13.16

 Montgomery - 538
 $         0 $ 199,999             48       186           6.62            45         181            5.68          45        160         5.51
 $ 200,000 $ 349,999                0        0            0.00             0          0             0.00           0         0          0.00
 $ 350,000 $ 499,999                0        0            0.00             0          0             0.00           0         0          0.00
 $ 500,000 $ 749,999                0        0            0.00             0          0             0.00           0         0          0.00
 $ 750,000 $ 999,999                0        0            0.00             0          0             0.00           0         0          0.00
 $ 1,000,000 $ 1,499,999            0        0            0.00             0          0             0.00           0         0          0.00
 $ 1,500,000 and up                 0        0            0.00             0          0             0.00           0         0          0.00
           ALL                     48       186           6.62            45         181            5.68          45        160         5.51

 Morton Grove - 53
 $         0 $ 199,999             68       308           16.00           65         324           16.96          58        338        12.43
 $ 200,000 $ 349,999               37       282           13.45           30         306           11.25          32        304        11.64
 $ 350,000 $ 499,999                5       460           30.00            4         557           24.00           3        758        18.00
 $ 500,000 $ 749,999                0        0             0.00            0          0             0.00           0         0          0.00
 $ 750,000 $ 999,999                0        0             0.00            0          0             0.00           0         0          0.00
 $ 1,000,000 $ 1,499,999           0         0             0.00            0          0             0.00           0         0          0.00
 $ 1,500,000 and up                0         0             0.00            0          0             0.00           0         0          0.00
           ALL                    110       306           15.35           99         328           14.85          93        340        12.26

 Mount Prospect - 56
 $         0 $ 199,999            134       264           8.79           139         264            9.11         141        268        9.25
 $ 200,000 $ 349,999               37       253           15.86           37         243           17.08          33        247        13.66
 $ 350,000 $ 499,999                4       437           16.00            3         519           12.00          2         703        8.00
 $ 500,000 $ 749,999                0        0             0.00            0          0             0.00           0         0          0.00
 $ 750,000 $ 999,999                0        0             0.00            0          0             0.00           0         0          0.00
 $ 1,000,000 $ 1,499,999           0         0            0.00             0          0             0.00           0         0          0.00
 $ 1,500,000 and up                0         0            0.00             0          0             0.00           0         0          0.00
           ALL                    175       266           9.81           179         264           10.13         176        269        9.82


Data Source: MRED LLC                             (C) Copyright 2011, A.L. Wagner Appraisal Group, Inc.
Midwest Real Estate Data, LLC                        www.WagnerAppraisal.com ~ (630) 416-6556                                                  Page 18
as of June 1, 2011                      as of July 1, 2011                     as of August 1, 2011
                                # Actives   DOM      Months Supply     # Actives     DOM       Months Supply   # Actives    DOM     Months Supply
 Mundelein - 60
 $         0 $ 199,999             69       231          12.18            68         192          11.83           65        213        11.14
 $ 200,000 $ 349,999               14       407          18.67            11         446          16.50            9        562        15.43
 $ 350,000 $ 499,999                3       745         No Sales           1          13         No Sales          2         24       No Sales
 $ 500,000 $ 749,999                0        0            0.00             0          0            0.00            0         0          0.00
 $ 750,000 $ 999,999                0        0            0.00             0          0            0.00            0         0          0.00
 $ 1,000,000 $ 1,499,999            0        0            0.00             0          0            0.00            0         0          0.00
 $ 1,500,000 and up                 0        0            0.00             0          0            0.00            0         0          0.00
           ALL                     86       278          13.40            80         224          12.47           76        249        11.84

 Naperville - 540
 $         0 $ 199,999            295       227          12.04           283         224          12.09          260        244        10.58
 $ 200,000 $ 349,999              129       198          12.90           128         185          13.24          118        194        11.90
 $ 350,000 $ 499,999               23       265          15.33            22         269          13.20           19        344        12.00
 $ 500,000 $ 749,999               10       503          15.00            15         348          20.00           15        344        25.71
 $ 750,000 $ 999,999                1       263         No Sales           1         293         No Sales          0         0          0.00
 $ 1,000,000 $ 1,499,999           0         0            0.00             0          0            0.00            0         0          0.00
 $ 1,500,000 and up                0         0            0.00             0          0            0.00            0         0          0.00
           ALL                    458       227          12.49           449         219          12.65          412        238        11.24

 New Lenox - 451
 $         0 $ 199,999             40       197           17.78           41         189           18.92          42        203        20.16
 $ 200,000 $ 349,999               50       365           54.55           45         414           49.09          42        459        38.77
 $ 350,000 $ 499,999                0        0             0.00            0          0             0.00           0         0          0.00
 $ 500,000 $ 749,999                0        0             0.00            0          0             0.00           0         0          0.00
 $ 750,000 $ 999,999                0        0             0.00            0          0             0.00           0         0          0.00
 $ 1,000,000 $ 1,499,999            0        0             0.00            0          0             0.00           0         0          0.00
 $ 1,500,000 and up                 0        0             0.00            0          0             0.00           0         0          0.00
           ALL                     90       290           28.42           86         307           27.89          84        331        26.53

 Niles - 648
 $         0 $ 199,999             85       236            9.19           78         249            8.14          78        252        8.00
 $ 200,000 $ 349,999               24       240           22.15           25         256           25.00          24        293        22.15
 $ 350,000 $ 499,999                0        0             0.00            0          0             0.00           0         0          0.00
 $ 500,000 $ 749,999                0        0             0.00            0          0             0.00           0         0          0.00
 $ 750,000 $ 999,999                0        0             0.00            0          0             0.00           0         0          0.00
 $ 1,000,000 $ 1,499,999           0         0             0.00            0          0             0.00           0         0          0.00
 $ 1,500,000 and up                0         0             0.00            0          0             0.00           0         0          0.00
           ALL                    109       237           10.55          103         251           9.73          102        261        9.42


Data Source: MRED LLC                             (C) Copyright 2011, A.L. Wagner Appraisal Group, Inc.
Midwest Real Estate Data, LLC                        www.WagnerAppraisal.com ~ (630) 416-6556                                                 Page 19
Chicagoland Housing Market Pulse

More Related Content

What's hot

H W 2010 01 De
H W 2010 01 DeH W 2010 01 De
H W 2010 01 Dechipwags
 
Chicagoland Monthly Maket Pulse -Feb 2010 Detached
Chicagoland Monthly Maket Pulse -Feb 2010 DetachedChicagoland Monthly Maket Pulse -Feb 2010 Detached
Chicagoland Monthly Maket Pulse -Feb 2010 Detachedchipwags
 
Total Market Overview 106 Island Bridge Dr
Total Market Overview 106 Island Bridge DrTotal Market Overview 106 Island Bridge Dr
Total Market Overview 106 Island Bridge Drwaltdowdy
 
Pamper world cashflow statement form
Pamper world cashflow statement formPamper world cashflow statement form
Pamper world cashflow statement formjoanmworthington
 
Water Sense 3 2010 Income
Water Sense 3 2010 IncomeWater Sense 3 2010 Income
Water Sense 3 2010 Incomebillgraham777
 
Town Meeting: Feb 16, 2012
Town Meeting: Feb 16, 2012Town Meeting: Feb 16, 2012
Town Meeting: Feb 16, 2012quirky
 
Kkc 2008 Analysis Jan23
Kkc 2008 Analysis Jan23Kkc 2008 Analysis Jan23
Kkc 2008 Analysis Jan23saketvora
 
Middlesex Water Company Shareholder Presentation
Middlesex Water Company Shareholder PresentationMiddlesex Water Company Shareholder Presentation
Middlesex Water Company Shareholder PresentationCompany Spotlight
 
39348363 google-earnings-slides-q3-2010
39348363 google-earnings-slides-q3-201039348363 google-earnings-slides-q3-2010
39348363 google-earnings-slides-q3-2010Pranav Bhatnagar
 
Presupuestos finanzas iv
Presupuestos finanzas ivPresupuestos finanzas iv
Presupuestos finanzas ivMG SC
 
GDC13 crowdfunding numbers and trends
GDC13 crowdfunding numbers and trendsGDC13 crowdfunding numbers and trends
GDC13 crowdfunding numbers and trendsICO Partners
 
Profundización excel jeisson murillo
Profundización excel jeisson murilloProfundización excel jeisson murillo
Profundización excel jeisson murilloJeisson Murillo
 
Do not submit acc 422 week 3 wiley plus assignment exercises
Do not submit acc 422 week 3 wiley plus assignment    exercisesDo not submit acc 422 week 3 wiley plus assignment    exercises
Do not submit acc 422 week 3 wiley plus assignment exercisesjefferysbush1
 
Aejay .midterm
Aejay .midtermAejay .midterm
Aejay .midtermaejay_neri
 
Final Chocolate Assignment
Final Chocolate AssignmentFinal Chocolate Assignment
Final Chocolate Assignmentclmacdonald
 

What's hot (20)

H W 2010 01 De
H W 2010 01 DeH W 2010 01 De
H W 2010 01 De
 
Chicagoland Monthly Maket Pulse -Feb 2010 Detached
Chicagoland Monthly Maket Pulse -Feb 2010 DetachedChicagoland Monthly Maket Pulse -Feb 2010 Detached
Chicagoland Monthly Maket Pulse -Feb 2010 Detached
 
Total Market Overview 106 Island Bridge Dr
Total Market Overview 106 Island Bridge DrTotal Market Overview 106 Island Bridge Dr
Total Market Overview 106 Island Bridge Dr
 
Pamper world cashflow statement form
Pamper world cashflow statement formPamper world cashflow statement form
Pamper world cashflow statement form
 
Water Sense 3 2010 Income
Water Sense 3 2010 IncomeWater Sense 3 2010 Income
Water Sense 3 2010 Income
 
Americaspony
AmericasponyAmericaspony
Americaspony
 
Town Meeting: Feb 16, 2012
Town Meeting: Feb 16, 2012Town Meeting: Feb 16, 2012
Town Meeting: Feb 16, 2012
 
Kkc 2008 Analysis Jan23
Kkc 2008 Analysis Jan23Kkc 2008 Analysis Jan23
Kkc 2008 Analysis Jan23
 
Kvar Savings Projections
Kvar Savings ProjectionsKvar Savings Projections
Kvar Savings Projections
 
Alyay Presentation
Alyay PresentationAlyay Presentation
Alyay Presentation
 
Middlesex Water Company Shareholder Presentation
Middlesex Water Company Shareholder PresentationMiddlesex Water Company Shareholder Presentation
Middlesex Water Company Shareholder Presentation
 
39348363 google-earnings-slides-q3-2010
39348363 google-earnings-slides-q3-201039348363 google-earnings-slides-q3-2010
39348363 google-earnings-slides-q3-2010
 
Presupuestos finanzas iv
Presupuestos finanzas ivPresupuestos finanzas iv
Presupuestos finanzas iv
 
Daily report
Daily reportDaily report
Daily report
 
GDC13 crowdfunding numbers and trends
GDC13 crowdfunding numbers and trendsGDC13 crowdfunding numbers and trends
GDC13 crowdfunding numbers and trends
 
Profundización excel jeisson murillo
Profundización excel jeisson murilloProfundización excel jeisson murillo
Profundización excel jeisson murillo
 
Do not submit acc 422 week 3 wiley plus assignment exercises
Do not submit acc 422 week 3 wiley plus assignment    exercisesDo not submit acc 422 week 3 wiley plus assignment    exercises
Do not submit acc 422 week 3 wiley plus assignment exercises
 
Aejay .midterm
Aejay .midtermAejay .midterm
Aejay .midterm
 
André Ernst
André ErnstAndré Ernst
André Ernst
 
Final Chocolate Assignment
Final Chocolate AssignmentFinal Chocolate Assignment
Final Chocolate Assignment
 

Similar to Chicagoland Housing Market Pulse

Mafia Wars Expense Guide
Mafia Wars Expense GuideMafia Wars Expense Guide
Mafia Wars Expense Guideguest26cede
 
South Carolina Tax Tables
South Carolina Tax TablesSouth Carolina Tax Tables
South Carolina Tax Tablestaxman taxman
 
Trading plan
Trading planTrading plan
Trading planldfx
 
De fran tax 2009 rev
De fran tax 2009 revDe fran tax 2009 rev
De fran tax 2009 revalanstachura
 
2010 q3 google_earnings_slides
2010 q3 google_earnings_slides2010 q3 google_earnings_slides
2010 q3 google_earnings_slidesrabier
 
Perfect business
Perfect businessPerfect business
Perfect businessseyfom
 
Bnm analisis evolucion depositos - graficos
Bnm   analisis evolucion depositos - graficosBnm   analisis evolucion depositos - graficos
Bnm analisis evolucion depositos - graficosgonzaloromani
 
Austin Market Update January 2008
Austin Market Update January 2008Austin Market Update January 2008
Austin Market Update January 2008Dee Patience
 
Power Start Simplified
Power Start SimplifiedPower Start Simplified
Power Start SimplifiedPat Williams
 
Kickstarter and Games - September 2012
Kickstarter and Games - September 2012Kickstarter and Games - September 2012
Kickstarter and Games - September 2012ICO Partners
 
Kickstarter and Games - June 2012
Kickstarter and Games - June 2012Kickstarter and Games - June 2012
Kickstarter and Games - June 2012ICO Partners
 
Kickstarter and Games - December 2012
Kickstarter and Games - December 2012Kickstarter and Games - December 2012
Kickstarter and Games - December 2012ICO Partners
 
New perfect business
New perfect businessNew perfect business
New perfect businessAli VAROL
 
2 of 2 UCB Income Statement Projections BUS 63 Viltz, Wren 12:10:15
2 of 2 UCB  Income Statement Projections BUS 63 Viltz, Wren 12:10:152 of 2 UCB  Income Statement Projections BUS 63 Viltz, Wren 12:10:15
2 of 2 UCB Income Statement Projections BUS 63 Viltz, Wren 12:10:15Wren Viltz
 

Similar to Chicagoland Housing Market Pulse (20)

Presupuesto mensual
Presupuesto mensualPresupuesto mensual
Presupuesto mensual
 
Presupuesto mensual
Presupuesto mensualPresupuesto mensual
Presupuesto mensual
 
Mafia Wars Expense Guide
Mafia Wars Expense GuideMafia Wars Expense Guide
Mafia Wars Expense Guide
 
South Carolina Tax Tables
South Carolina Tax TablesSouth Carolina Tax Tables
South Carolina Tax Tables
 
Trading plan
Trading planTrading plan
Trading plan
 
De fran tax 2009 rev
De fran tax 2009 revDe fran tax 2009 rev
De fran tax 2009 rev
 
2010 q3 google_earnings_slides
2010 q3 google_earnings_slides2010 q3 google_earnings_slides
2010 q3 google_earnings_slides
 
Accruals 16.02.09
Accruals 16.02.09Accruals 16.02.09
Accruals 16.02.09
 
Accruals 16.02.09
Accruals 16.02.09Accruals 16.02.09
Accruals 16.02.09
 
Accruals 16.02.09
Accruals 16.02.09Accruals 16.02.09
Accruals 16.02.09
 
Perfect business
Perfect businessPerfect business
Perfect business
 
Bnm analisis evolucion depositos - graficos
Bnm   analisis evolucion depositos - graficosBnm   analisis evolucion depositos - graficos
Bnm analisis evolucion depositos - graficos
 
Austin Market Update January 2008
Austin Market Update January 2008Austin Market Update January 2008
Austin Market Update January 2008
 
Lake Elsinore EWDC 2-21-13
Lake Elsinore EWDC 2-21-13Lake Elsinore EWDC 2-21-13
Lake Elsinore EWDC 2-21-13
 
Power Start Simplified
Power Start SimplifiedPower Start Simplified
Power Start Simplified
 
Kickstarter and Games - September 2012
Kickstarter and Games - September 2012Kickstarter and Games - September 2012
Kickstarter and Games - September 2012
 
Kickstarter and Games - June 2012
Kickstarter and Games - June 2012Kickstarter and Games - June 2012
Kickstarter and Games - June 2012
 
Kickstarter and Games - December 2012
Kickstarter and Games - December 2012Kickstarter and Games - December 2012
Kickstarter and Games - December 2012
 
New perfect business
New perfect businessNew perfect business
New perfect business
 
2 of 2 UCB Income Statement Projections BUS 63 Viltz, Wren 12:10:15
2 of 2 UCB  Income Statement Projections BUS 63 Viltz, Wren 12:10:152 of 2 UCB  Income Statement Projections BUS 63 Viltz, Wren 12:10:15
2 of 2 UCB Income Statement Projections BUS 63 Viltz, Wren 12:10:15
 

More from chipwags

Chicagoland Quarterly Supply/Demand Report - 7/1/2011
Chicagoland Quarterly Supply/Demand Report - 7/1/2011Chicagoland Quarterly Supply/Demand Report - 7/1/2011
Chicagoland Quarterly Supply/Demand Report - 7/1/2011chipwags
 
E Newsletter7 2010
E Newsletter7 2010E Newsletter7 2010
E Newsletter7 2010chipwags
 
H W 2010 Q3 De 12 Mo
H W 2010 Q3 De 12 MoH W 2010 Q3 De 12 Mo
H W 2010 Q3 De 12 Mochipwags
 
H W 2010 Q1 De 12 Mo
H W 2010 Q1 De 12 MoH W 2010 Q1 De 12 Mo
H W 2010 Q1 De 12 Mochipwags
 
Wag Report 2009 Q4 De 12 Mo
Wag Report 2009 Q4 De 12 MoWag Report 2009 Q4 De 12 Mo
Wag Report 2009 Q4 De 12 Mochipwags
 
Appraisal Foundation Presentation 2007
Appraisal Foundation Presentation 2007Appraisal Foundation Presentation 2007
Appraisal Foundation Presentation 2007chipwags
 

More from chipwags (6)

Chicagoland Quarterly Supply/Demand Report - 7/1/2011
Chicagoland Quarterly Supply/Demand Report - 7/1/2011Chicagoland Quarterly Supply/Demand Report - 7/1/2011
Chicagoland Quarterly Supply/Demand Report - 7/1/2011
 
E Newsletter7 2010
E Newsletter7 2010E Newsletter7 2010
E Newsletter7 2010
 
H W 2010 Q3 De 12 Mo
H W 2010 Q3 De 12 MoH W 2010 Q3 De 12 Mo
H W 2010 Q3 De 12 Mo
 
H W 2010 Q1 De 12 Mo
H W 2010 Q1 De 12 MoH W 2010 Q1 De 12 Mo
H W 2010 Q1 De 12 Mo
 
Wag Report 2009 Q4 De 12 Mo
Wag Report 2009 Q4 De 12 MoWag Report 2009 Q4 De 12 Mo
Wag Report 2009 Q4 De 12 Mo
 
Appraisal Foundation Presentation 2007
Appraisal Foundation Presentation 2007Appraisal Foundation Presentation 2007
Appraisal Foundation Presentation 2007
 

Recently uploaded

Pitch Deck Teardown: Geodesic.Life's $500k Pre-seed deck
Pitch Deck Teardown: Geodesic.Life's $500k Pre-seed deckPitch Deck Teardown: Geodesic.Life's $500k Pre-seed deck
Pitch Deck Teardown: Geodesic.Life's $500k Pre-seed deckHajeJanKamps
 
8447779800, Low rate Call girls in Shivaji Enclave Delhi NCR
8447779800, Low rate Call girls in Shivaji Enclave Delhi NCR8447779800, Low rate Call girls in Shivaji Enclave Delhi NCR
8447779800, Low rate Call girls in Shivaji Enclave Delhi NCRashishs7044
 
MAHA Global and IPR: Do Actions Speak Louder Than Words?
MAHA Global and IPR: Do Actions Speak Louder Than Words?MAHA Global and IPR: Do Actions Speak Louder Than Words?
MAHA Global and IPR: Do Actions Speak Louder Than Words?Olivia Kresic
 
Cybersecurity Awareness Training Presentation v2024.03
Cybersecurity Awareness Training Presentation v2024.03Cybersecurity Awareness Training Presentation v2024.03
Cybersecurity Awareness Training Presentation v2024.03DallasHaselhorst
 
Unlocking the Future: Explore Web 3.0 Workshop to Start Earning Today!
Unlocking the Future: Explore Web 3.0 Workshop to Start Earning Today!Unlocking the Future: Explore Web 3.0 Workshop to Start Earning Today!
Unlocking the Future: Explore Web 3.0 Workshop to Start Earning Today!Doge Mining Website
 
Memorándum de Entendimiento (MoU) entre Codelco y SQM
Memorándum de Entendimiento (MoU) entre Codelco y SQMMemorándum de Entendimiento (MoU) entre Codelco y SQM
Memorándum de Entendimiento (MoU) entre Codelco y SQMVoces Mineras
 
International Business Environments and Operations 16th Global Edition test b...
International Business Environments and Operations 16th Global Edition test b...International Business Environments and Operations 16th Global Edition test b...
International Business Environments and Operations 16th Global Edition test b...ssuserf63bd7
 
The-Ethical-issues-ghhhhhhhhjof-Byjus.pptx
The-Ethical-issues-ghhhhhhhhjof-Byjus.pptxThe-Ethical-issues-ghhhhhhhhjof-Byjus.pptx
The-Ethical-issues-ghhhhhhhhjof-Byjus.pptxmbikashkanyari
 
Kenya Coconut Production Presentation by Dr. Lalith Perera
Kenya Coconut Production Presentation by Dr. Lalith PereraKenya Coconut Production Presentation by Dr. Lalith Perera
Kenya Coconut Production Presentation by Dr. Lalith Pereraictsugar
 
Youth Involvement in an Innovative Coconut Value Chain by Mwalimu Menza
Youth Involvement in an Innovative Coconut Value Chain by Mwalimu MenzaYouth Involvement in an Innovative Coconut Value Chain by Mwalimu Menza
Youth Involvement in an Innovative Coconut Value Chain by Mwalimu Menzaictsugar
 
Market Sizes Sample Report - 2024 Edition
Market Sizes Sample Report - 2024 EditionMarket Sizes Sample Report - 2024 Edition
Market Sizes Sample Report - 2024 EditionMintel Group
 
8447779800, Low rate Call girls in Kotla Mubarakpur Delhi NCR
8447779800, Low rate Call girls in Kotla Mubarakpur Delhi NCR8447779800, Low rate Call girls in Kotla Mubarakpur Delhi NCR
8447779800, Low rate Call girls in Kotla Mubarakpur Delhi NCRashishs7044
 
8447779800, Low rate Call girls in Rohini Delhi NCR
8447779800, Low rate Call girls in Rohini Delhi NCR8447779800, Low rate Call girls in Rohini Delhi NCR
8447779800, Low rate Call girls in Rohini Delhi NCRashishs7044
 
Independent Call Girls Andheri Nightlaila 9967584737
Independent Call Girls Andheri Nightlaila 9967584737Independent Call Girls Andheri Nightlaila 9967584737
Independent Call Girls Andheri Nightlaila 9967584737Riya Pathan
 
Global Scenario On Sustainable and Resilient Coconut Industry by Dr. Jelfina...
Global Scenario On Sustainable  and Resilient Coconut Industry by Dr. Jelfina...Global Scenario On Sustainable  and Resilient Coconut Industry by Dr. Jelfina...
Global Scenario On Sustainable and Resilient Coconut Industry by Dr. Jelfina...ictsugar
 
APRIL2024_UKRAINE_xml_0000000000000 .pdf
APRIL2024_UKRAINE_xml_0000000000000 .pdfAPRIL2024_UKRAINE_xml_0000000000000 .pdf
APRIL2024_UKRAINE_xml_0000000000000 .pdfRbc Rbcua
 
Call US-88OO1O2216 Call Girls In Mahipalpur Female Escort Service
Call US-88OO1O2216 Call Girls In Mahipalpur Female Escort ServiceCall US-88OO1O2216 Call Girls In Mahipalpur Female Escort Service
Call US-88OO1O2216 Call Girls In Mahipalpur Female Escort Servicecallgirls2057
 

Recently uploaded (20)

No-1 Call Girls In Goa 93193 VIP 73153 Escort service In North Goa Panaji, Ca...
No-1 Call Girls In Goa 93193 VIP 73153 Escort service In North Goa Panaji, Ca...No-1 Call Girls In Goa 93193 VIP 73153 Escort service In North Goa Panaji, Ca...
No-1 Call Girls In Goa 93193 VIP 73153 Escort service In North Goa Panaji, Ca...
 
Pitch Deck Teardown: Geodesic.Life's $500k Pre-seed deck
Pitch Deck Teardown: Geodesic.Life's $500k Pre-seed deckPitch Deck Teardown: Geodesic.Life's $500k Pre-seed deck
Pitch Deck Teardown: Geodesic.Life's $500k Pre-seed deck
 
8447779800, Low rate Call girls in Shivaji Enclave Delhi NCR
8447779800, Low rate Call girls in Shivaji Enclave Delhi NCR8447779800, Low rate Call girls in Shivaji Enclave Delhi NCR
8447779800, Low rate Call girls in Shivaji Enclave Delhi NCR
 
MAHA Global and IPR: Do Actions Speak Louder Than Words?
MAHA Global and IPR: Do Actions Speak Louder Than Words?MAHA Global and IPR: Do Actions Speak Louder Than Words?
MAHA Global and IPR: Do Actions Speak Louder Than Words?
 
Cybersecurity Awareness Training Presentation v2024.03
Cybersecurity Awareness Training Presentation v2024.03Cybersecurity Awareness Training Presentation v2024.03
Cybersecurity Awareness Training Presentation v2024.03
 
Unlocking the Future: Explore Web 3.0 Workshop to Start Earning Today!
Unlocking the Future: Explore Web 3.0 Workshop to Start Earning Today!Unlocking the Future: Explore Web 3.0 Workshop to Start Earning Today!
Unlocking the Future: Explore Web 3.0 Workshop to Start Earning Today!
 
Call Us ➥9319373153▻Call Girls In North Goa
Call Us ➥9319373153▻Call Girls In North GoaCall Us ➥9319373153▻Call Girls In North Goa
Call Us ➥9319373153▻Call Girls In North Goa
 
Memorándum de Entendimiento (MoU) entre Codelco y SQM
Memorándum de Entendimiento (MoU) entre Codelco y SQMMemorándum de Entendimiento (MoU) entre Codelco y SQM
Memorándum de Entendimiento (MoU) entre Codelco y SQM
 
International Business Environments and Operations 16th Global Edition test b...
International Business Environments and Operations 16th Global Edition test b...International Business Environments and Operations 16th Global Edition test b...
International Business Environments and Operations 16th Global Edition test b...
 
The-Ethical-issues-ghhhhhhhhjof-Byjus.pptx
The-Ethical-issues-ghhhhhhhhjof-Byjus.pptxThe-Ethical-issues-ghhhhhhhhjof-Byjus.pptx
The-Ethical-issues-ghhhhhhhhjof-Byjus.pptx
 
Kenya Coconut Production Presentation by Dr. Lalith Perera
Kenya Coconut Production Presentation by Dr. Lalith PereraKenya Coconut Production Presentation by Dr. Lalith Perera
Kenya Coconut Production Presentation by Dr. Lalith Perera
 
Youth Involvement in an Innovative Coconut Value Chain by Mwalimu Menza
Youth Involvement in an Innovative Coconut Value Chain by Mwalimu MenzaYouth Involvement in an Innovative Coconut Value Chain by Mwalimu Menza
Youth Involvement in an Innovative Coconut Value Chain by Mwalimu Menza
 
Market Sizes Sample Report - 2024 Edition
Market Sizes Sample Report - 2024 EditionMarket Sizes Sample Report - 2024 Edition
Market Sizes Sample Report - 2024 Edition
 
8447779800, Low rate Call girls in Kotla Mubarakpur Delhi NCR
8447779800, Low rate Call girls in Kotla Mubarakpur Delhi NCR8447779800, Low rate Call girls in Kotla Mubarakpur Delhi NCR
8447779800, Low rate Call girls in Kotla Mubarakpur Delhi NCR
 
8447779800, Low rate Call girls in Rohini Delhi NCR
8447779800, Low rate Call girls in Rohini Delhi NCR8447779800, Low rate Call girls in Rohini Delhi NCR
8447779800, Low rate Call girls in Rohini Delhi NCR
 
Independent Call Girls Andheri Nightlaila 9967584737
Independent Call Girls Andheri Nightlaila 9967584737Independent Call Girls Andheri Nightlaila 9967584737
Independent Call Girls Andheri Nightlaila 9967584737
 
Global Scenario On Sustainable and Resilient Coconut Industry by Dr. Jelfina...
Global Scenario On Sustainable  and Resilient Coconut Industry by Dr. Jelfina...Global Scenario On Sustainable  and Resilient Coconut Industry by Dr. Jelfina...
Global Scenario On Sustainable and Resilient Coconut Industry by Dr. Jelfina...
 
Corporate Profile 47Billion Information Technology
Corporate Profile 47Billion Information TechnologyCorporate Profile 47Billion Information Technology
Corporate Profile 47Billion Information Technology
 
APRIL2024_UKRAINE_xml_0000000000000 .pdf
APRIL2024_UKRAINE_xml_0000000000000 .pdfAPRIL2024_UKRAINE_xml_0000000000000 .pdf
APRIL2024_UKRAINE_xml_0000000000000 .pdf
 
Call US-88OO1O2216 Call Girls In Mahipalpur Female Escort Service
Call US-88OO1O2216 Call Girls In Mahipalpur Female Escort ServiceCall US-88OO1O2216 Call Girls In Mahipalpur Female Escort Service
Call US-88OO1O2216 Call Girls In Mahipalpur Female Escort Service
 

Chicagoland Housing Market Pulse

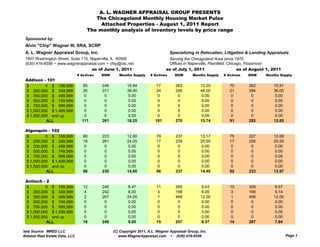
  • 1. A. L. WAGNER APPRAISAL GROUP PRESENTS The Chicagoland Monthly Housing Market Pulse Attached Properties - August 1, 2011 Report The monthly analysis of inventory levels by price range Sponsored by: Alvin "Chip" Wagner III, SRA, SCRP A. L. Wagner Appraisal Group, Inc. Specializing in Relocation, Litigation & Lending Appraisals 1807 Washington Street, Suite 110, Naperville, IL 60565 Serving the Chicagoland Area since 1970 (630) 416-6556 ~ www.wagnerappraisal.com ~ chip@rac.net Offices in Naperville, Plainfield, Chicago, Flossmoor as of June 1, 2011 as of July 1, 2011 as of August 1, 2011 # Actives DOM Months Supply # Actives DOM Months Supply # Actives DOM Months Supply Addison - 101 $ 0 $ 199,999 85 246 15.94 77 263 13.20 70 262 10.91 $ 200,000 $ 349,999 26 311 39.00 24 295 48.00 21 394 36.00 $ 350,000 $ 499,999 0 0 0.00 0 0 0.00 0 0 0.00 $ 500,000 $ 749,999 0 0 0.00 0 0 0.00 0 0 0.00 $ 750,000 $ 999,999 0 0 0.00 0 0 0.00 0 0 0.00 $ 1,000,000 $ 1,499,999 0 0 0.00 0 0 0.00 0 0 0.00 $ 1,500,000 and up 0 0 0.00 0 0 0.00 0 0 0.00 ALL 111 261 18.25 101 270 15.74 91 293 12.85 Algonquin - 102 $ 0 $ 199,999 80 223 12.80 79 237 13.17 75 227 12.68 $ 200,000 $ 349,999 18 261 24.00 17 239 25.50 17 256 25.50 $ 350,000 $ 499,999 0 0 0.00 0 0 0.00 0 0 0.00 $ 500,000 $ 749,999 0 0 0.00 0 0 0.00 0 0 0.00 $ 750,000 $ 999,999 0 0 0.00 0 0 0.00 0 0 0.00 $ 1,000,000 $ 1,499,999 0 0 0.00 0 0 0.00 0 0 0.00 $ 1,500,000 and up 0 0 0.00 0 0 0.00 0 0 0.00 ALL 98 230 14.00 96 237 14.40 92 233 13.97 Antioch - 2 $ 0 $ 199,999 12 246 8.47 11 265 9.43 10 309 8.57 $ 200,000 $ 349,999 4 242 8.00 3 158 6.00 3 189 5.14 $ 350,000 $ 499,999 2 267 24.00 1 468 12.00 1 499 12.00 $ 500,000 $ 749,999 0 0 0.00 0 0 0.00 0 0 0.00 $ 750,000 $ 999,999 0 0 0.00 0 0 0.00 0 0 0.00 $ 1,000,000 $ 1,499,999 0 0 0.00 0 0 0.00 0 0 0.00 $ 1,500,000 and up 0 0 0.00 0 0 0.00 0 0 0.00 ALL 18 248 9.00 15 257 8.57 14 297 7.64 Data Source: MRED LLC (C) Copyright 2011, A.L. Wagner Appraisal Group, Inc. Midwest Real Estate Data, LLC www.WagnerAppraisal.com ~ (630) 416-6556 Page 1
  • 2. as of June 1, 2011 as of July 1, 2011 as of August 1, 2011 # Actives DOM Months Supply # Actives DOM Months Supply # Actives DOM Months Supply Arlington Heights - 5 $ 0 $ 199,999 216 262 8.85 215 266 8.81 225 269 8.79 $ 200,000 $ 349,999 85 200 8.03 82 182 7.87 68 198 6.58 $ 350,000 $ 499,999 5 511 10.00 5 469 10.00 6 388 24.00 $ 500,000 $ 749,999 6 130 14.40 6 107 14.40 4 164 12.00 $ 750,000 $ 999,999 1 493 No Sales 1 523 No Sales 1 554 No Sales $ 1,000,000 $ 1,499,999 0 0 0.00 0 0 0.00 0 0 0.00 $ 1,500,000 and up 0 0 0.00 0 0 0.00 0 0 0.00 ALL 313 248 8.71 309 245 8.64 304 255 8.33 Aurora - 507 $ 0 $ 199,999 401 198 9.80 399 207 9.69 386 205 9.05 $ 200,000 $ 349,999 43 356 11.47 42 351 12.00 41 379 12.30 $ 350,000 $ 499,999 11 377 132.00 11 364 132.00 11 353 132.00 $ 500,000 $ 749,999 1 125 No Sales 1 155 No Sales 1 186 No Sales $ 750,000 $ 999,999 0 0 0.00 0 0 0.00 0 0 0.00 $ 1,000,000 $ 1,499,999 0 0 0.00 0 0 0.00 0 0 0.00 $ 1,500,000 and up 0 0 0.00 0 0 0.00 0 0 0.00 ALL 456 217 10.19 453 224 10.12 439 225 9.53 Barrington Area - 10 $ 0 $ 199,999 35 205 12.35 32 243 12.00 32 248 13.24 $ 200,000 $ 349,999 56 232 21.68 57 210 25.33 56 226 28.00 $ 350,000 $ 499,999 23 131 23.00 26 141 31.20 23 163 23.00 $ 500,000 $ 749,999 3 370 12.00 2 432 8.00 4 238 16.00 $ 750,000 $ 999,999 0 0 0.00 0 0 0.00 0 0 0.00 $ 1,000,000 $ 1,499,999 0 0 0.00 0 0 0.00 0 0 0.00 $ 1,500,000 and up 0 0 0.00 0 0 0.00 0 0 0.00 ALL 117 208 17.55 117 207 19.50 115 220 20.29 Bartlett - 104 $ 0 $ 199,999 87 245 10.88 89 239 11.61 94 235 12.13 $ 200,000 $ 349,999 35 196 32.31 30 180 27.69 29 121 34.80 $ 350,000 $ 499,999 2 182 No Sales 2 212 No Sales 1 188 12.00 $ 500,000 $ 749,999 0 0 0.00 0 0 0.00 0 0 0.00 $ 750,000 $ 999,999 0 0 0.00 0 0 0.00 0 0 0.00 $ 1,000,000 $ 1,499,999 0 0 0.00 0 0 0.00 0 0 0.00 $ 1,500,000 and up 0 0 0.00 0 0 0.00 0 0 0.00 ALL 124 230 13.53 121 224 13.70 124 208 14.17 Data Source: MRED LLC (C) Copyright 2011, A.L. Wagner Appraisal Group, Inc. Midwest Real Estate Data, LLC www.WagnerAppraisal.com ~ (630) 416-6556 Page 2
  • 3. as of June 1, 2011 as of July 1, 2011 as of August 1, 2011 # Actives DOM Months Supply # Actives DOM Months Supply # Actives DOM Months Supply Batavia - 510 $ 0 $ 199,999 27 198 16.20 26 225 15.60 27 226 17.05 $ 200,000 $ 349,999 12 296 18.00 16 222 21.33 14 238 16.80 $ 350,000 $ 499,999 6 1,197 No Sales 1 193 No Sales 1 224 No Sales $ 500,000 $ 749,999 1 847 No Sales 0 0 0.00 0 0 0.00 $ 750,000 $ 999,999 0 0 0.00 0 0 0.00 0 0 0.00 $ 1,000,000 $ 1,499,999 0 0 0.00 0 0 0.00 0 0 0.00 $ 1,500,000 and up 0 0 0.00 0 0 0.00 0 0 0.00 ALL 46 368 19.71 43 223 17.79 42 230 17.38 Bensenville - 106 $ 0 $ 199,999 33 355 13.66 28 333 10.50 31 323 12.40 $ 200,000 $ 349,999 2 219 12.00 2 249 No Sales 2 280 No Sales $ 350,000 $ 499,999 0 0 0.00 0 0 0.00 0 0 0.00 $ 500,000 $ 749,999 0 0 0.00 0 0 0.00 0 0 0.00 $ 750,000 $ 999,999 0 0 0.00 0 0 0.00 0 0 0.00 $ 1,000,000 $ 1,499,999 0 0 0.00 0 0 0.00 0 0 0.00 $ 1,500,000 and up 0 0 0.00 0 0 0.00 0 0 0.00 ALL 35 347 13.55 30 328 11.25 33 321 13.20 y Berwyn - 402 $ 0 $ 199,999 51 282 15.30 46 265 12.55 47 291 12.82 $ 200,000 $ 349,999 2 341 24.00 6 138 72.00 5 129 No Sales $ 350,000 $ 499,999 0 0 0.00 0 0 0.00 0 0 0.00 $ 500,000 $ 749,999 0 0 0.00 0 0 0.00 0 0 0.00 $ 750,000 $ 999,999 0 0 0.00 0 0 0.00 0 0 0.00 $ 1,000,000 $ 1,499,999 0 0 0.00 0 0 0.00 0 0 0.00 $ 1,500,000 and up 0 0 0.00 0 0 0.00 0 0 0.00 ALL 53 284 15.51 52 250 13.87 52 275 14.18 Bloomingdale - 108 $ 0 $ 199,999 96 284 14.96 89 298 13.87 87 290 13.22 $ 200,000 $ 349,999 53 215 14.45 48 209 13.71 46 232 12.00 $ 350,000 $ 499,999 9 308 21.60 9 283 21.60 7 354 16.80 $ 500,000 $ 749,999 3 172 No Sales 2 256 No Sales 2 287 No Sales $ 750,000 $ 999,999 0 0 0.00 0 0 0.00 0 0 0.00 $ 1,000,000 $ 1,499,999 0 0 0.00 0 0 0.00 0 0 0.00 $ 1,500,000 and up 0 0 0.00 0 0 0.00 0 0 0.00 ALL 161 260 15.33 148 268 14.32 142 274 13.11 Data Source: MRED LLC (C) Copyright 2011, A.L. Wagner Appraisal Group, Inc. Midwest Real Estate Data, LLC www.WagnerAppraisal.com ~ (630) 416-6556 Page 3
  • 4. as of June 1, 2011 as of July 1, 2011 as of August 1, 2011 # Actives DOM Months Supply # Actives DOM Months Supply # Actives DOM Months Supply Bolingbrook - 440 $ 0 $ 199,999 112 211 7.72 111 190 7.84 107 189 7.47 $ 200,000 $ 349,999 10 327 13.33 10 319 13.33 12 295 18.00 $ 350,000 $ 499,999 1 303 12.00 1 333 12.00 1 364 12.00 $ 500,000 $ 749,999 0 0 0.00 0 0 0.00 0 0 0.00 $ 750,000 $ 999,999 0 0 0.00 0 0 0.00 0 0 0.00 $ 1,000,000 $ 1,499,999 0 0 0.00 0 0 0.00 0 0 0.00 $ 1,500,000 and up 0 0 0.00 0 0 0.00 0 0 0.00 ALL 123 221 8.02 122 202 8.13 120 201 7.96 Brookfield - 513 $ 0 $ 199,999 20 277 21.82 23 278 27.60 19 273 17.54 $ 200,000 $ 349,999 5 218 2.86 5 248 4.00 5 279 4.62 $ 350,000 $ 499,999 0 0 0.00 0 0 0.00 0 0 0.00 $ 500,000 $ 749,999 0 0 0.00 0 0 0.00 0 0 0.00 $ 750,000 $ 999,999 0 0 0.00 0 0 0.00 0 0 0.00 $ 1,000,000 $ 1,499,999 0 0 0.00 0 0 0.00 0 0 0.00 $ 1,500,000 and up 0 0 0.00 0 0 0.00 0 0 0.00 ALL 25 265 9.38 28 272 13.44 24 274 11.08 Buffalo Grove - 89 $ 0 $ 199,999 146 240 8.72 155 234 9.64 158 224 9.53 $ 200,000 $ 349,999 60 216 12.63 57 196 13.15 66 206 16.85 $ 350,000 $ 499,999 13 127 19.50 12 146 16.00 10 168 10.00 $ 500,000 $ 749,999 0 0 0.00 0 0 0.00 0 0 0.00 $ 750,000 $ 999,999 0 0 0.00 0 0 0.00 0 0 0.00 $ 1,000,000 $ 1,499,999 0 0 0.00 0 0 0.00 0 0 0.00 $ 1,500,000 and up 0 0 0.00 0 0 0.00 0 0 0.00 ALL 219 227 9.88 224 220 10.58 234 216 10.88 Burr Ridge - 522 $ 0 $ 199,999 12 231 14.40 10 271 13.33 11 263 13.20 $ 200,000 $ 349,999 20 199 9.23 21 187 10.50 22 189 12.00 $ 350,000 $ 499,999 16 362 32.00 16 352 38.40 16 378 38.40 $ 500,000 $ 749,999 10 511 30.00 13 419 156.00 12 423 144.00 $ 750,000 $ 999,999 1 45 No Sales 1 75 No Sales 1 106 No Sales $ 1,000,000 $ 1,499,999 0 0 0.00 0 0 0.00 0 0 0.00 $ 1,500,000 and up 0 0 0.00 0 0 0.00 0 0 0.00 ALL 59 300 15.39 61 292 18.77 62 295 19.58 Data Source: MRED LLC (C) Copyright 2011, A.L. Wagner Appraisal Group, Inc. Midwest Real Estate Data, LLC www.WagnerAppraisal.com ~ (630) 416-6556 Page 4
  • 5. as of June 1, 2011 as of July 1, 2011 as of August 1, 2011 # Actives DOM Months Supply # Actives DOM Months Supply # Actives DOM Months Supply Carol Stream - 188 $ 0 $ 199,999 95 261 8.38 101 259 9.04 96 280 8.86 $ 200,000 $ 349,999 22 251 17.60 20 238 15.00 16 227 11.29 $ 350,000 $ 499,999 0 0 0.00 1 531 No Sales 1 562 No Sales $ 500,000 $ 749,999 0 0 0.00 0 0 0.00 0 0 0.00 $ 750,000 $ 999,999 0 0 0.00 0 0 0.00 0 0 0.00 $ 1,000,000 $ 1,499,999 0 0 0.00 0 0 0.00 0 0 0.00 $ 1,500,000 and up 0 0 0.00 0 0 0.00 0 0 0.00 ALL 117 259 9.30 122 258 9.76 113 275 9.22 Carpentersville, Lake Marion - 110 $ 0 $ 199,999 107 214 11.57 102 213 10.55 95 222 9.66 $ 200,000 $ 349,999 0 0 0.00 1 16 No Sales 1 47 No Sales $ 350,000 $ 499,999 0 0 0.00 0 0 0.00 0 0 0.00 $ 500,000 $ 749,999 0 0 0.00 0 0 0.00 0 0 0.00 $ 750,000 $ 999,999 0 0 0.00 0 0 0.00 0 0 0.00 $ 1,000,000 $ 1,499,999 0 0 0.00 0 0 0.00 0 0 0.00 $ 1,500,000 and up 0 0 0.00 0 0 0.00 0 0 0.00 ALL 107 214 11.57 103 211 10.66 96 220 9.76 y, Cary, Oakwood Hills - 13 $ 0 $ 199,999 46 189 12.84 48 176 15.57 44 213 13.89 $ 200,000 $ 349,999 2 167 8.00 2 197 24.00 1 82 12.00 $ 350,000 $ 499,999 0 0 0.00 0 0 0.00 0 0 0.00 $ 500,000 $ 749,999 0 0 0.00 0 0 0.00 0 0 0.00 $ 750,000 $ 999,999 0 0 0.00 0 0 0.00 0 0 0.00 $ 1,000,000 $ 1,499,999 0 0 0.00 0 0 0.00 0 0 0.00 $ 1,500,000 and up 0 0 0.00 0 0 0.00 0 0 0.00 ALL 48 188 12.52 50 176 15.79 45 210 13.85 Cicero - 650 $ 0 $ 199,999 11 261 4.40 10 267 4.44 11 290 4.55 $ 200,000 $ 349,999 0 0 0.00 0 0 0.00 0 0 0.00 $ 350,000 $ 499,999 0 0 0.00 0 0 0.00 0 0 0.00 $ 500,000 $ 749,999 0 0 0.00 0 0 0.00 0 0 0.00 $ 750,000 $ 999,999 0 0 0.00 0 0 0.00 0 0 0.00 $ 1,000,000 $ 1,499,999 0 0 0.00 0 0 0.00 0 0 0.00 $ 1,500,000 and up 0 0 0.00 0 0 0.00 0 0 0.00 ALL 11 261 4.40 10 267 4.44 11 290 4.55 Data Source: MRED LLC (C) Copyright 2011, A.L. Wagner Appraisal Group, Inc. Midwest Real Estate Data, LLC www.WagnerAppraisal.com ~ (630) 416-6556 Page 5
  • 6. as of June 1, 2011 as of July 1, 2011 as of August 1, 2011 # Actives DOM Months Supply # Actives DOM Months Supply # Actives DOM Months Supply Clarendon Hills - 514 $ 0 $ 199,999 14 256 9.88 16 251 12.00 18 252 15.43 $ 200,000 $ 349,999 14 355 28.00 14 357 28.00 12 433 24.00 $ 350,000 $ 499,999 4 221 9.60 5 201 15.00 4 183 16.00 $ 500,000 $ 749,999 0 0 0.00 0 0 0.00 0 0 0.00 $ 750,000 $ 999,999 0 0 0.00 0 0 0.00 0 0 0.00 $ 1,000,000 $ 1,499,999 0 0 0.00 0 0 0.00 0 0 0.00 $ 1,500,000 and up 1 915 No Sales 1 945 No Sales 1 975 No Sales ALL 33 313 14.14 36 305 16.62 35 327 18.26 Countryside - 527 $ 0 $ 199,999 32 340 19.20 32 347 16.70 30 379 13.33 $ 200,000 $ 349,999 2 273 24.00 2 303 24.00 2 334 24.00 $ 350,000 $ 499,999 2 351 No Sales 2 381 No Sales 2 412 No Sales $ 500,000 $ 749,999 0 0 0.00 0 0 0.00 1 26 No Sales $ 750,000 $ 999,999 0 0 0.00 0 0 0.00 0 0 0.00 $ 1,000,000 $ 1,499,999 0 0 0.00 0 0 0.00 0 0 0.00 $ 1,500,000 and up 0 0 0.00 0 0 0.00 0 0 0.00 ALL 36 337 20.57 36 346 18.00 35 368 15.00 Crest Hill - 498 $ 0 $ 199,999 107 246 14.43 111 247 15.67 110 259 16.30 $ 200,000 $ 349,999 2 33 No Sales 3 45 No Sales 3 72 No Sales $ 350,000 $ 499,999 0 0 0.00 0 0 0.00 0 0 0.00 $ 500,000 $ 749,999 0 0 0.00 0 0 0.00 0 0 0.00 $ 750,000 $ 999,999 0 0 0.00 0 0 0.00 0 0 0.00 $ 1,000,000 $ 1,499,999 0 0 0.00 0 0 0.00 0 0 0.00 $ 1,500,000 and up 0 0 0.00 0 0 0.00 0 0 0.00 ALL 109 242 14.70 114 241 16.09 113 254 16.74 Crystal Lake, Lakewood, Prairie Grove - 14 $ 0 $ 199,999 122 268 13.56 122 269 13.81 128 277 14.22 $ 200,000 $ 349,999 14 320 28.00 15 308 60.00 15 357 60.00 $ 350,000 $ 499,999 2 264 No Sales 2 294 No Sales 1 179 No Sales $ 500,000 $ 749,999 0 0 0.00 0 0 0.00 0 0 0.00 $ 750,000 $ 999,999 0 0 0.00 0 0 0.00 0 0 0.00 $ 1,000,000 $ 1,499,999 0 0 0.00 0 0 0.00 0 0 0.00 $ 1,500,000 and up 0 0 0.00 0 0 0.00 0 0 0.00 ALL 138 273 14.53 139 274 15.30 144 284 15.57 Data Source: MRED LLC (C) Copyright 2011, A.L. Wagner Appraisal Group, Inc. Midwest Real Estate Data, LLC www.WagnerAppraisal.com ~ (630) 416-6556 Page 6
  • 7. as of June 1, 2011 as of July 1, 2011 as of August 1, 2011 # Actives DOM Months Supply # Actives DOM Months Supply # Actives DOM Months Supply Darien - 562 $ 0 $ 199,999 71 251 21.30 75 240 21.95 72 245 19.20 $ 200,000 $ 349,999 38 213 21.71 42 206 25.20 46 214 26.29 $ 350,000 $ 499,999 13 240 156.00 11 244 No Sales 10 268 No Sales $ 500,000 $ 749,999 0 0 0.00 0 0 0.00 0 0 0.00 $ 750,000 $ 999,999 0 0 0.00 0 0 0.00 0 0 0.00 $ 1,000,000 $ 1,499,999 0 0 0.00 0 0 0.00 0 0 0.00 $ 1,500,000 and up 0 0 0.00 0 0 0.00 0 0 0.00 ALL 122 238 23.61 128 229 25.18 128 236 23.27 Deerfield - 15 $ 0 $ 199,999 40 283 15.48 37 251 11.68 38 247 11.69 $ 200,000 $ 349,999 24 186 9.29 23 188 8.63 24 148 9.29 $ 350,000 $ 499,999 9 221 15.43 8 154 10.67 8 220 9.60 $ 500,000 $ 749,999 1 212 No Sales 1 242 No Sales 0 0 0.00 $ 750,000 $ 999,999 0 0 0.00 0 0 0.00 0 0 0.00 $ 1,000,000 $ 1,499,999 0 0 0.00 0 0 0.00 0 0 0.00 $ 1,500,000 and up 0 0 0.00 0 0 0.00 0 0 0.00 ALL 74 243 12.87 69 218 10.48 70 210 10.37 Des Plaines - 16 $ 0 $ 199,999 378 299 10.10 374 283 9.84 381 282 9.61 $ 200,000 $ 349,999 74 230 20.18 74 256 21.66 70 260 21.54 $ 350,000 $ 499,999 3 312 No Sales 4 481 No Sales 5 414 No Sales $ 500,000 $ 749,999 0 0 0.00 0 0 0.00 0 0 0.00 $ 750,000 $ 999,999 0 0 0.00 0 0 0.00 0 0 0.00 $ 1,000,000 $ 1,499,999 0 0 0.00 0 0 0.00 0 0 0.00 $ 1,500,000 and up 0 0 0.00 0 0 0.00 0 0 0.00 ALL 455 288 11.08 452 280 10.91 456 280 10.63 Downers Grove - 515 $ 0 $ 199,999 173 345 18.21 184 354 19.20 177 371 18.31 $ 200,000 $ 349,999 47 479 15.67 41 530 14.47 40 519 13.71 $ 350,000 $ 499,999 25 573 21.43 26 564 26.00 24 618 26.18 $ 500,000 $ 749,999 13 470 39.00 13 500 31.20 13 531 31.20 $ 750,000 $ 999,999 2 65 No Sales 2 95 No Sales 2 126 No Sales $ 1,000,000 $ 1,499,999 0 0 0.00 0 0 0.00 0 0 0.00 $ 1,500,000 and up 0 0 0.00 0 0 0.00 0 0 0.00 ALL 260 395 18.57 266 407 19.23 256 424 18.40 Data Source: MRED LLC (C) Copyright 2011, A.L. Wagner Appraisal Group, Inc. Midwest Real Estate Data, LLC www.WagnerAppraisal.com ~ (630) 416-6556 Page 7
  • 8. as of June 1, 2011 as of July 1, 2011 as of August 1, 2011 # Actives DOM Months Supply # Actives DOM Months Supply # Actives DOM Months Supply Dundee, East & West Dundee, Sleepy Hollow - 118 $ 0 $ 199,999 24 286 11.52 18 296 8.00 21 255 9.00 $ 200,000 $ 349,999 2 427 12.00 2 457 24.00 2 488 24.00 $ 350,000 $ 499,999 0 0 0.00 0 0 0.00 0 0 0.00 $ 500,000 $ 749,999 0 0 0.00 0 0 0.00 0 0 0.00 $ 750,000 $ 999,999 0 0 0.00 0 0 0.00 0 0 0.00 $ 1,000,000 $ 1,499,999 0 0 0.00 0 0 0.00 0 0 0.00 $ 1,500,000 and up 0 0 0.00 0 0 0.00 0 0 0.00 ALL 26 297 11.56 20 312 8.57 23 275 9.52 Elgin - 123 $ 0 $ 199,999 247 228 10.82 250 232 10.95 259 226 11.10 $ 200,000 $ 349,999 24 422 12.52 24 428 16.00 25 381 18.75 $ 350,000 $ 499,999 1 576 No Sales 1 606 No Sales 1 637 No Sales $ 500,000 $ 749,999 0 0 0.00 0 0 0.00 0 0 0.00 $ 750,000 $ 999,999 0 0 0.00 0 0 0.00 0 0 0.00 $ 1,000,000 $ 1,499,999 0 0 0.00 0 0 0.00 1 140 No Sales $ 1,500,000 and up 0 0 0.00 0 0 0.00 0 0 0.00 ALL 272 247 10.99 275 250 11.30 286 241 11.59 g Elk Grove Village - 7 $ 0 $ 199,999 151 265 12.24 143 279 11.59 141 288 11.21 $ 200,000 $ 349,999 28 242 28.00 24 197 32.00 28 147 42.00 $ 350,000 $ 499,999 0 0 0.00 0 0 0.00 0 0 0.00 $ 500,000 $ 749,999 0 0 0.00 0 0 0.00 0 0 0.00 $ 750,000 $ 999,999 0 0 0.00 0 0 0.00 0 0 0.00 $ 1,000,000 $ 1,499,999 0 0 0.00 0 0 0.00 0 0 0.00 $ 1,500,000 and up 0 0 0.00 0 0 0.00 0 0 0.00 ALL 179 261 13.43 167 267 12.76 169 265 12.75 Elmhurst - 126 $ 0 $ 199,999 52 341 26.00 50 342 24.00 52 347 24.96 $ 200,000 $ 349,999 18 277 9.00 17 285 10.74 17 326 10.74 $ 350,000 $ 499,999 7 156 12.00 6 168 9.00 4 176 5.33 $ 500,000 $ 749,999 3 55 12.00 6 53 24.00 7 75 28.00 $ 750,000 $ 999,999 0 0 0.00 0 0 0.00 0 0 0.00 $ 1,000,000 $ 1,499,999 0 0 0.00 0 0 0.00 0 0 0.00 $ 1,500,000 and up 0 0 0.00 0 0 0.00 0 0 0.00 ALL 80 300 16.55 79 295 17.24 80 311 17.14 Data Source: MRED LLC (C) Copyright 2011, A.L. Wagner Appraisal Group, Inc. Midwest Real Estate Data, LLC www.WagnerAppraisal.com ~ (630) 416-6556 Page 8
  • 9. as of June 1, 2011 as of July 1, 2011 as of August 1, 2011 # Actives DOM Months Supply # Actives DOM Months Supply # Actives DOM Months Supply Elmwood Park - 635 $ 0 $ 199,999 92 311 12.55 80 351 10.11 76 343 9.50 $ 200,000 $ 349,999 6 328 9.00 6 358 12.00 5 366 8.57 $ 350,000 $ 499,999 0 0 0.00 0 0 0.00 0 0 0.00 $ 500,000 $ 749,999 0 0 0.00 0 0 0.00 0 0 0.00 $ 750,000 $ 999,999 0 0 0.00 0 0 0.00 0 0 0.00 $ 1,000,000 $ 1,499,999 0 0 0.00 0 0 0.00 0 0 0.00 $ 1,500,000 and up 0 0 0.00 0 0 0.00 0 0 0.00 ALL 98 312 12.25 86 351 10.22 81 345 9.44 Evanston - 201 $ 0 $ 199,999 214 264 14.43 213 266 14.12 212 260 12.98 $ 200,000 $ 349,999 181 184 12.48 169 185 12.52 165 194 12.61 $ 350,000 $ 499,999 45 183 9.00 37 227 8.71 43 181 10.75 $ 500,000 $ 749,999 27 186 11.17 30 186 14.40 21 212 8.69 $ 750,000 $ 999,999 10 228 24.00 9 277 27.00 9 308 27.00 $ 1,000,000 $ 1,499,999 2 234 8.00 2 264 8.00 2 295 24.00 $ 1,500,000 and up 0 0 0.00 0 0 0.00 0 0 0.00 ALL 479 221 12.80 460 228 12.96 452 227 12.47 Flossmoor - 422 $ 0 $ 199,999 31 357 14.31 28 349 14.61 32 318 16.00 $ 200,000 $ 349,999 2 298 24.00 2 328 No Sales 1 655 No Sales $ 350,000 $ 499,999 0 0 0.00 0 0 0.00 0 0 0.00 $ 500,000 $ 749,999 0 0 0.00 0 0 0.00 0 0 0.00 $ 750,000 $ 999,999 0 0 0.00 0 0 0.00 0 0 0.00 $ 1,000,000 $ 1,499,999 0 0 0.00 0 0 0.00 0 0 0.00 $ 1,500,000 and up 0 0 0.00 0 0 0.00 0 0 0.00 ALL 33 354 14.67 30 348 15.65 33 328 16.50 Fox Lake - 20 $ 0 $ 199,999 87 237 14.30 86 242 13.40 84 230 12.44 $ 200,000 $ 349,999 7 166 84.00 5 163 60.00 3 113 36.00 $ 350,000 $ 499,999 0 0 0.00 0 0 0.00 0 0 0.00 $ 500,000 $ 749,999 0 0 0.00 0 0 0.00 0 0 0.00 $ 750,000 $ 999,999 0 0 0.00 0 0 0.00 0 0 0.00 $ 1,000,000 $ 1,499,999 0 0 0.00 0 0 0.00 0 0 0.00 $ 1,500,000 and up 0 0 0.00 0 0 0.00 0 0 0.00 ALL 94 232 15.24 91 238 14.00 87 226 12.73 Data Source: MRED LLC (C) Copyright 2011, A.L. Wagner Appraisal Group, Inc. Midwest Real Estate Data, LLC www.WagnerAppraisal.com ~ (630) 416-6556 Page 9
  • 10. as of June 1, 2011 as of July 1, 2011 as of August 1, 2011 # Actives DOM Months Supply # Actives DOM Months Supply # Actives DOM Months Supply Frankfort, Green Garden - 423 $ 0 $ 199,999 39 233 22.29 35 250 17.50 32 279 16.00 $ 200,000 $ 349,999 76 281 25.33 74 294 23.37 75 306 25.71 $ 350,000 $ 499,999 10 263 40.00 10 319 24.00 10 326 30.00 $ 500,000 $ 749,999 6 494 No Sales 3 602 No Sales 3 633 No Sales $ 750,000 $ 999,999 0 0 0.00 0 0 0.00 0 0 0.00 $ 1,000,000 $ 1,499,999 0 0 0.00 0 0 0.00 0 0 0.00 $ 1,500,000 and up 0 0 0.00 0 0 0.00 0 0 0.00 ALL 131 275 26.20 122 291 21.85 120 308 22.86 Geneva - 134 $ 0 $ 199,999 28 317 15.27 26 297 12.48 24 269 10.67 $ 200,000 $ 349,999 44 299 18.86 48 261 22.15 46 249 19.03 $ 350,000 $ 499,999 6 277 36.00 4 110 24.00 4 141 24.00 $ 500,000 $ 749,999 1 93 12.00 1 123 12.00 0 0 0.00 $ 750,000 $ 999,999 0 0 0.00 0 0 0.00 0 0 0.00 $ 1,000,000 $ 1,499,999 0 0 0.00 0 0 0.00 0 0 0.00 $ 1,500,000 and up 0 0 0.00 0 0 0.00 0 0 0.00 ALL 79 301 17.89 79 264 17.56 74 249 15.05 Gilberts - 136 $ 0 $ 199,999 47 155 11.75 45 153 11.02 42 154 10.96 $ 200,000 $ 349,999 6 630 2.88 6 660 2.88 6 691 6.55 $ 350,000 $ 499,999 0 0 0.00 0 0 0.00 0 0 0.00 $ 500,000 $ 749,999 0 0 0.00 0 0 0.00 0 0 0.00 $ 750,000 $ 999,999 0 0 0.00 0 0 0.00 0 0 0.00 $ 1,000,000 $ 1,499,999 0 0 0.00 0 0 0.00 0 0 0.00 $ 1,500,000 and up 0 0 0.00 0 0 0.00 0 0 0.00 ALL 53 209 8.71 51 213 8.27 48 221 10.11 Glen Ellyn - 137 $ 0 $ 199,999 84 321 15.51 82 320 14.69 76 330 13.82 $ 200,000 $ 349,999 25 351 15.00 27 331 17.05 22 349 13.20 $ 350,000 $ 499,999 13 120 19.50 14 112 28.00 11 152 16.50 $ 500,000 $ 749,999 4 232 4.36 5 359 6.67 5 390 6.67 $ 750,000 $ 999,999 1 721 4.00 0 0 0.00 0 0 0.00 $ 1,000,000 $ 1,499,999 0 0 0.00 0 0 0.00 0 0 0.00 $ 1,500,000 and up 0 0 0.00 0 0 0.00 0 0 0.00 ALL 127 306 14.24 128 301 14.77 114 319 12.91 Data Source: MRED LLC (C) Copyright 2011, A.L. Wagner Appraisal Group, Inc. Midwest Real Estate Data, LLC www.WagnerAppraisal.com ~ (630) 416-6556 Page 10
  • 11. as of June 1, 2011 as of July 1, 2011 as of August 1, 2011 # Actives DOM Months Supply # Actives DOM Months Supply # Actives DOM Months Supply Glendale Heights - 139 $ 0 $ 199,999 140 194 6.80 147 193 7.35 145 201 7.28 $ 200,000 $ 349,999 13 185 156.00 10 184 60.00 8 197 48.00 $ 350,000 $ 499,999 0 0 0.00 0 0 0.00 0 0 0.00 $ 500,000 $ 749,999 0 0 0.00 0 0 0.00 0 0 0.00 $ 750,000 $ 999,999 0 0 0.00 0 0 0.00 0 0 0.00 $ 1,000,000 $ 1,499,999 0 0 0.00 0 0 0.00 0 0 0.00 $ 1,500,000 and up 0 0 0.00 0 0 0.00 0 0 0.00 ALL 153 194 7.40 157 192 7.79 153 201 7.62 Glenview, Golf - 25 $ 0 $ 199,999 95 282 10.18 95 256 10.00 94 268 10.16 $ 200,000 $ 349,999 49 223 13.67 50 266 13.64 47 257 11.75 $ 350,000 $ 499,999 41 213 10.93 40 204 10.43 38 234 10.86 $ 500,000 $ 749,999 18 142 9.82 14 191 7.00 12 213 6.26 $ 750,000 $ 999,999 1 1 No Sales 1 31 12.00 1 62 12.00 $ 1,000,000 $ 1,499,999 0 0 0.00 0 0 0.00 0 0 0.00 $ 1,500,000 and up 0 0 0.00 0 0 0.00 0 0 0.00 ALL 204 240 11.03 200 242 10.48 192 254 10.24 Glenwood - 425 $ 0 $ 199,999 30 211 21.18 28 243 16.00 24 256 11.08 $ 200,000 $ 349,999 0 0 0.00 0 0 0.00 0 0 0.00 $ 350,000 $ 499,999 0 0 0.00 0 0 0.00 0 0 0.00 $ 500,000 $ 749,999 0 0 0.00 0 0 0.00 0 0 0.00 $ 750,000 $ 999,999 0 0 0.00 0 0 0.00 0 0 0.00 $ 1,000,000 $ 1,499,999 0 0 0.00 0 0 0.00 0 0 0.00 $ 1,500,000 and up 0 0 0.00 0 0 0.00 0 0 0.00 ALL 30 211 21.18 28 243 16.00 24 256 11.08 Grayslake, Gages Lake, Hainesville, Third Lake, Wildwood - 30 $ 0 $ 199,999 114 176 11.21 110 176 11.79 104 184 10.06 $ 200,000 $ 349,999 8 214 12.00 14 144 18.67 17 147 29.14 $ 350,000 $ 499,999 3 200 36.00 2 97 24.00 1 53 No Sales $ 500,000 $ 749,999 0 0 0.00 0 0 0.00 0 0 0.00 $ 750,000 $ 999,999 0 0 0.00 0 0 0.00 0 0 0.00 $ 1,000,000 $ 1,499,999 0 0 0.00 0 0 0.00 0 0 0.00 $ 1,500,000 and up 0 0 0.00 0 0 0.00 0 0 0.00 ALL 125 179 11.45 126 171 12.39 122 178 11.18 Data Source: MRED LLC (C) Copyright 2011, A.L. Wagner Appraisal Group, Inc. Midwest Real Estate Data, LLC www.WagnerAppraisal.com ~ (630) 416-6556 Page 11
  • 12. as of June 1, 2011 as of July 1, 2011 as of August 1, 2011 # Actives DOM Months Supply # Actives DOM Months Supply # Actives DOM Months Supply Gurnee - 31 $ 0 $ 199,999 105 259 11.35 105 256 11.35 100 274 10.71 $ 200,000 $ 349,999 16 213 27.43 12 230 18.00 13 236 39.00 $ 350,000 $ 499,999 0 0 0.00 0 0 0.00 0 0 0.00 $ 500,000 $ 749,999 0 0 0.00 0 0 0.00 0 0 0.00 $ 750,000 $ 999,999 0 0 0.00 0 0 0.00 0 0 0.00 $ 1,000,000 $ 1,499,999 0 0 0.00 0 0 0.00 0 0 0.00 $ 1,500,000 and up 0 0 0.00 0 0 0.00 0 0 0.00 ALL 121 253 12.31 117 253 11.80 113 270 11.69 Hanover Park - 103 $ 0 $ 199,999 145 197 8.70 142 193 8.78 140 193 8.94 $ 200,000 $ 349,999 9 157 13.50 6 135 9.00 5 128 7.50 $ 350,000 $ 499,999 0 0 0.00 0 0 0.00 0 0 0.00 $ 500,000 $ 749,999 0 0 0.00 0 0 0.00 0 0 0.00 $ 750,000 $ 999,999 0 0 0.00 0 0 0.00 0 0 0.00 $ 1,000,000 $ 1,499,999 0 0 0.00 0 0 0.00 0 0 0.00 $ 1,500,000 and up 0 0 0.00 0 0 0.00 0 0 0.00 ALL 154 194 8.88 148 191 8.79 145 191 8.88 g Highland Park - 35 $ 0 $ 199,999 15 366 8.57 15 346 11.25 20 305 13.33 $ 200,000 $ 349,999 34 321 18.55 30 317 18.00 29 354 17.40 $ 350,000 $ 499,999 15 310 12.86 19 290 19.00 21 269 25.20 $ 500,000 $ 749,999 16 304 17.45 14 327 14.00 15 299 13.85 $ 750,000 $ 999,999 10 77 30.00 11 122 33.00 10 129 20.00 $ 1,000,000 $ 1,499,999 1 331 No Sales 0 0 0.00 0 0 0.00 $ 1,500,000 and up 2 825 No Sales 1 1,342 No Sales 2 696 No Sales ALL 93 308 15.50 90 305 16.88 97 301 17.37 Hinsdale - 521 $ 0 $ 199,999 6 463 12.00 9 422 15.43 8 417 12.00 $ 200,000 $ 349,999 24 371 22.15 20 325 20.00 24 297 24.00 $ 350,000 $ 499,999 10 191 40.00 16 174 96.00 16 195 96.00 $ 500,000 $ 749,999 8 243 19.20 10 177 24.00 10 208 24.00 $ 750,000 $ 999,999 2 53 24.00 2 83 24.00 4 88 48.00 $ 1,000,000 $ 1,499,999 3 202 No Sales 3 232 No Sales 1 517 No Sales $ 1,500,000 and up 0 0 0.00 0 0 0.00 0 0 0.00 ALL 53 306 22.71 60 262 26.67 63 262 27.00 Data Source: MRED LLC (C) Copyright 2011, A.L. Wagner Appraisal Group, Inc. Midwest Real Estate Data, LLC www.WagnerAppraisal.com ~ (630) 416-6556 Page 12
  • 13. as of June 1, 2011 as of July 1, 2011 as of August 1, 2011 # Actives DOM Months Supply # Actives DOM Months Supply # Actives DOM Months Supply Hoffman Estates - 194 $ 0 $ 199,999 150 259 10.34 141 256 9.56 132 252 8.43 $ 200,000 $ 349,999 42 161 12.60 34 154 12.00 31 174 12.40 $ 350,000 $ 499,999 0 0 0.00 0 0 0.00 0 0 0.00 $ 500,000 $ 749,999 0 0 0.00 0 0 0.00 0 0 0.00 $ 750,000 $ 999,999 0 0 0.00 0 0 0.00 0 0 0.00 $ 1,000,000 $ 1,499,999 0 0 0.00 0 0 0.00 0 0 0.00 $ 1,500,000 and up 0 0 0.00 0 0 0.00 0 0 0.00 ALL 192 238 10.77 175 237 9.95 163 237 8.97 Homewood - 430 $ 0 $ 199,999 53 379 13.53 65 290 15.92 60 326 15.00 $ 200,000 $ 349,999 0 0 0.00 0 0 0.00 0 0 0.00 $ 350,000 $ 499,999 0 0 0.00 0 0 0.00 0 0 0.00 $ 500,000 $ 749,999 0 0 0.00 0 0 0.00 0 0 0.00 $ 750,000 $ 999,999 0 0 0.00 0 0 0.00 0 0 0.00 $ 1,000,000 $ 1,499,999 0 0 0.00 0 0 0.00 0 0 0.00 $ 1,500,000 and up 0 0 0.00 0 0 0.00 0 0 0.00 ALL 53 379 13.53 65 290 15.92 60 326 15.00 y Huntley - 142 $ 0 $ 199,999 60 318 8.00 54 319 7.04 58 294 7.33 $ 200,000 $ 349,999 2 201 No Sales 2 231 No Sales 1 362 No Sales $ 350,000 $ 499,999 0 0 0.00 0 0 0.00 0 0 0.00 $ 500,000 $ 749,999 0 0 0.00 0 0 0.00 0 0 0.00 $ 750,000 $ 999,999 0 0 0.00 0 0 0.00 0 0 0.00 $ 1,000,000 $ 1,499,999 0 0 0.00 0 0 0.00 0 0 0.00 $ 1,500,000 and up 0 0 0.00 0 0 0.00 0 0 0.00 ALL 62 314 8.27 56 316 7.30 59 296 7.45 Indian Head Park - 531 $ 0 $ 199,999 32 255 10.97 34 248 12.00 40 227 15.00 $ 200,000 $ 349,999 11 263 7.33 15 258 15.00 14 283 15.27 $ 350,000 $ 499,999 4 295 48.00 3 279 No Sales 3 310 No Sales $ 500,000 $ 749,999 0 0 0.00 0 0 0.00 0 0 0.00 $ 750,000 $ 999,999 0 0 0.00 0 0 0.00 0 0 0.00 $ 1,000,000 $ 1,499,999 0 0 0.00 0 0 0.00 0 0 0.00 $ 1,500,000 and up 0 0 0.00 0 0 0.00 0 0 0.00 ALL 47 260 10.25 52 253 13.28 57 245 15.55 Data Source: MRED LLC (C) Copyright 2011, A.L. Wagner Appraisal Group, Inc. Midwest Real Estate Data, LLC www.WagnerAppraisal.com ~ (630) 416-6556 Page 13
  • 14. as of June 1, 2011 as of July 1, 2011 as of August 1, 2011 # Actives DOM Months Supply # Actives DOM Months Supply # Actives DOM Months Supply Itasca - 143 $ 0 $ 199,999 7 390 5.25 11 282 7.33 14 210 11.20 $ 200,000 $ 349,999 33 230 15.84 33 244 16.50 26 284 13.00 $ 350,000 $ 499,999 8 299 No Sales 8 329 No Sales 7 396 No Sales $ 500,000 $ 749,999 0 0 0.00 0 0 0.00 0 0 0.00 $ 750,000 $ 999,999 0 0 0.00 0 0 0.00 0 0 0.00 $ 1,000,000 $ 1,499,999 0 0 0.00 0 0 0.00 0 0 0.00 $ 1,500,000 and up 0 0 0.00 0 0 0.00 0 0 0.00 ALL 48 265 14.05 52 265 14.86 47 278 14.46 Joliet - 499 $ 0 $ 199,999 211 238 14.89 212 239 15.42 195 246 13.15 $ 200,000 $ 349,999 21 279 126.00 23 284 276.00 22 314 132.00 $ 350,000 $ 499,999 0 0 0.00 0 0 0.00 0 0 0.00 $ 500,000 $ 749,999 0 0 0.00 0 0 0.00 0 0 0.00 $ 750,000 $ 999,999 0 0 0.00 0 0 0.00 0 0 0.00 $ 1,000,000 $ 1,499,999 0 0 0.00 0 0 0.00 0 0 0.00 $ 1,500,000 and up 0 0 0.00 0 0 0.00 0 0 0.00 ALL 232 241 16.19 235 243 16.99 217 253 14.47 g LaGrange - 525 $ 0 $ 199,999 37 280 18.50 35 276 15.56 32 297 16.00 $ 200,000 $ 349,999 16 242 14.77 16 264 14.77 16 257 16.00 $ 350,000 $ 499,999 1 782 1.71 1 812 3.00 2 426 6.00 $ 500,000 $ 749,999 0 0 0.00 0 0 0.00 0 0 0.00 $ 750,000 $ 999,999 0 0 0.00 0 0 0.00 0 0 0.00 $ 1,000,000 $ 1,499,999 0 0 0.00 0 0 0.00 1 28 No Sales $ 1,500,000 and up 0 0 0.00 0 0 0.00 0 0 0.00 ALL 54 278 14.73 52 283 14.18 51 285 15.30 Lake Bluff - 44 $ 0 $ 199,999 16 268 9.14 18 269 14.40 19 276 14.25 $ 200,000 $ 349,999 6 148 72.00 3 116 36.00 2 78 12.00 $ 350,000 $ 499,999 1 121 6.00 2 92 24.00 2 123 24.00 $ 500,000 $ 749,999 3 429 18.00 3 343 18.00 3 375 18.00 $ 750,000 $ 999,999 0 0 0.00 0 0 0.00 0 0 0.00 $ 1,000,000 $ 1,499,999 0 0 0.00 0 0 0.00 0 0 0.00 $ 1,500,000 and up 0 0 0.00 0 0 0.00 0 0 0.00 ALL 26 253 12.00 26 246 16.42 26 261 14.86 Data Source: MRED LLC (C) Copyright 2011, A.L. Wagner Appraisal Group, Inc. Midwest Real Estate Data, LLC www.WagnerAppraisal.com ~ (630) 416-6556 Page 14
  • 15. as of June 1, 2011 as of July 1, 2011 as of August 1, 2011 # Actives DOM Months Supply # Actives DOM Months Supply # Actives DOM Months Supply Lake Forest - 45 $ 0 $ 199,999 6 269 10.29 6 418 9.00 5 264 6.00 $ 200,000 $ 349,999 21 282 18.00 20 283 15.00 23 267 16.24 $ 350,000 $ 499,999 20 187 12.00 20 218 14.12 18 216 12.71 $ 500,000 $ 749,999 14 247 12.00 12 318 11.08 11 351 10.15 $ 750,000 $ 999,999 18 464 108.00 18 494 108.00 18 525 108.00 $ 1,000,000 $ 1,499,999 1 276 6.00 1 306 6.00 1 337 No Sales $ 1,500,000 and up 3 469 18.00 4 381 24.00 4 412 24.00 ALL 83 299 16.33 81 334 16.20 80 333 15.74 Lake In The Hills - 156 $ 0 $ 199,999 93 230 15.50 93 253 15.72 81 258 11.85 $ 200,000 $ 349,999 7 230 14.00 5 226 12.00 4 260 8.00 $ 350,000 $ 499,999 3 72 9.00 3 102 12.00 5 86 20.00 $ 500,000 $ 749,999 1 485 No Sales 1 515 No Sales 1 546 No Sales $ 750,000 $ 999,999 0 0 0.00 0 0 0.00 0 0 0.00 $ 1,000,000 $ 1,499,999 0 0 0.00 0 0 0.00 0 0 0.00 $ 1,500,000 and up 0 0 0.00 0 0 0.00 0 0 0.00 ALL 104 228 15.22 102 250 15.49 91 252 12.00 , Lake Villa, Lindenhurst - 46 $ 0 $ 199,999 39 226 16.14 36 225 14.40 31 164 11.27 $ 200,000 $ 349,999 2 182 12.00 2 212 12.00 2 243 24.00 $ 350,000 $ 499,999 0 0 0.00 0 0 0.00 0 0 0.00 $ 500,000 $ 749,999 0 0 0.00 0 0 0.00 0 0 0.00 $ 750,000 $ 999,999 0 0 0.00 0 0 0.00 0 0 0.00 $ 1,000,000 $ 1,499,999 0 0 0.00 0 0 0.00 0 0 0.00 $ 1,500,000 and up 0 0 0.00 0 0 0.00 0 0 0.00 ALL 41 224 15.87 38 224 14.25 33 169 11.65 Lemont - 439 $ 0 $ 199,999 6 306 4.80 5 324 5.00 6 276 8.00 $ 200,000 $ 349,999 26 404 14.86 24 434 13.71 25 382 13.04 $ 350,000 $ 499,999 16 257 21.33 16 261 24.00 10 242 13.33 $ 500,000 $ 749,999 0 0 0.00 0 0 0.00 0 0 0.00 $ 750,000 $ 999,999 0 0 0.00 0 0 0.00 0 0 0.00 $ 1,000,000 $ 1,499,999 0 0 0.00 0 0 0.00 0 0 0.00 $ 1,500,000 and up 0 0 0.00 0 0 0.00 0 0 0.00 ALL 48 343 12.80 45 360 13.17 41 332 12.00 Data Source: MRED LLC (C) Copyright 2011, A.L. Wagner Appraisal Group, Inc. Midwest Real Estate Data, LLC www.WagnerAppraisal.com ~ (630) 416-6556 Page 15
  • 16. as of June 1, 2011 as of July 1, 2011 as of August 1, 2011 # Actives DOM Months Supply # Actives DOM Months Supply # Actives DOM Months Supply Libertyville, Green Oaks - 48 $ 0 $ 199,999 36 157 25.41 35 171 22.11 35 169 19.09 $ 200,000 $ 349,999 30 265 25.71 29 251 29.00 30 272 30.00 $ 350,000 $ 499,999 10 256 60.00 9 295 54.00 7 341 84.00 $ 500,000 $ 749,999 1 234 No Sales 1 264 No Sales 1 295 No Sales $ 750,000 $ 999,999 1 44 No Sales 1 74 No Sales 1 105 No Sales $ 1,000,000 $ 1,499,999 0 0 0.00 0 0 0.00 0 0 0.00 $ 1,500,000 and up 0 0 0.00 0 0 0.00 0 0 0.00 ALL 78 211 28.36 75 217 27.27 74 228 25.37 Lisle - 532 $ 0 $ 199,999 119 256 9.04 104 258 8.10 103 224 7.87 $ 200,000 $ 349,999 36 259 22.74 34 284 22.67 30 316 20.00 $ 350,000 $ 499,999 6 627 No Sales 6 657 No Sales 7 689 No Sales $ 500,000 $ 749,999 2 350 24.00 2 380 24.00 1 130 12.00 $ 750,000 $ 999,999 0 0 0.00 0 0 0.00 0 0 0.00 $ 1,000,000 $ 1,499,999 0 0 0.00 0 0 0.00 0 0 0.00 $ 1,500,000 and up 0 0 0.00 0 0 0.00 0 0 0.00 ALL 163 271 10.99 146 282 10.13 141 266 9.61 p , p Lockport, Homer Township - 495 $ 0 $ 199,999 91 275 14.00 92 284 15.55 96 283 16.46 $ 200,000 $ 349,999 17 433 22.67 19 416 45.60 16 465 38.40 $ 350,000 $ 499,999 1 895 No Sales 1 925 No Sales 1 956 No Sales $ 500,000 $ 749,999 0 0 0.00 0 0 0.00 0 0 0.00 $ 750,000 $ 999,999 0 0 0.00 0 0 0.00 0 0 0.00 $ 1,000,000 $ 1,499,999 0 0 0.00 0 0 0.00 0 0 0.00 $ 1,500,000 and up 0 0 0.00 0 0 0.00 0 0 0.00 ALL 109 305 15.03 112 312 17.68 113 314 18.08 Lombard - 148 $ 0 $ 199,999 142 262 12.72 140 260 12.00 138 256 11.58 $ 200,000 $ 349,999 45 189 21.60 43 187 17.79 34 211 13.16 $ 350,000 $ 499,999 1 718 No Sales 1 748 No Sales 0 0 0.00 $ 500,000 $ 749,999 0 0 0.00 0 0 0.00 0 0 0.00 $ 750,000 $ 999,999 0 0 0.00 0 0 0.00 0 0 0.00 $ 1,000,000 $ 1,499,999 0 0 0.00 0 0 0.00 0 0 0.00 $ 1,500,000 and up 0 0 0.00 0 0 0.00 0 0 0.00 ALL 188 247 14.19 184 246 13.07 172 247 11.86 Data Source: MRED LLC (C) Copyright 2011, A.L. Wagner Appraisal Group, Inc. Midwest Real Estate Data, LLC www.WagnerAppraisal.com ~ (630) 416-6556 Page 16
  • 17. as of June 1, 2011 as of July 1, 2011 as of August 1, 2011 # Actives DOM Months Supply # Actives DOM Months Supply # Actives DOM Months Supply Long Grove, Lake Zurich, Hawthorn Woods, Kildeer - 47 $ 0 $ 199,999 8 68 5.65 10 80 8.00 9 127 6.75 $ 200,000 $ 349,999 16 318 11.29 17 328 13.60 15 378 11.25 $ 350,000 $ 499,999 5 458 20.00 4 592 16.00 3 487 12.00 $ 500,000 $ 749,999 0 0 0.00 0 0 0.00 0 0 0.00 $ 750,000 $ 999,999 0 0 0.00 0 0 0.00 0 0 0.00 $ 1,000,000 $ 1,499,999 0 0 0.00 0 0 0.00 0 0 0.00 $ 1,500,000 and up 0 0 0.00 0 0 0.00 0 0 0.00 ALL 29 273 9.41 31 282 11.27 27 306 9.26 Lyons - 534 $ 0 $ 199,999 14 316 6.72 15 383 7.83 13 414 6.50 $ 200,000 $ 349,999 0 0 0.00 0 0 0.00 1 776 No Sales $ 350,000 $ 499,999 0 0 0.00 0 0 0.00 0 0 0.00 $ 500,000 $ 749,999 0 0 0.00 0 0 0.00 0 0 0.00 $ 750,000 $ 999,999 0 0 0.00 0 0 0.00 0 0 0.00 $ 1,000,000 $ 1,499,999 0 0 0.00 0 0 0.00 0 0 0.00 $ 1,500,000 and up 0 0 0.00 0 0 0.00 0 0 0.00 ALL 14 316 6.72 15 383 7.83 14 440 7.00 y, , , g , y , g McHenry, Lake Moor, McCullom Lake, Ringwood, Sunnyside, Johnsburg - 50 $ 0 $ 199,999 102 316 11.77 101 344 11.88 97 367 11.19 $ 200,000 $ 349,999 3 39 12.00 6 52 24.00 5 73 20.00 $ 350,000 $ 499,999 0 0 0.00 0 0 0.00 0 0 0.00 $ 500,000 $ 749,999 0 0 0.00 0 0 0.00 0 0 0.00 $ 750,000 $ 999,999 0 0 0.00 0 0 0.00 0 0 0.00 $ 1,000,000 $ 1,499,999 0 0 0.00 0 0 0.00 0 0 0.00 $ 1,500,000 and up 0 0 0.00 0 0 0.00 0 0 0.00 ALL 105 308 11.78 107 328 12.23 102 352 11.44 Melrose Park - 160 $ 0 $ 199,999 17 267 12.00 17 265 11.33 18 258 11.37 $ 200,000 $ 349,999 1 1,665 12.00 1 1,695 12.00 2 872 24.00 $ 350,000 $ 499,999 1 1,062 No Sales 0 0 0.00 0 0 0.00 $ 500,000 $ 749,999 0 0 0.00 0 0 0.00 0 0 0.00 $ 750,000 $ 999,999 0 0 0.00 0 0 0.00 0 0 0.00 $ 1,000,000 $ 1,499,999 0 0 0.00 0 0 0.00 0 0 0.00 $ 1,500,000 and up 0 0 0.00 0 0 0.00 0 0 0.00 ALL 19 383 12.67 18 345 11.37 20 320 12.00 Data Source: MRED LLC (C) Copyright 2011, A.L. Wagner Appraisal Group, Inc. Midwest Real Estate Data, LLC www.WagnerAppraisal.com ~ (630) 416-6556 Page 17
  • 18. as of June 1, 2011 as of July 1, 2011 as of August 1, 2011 # Actives DOM Months Supply # Actives DOM Months Supply # Actives DOM Months Supply Mokena - 448 $ 0 $ 199,999 29 150 12.43 29 164 11.60 31 176 11.63 $ 200,000 $ 349,999 37 177 11.68 40 224 16.00 35 240 14.48 $ 350,000 $ 499,999 4 524 No Sales 2 207 No Sales 2 148 24.00 $ 500,000 $ 749,999 0 0 0.00 0 0 0.00 0 0 0.00 $ 750,000 $ 999,999 0 0 0.00 0 0 0.00 0 0 0.00 $ 1,000,000 $ 1,499,999 0 0 0.00 0 0 0.00 0 0 0.00 $ 1,500,000 and up 0 0 0.00 0 0 0.00 0 0 0.00 ALL 70 186 12.73 71 199 14.20 68 208 13.16 Montgomery - 538 $ 0 $ 199,999 48 186 6.62 45 181 5.68 45 160 5.51 $ 200,000 $ 349,999 0 0 0.00 0 0 0.00 0 0 0.00 $ 350,000 $ 499,999 0 0 0.00 0 0 0.00 0 0 0.00 $ 500,000 $ 749,999 0 0 0.00 0 0 0.00 0 0 0.00 $ 750,000 $ 999,999 0 0 0.00 0 0 0.00 0 0 0.00 $ 1,000,000 $ 1,499,999 0 0 0.00 0 0 0.00 0 0 0.00 $ 1,500,000 and up 0 0 0.00 0 0 0.00 0 0 0.00 ALL 48 186 6.62 45 181 5.68 45 160 5.51 Morton Grove - 53 $ 0 $ 199,999 68 308 16.00 65 324 16.96 58 338 12.43 $ 200,000 $ 349,999 37 282 13.45 30 306 11.25 32 304 11.64 $ 350,000 $ 499,999 5 460 30.00 4 557 24.00 3 758 18.00 $ 500,000 $ 749,999 0 0 0.00 0 0 0.00 0 0 0.00 $ 750,000 $ 999,999 0 0 0.00 0 0 0.00 0 0 0.00 $ 1,000,000 $ 1,499,999 0 0 0.00 0 0 0.00 0 0 0.00 $ 1,500,000 and up 0 0 0.00 0 0 0.00 0 0 0.00 ALL 110 306 15.35 99 328 14.85 93 340 12.26 Mount Prospect - 56 $ 0 $ 199,999 134 264 8.79 139 264 9.11 141 268 9.25 $ 200,000 $ 349,999 37 253 15.86 37 243 17.08 33 247 13.66 $ 350,000 $ 499,999 4 437 16.00 3 519 12.00 2 703 8.00 $ 500,000 $ 749,999 0 0 0.00 0 0 0.00 0 0 0.00 $ 750,000 $ 999,999 0 0 0.00 0 0 0.00 0 0 0.00 $ 1,000,000 $ 1,499,999 0 0 0.00 0 0 0.00 0 0 0.00 $ 1,500,000 and up 0 0 0.00 0 0 0.00 0 0 0.00 ALL 175 266 9.81 179 264 10.13 176 269 9.82 Data Source: MRED LLC (C) Copyright 2011, A.L. Wagner Appraisal Group, Inc. Midwest Real Estate Data, LLC www.WagnerAppraisal.com ~ (630) 416-6556 Page 18
  • 19. as of June 1, 2011 as of July 1, 2011 as of August 1, 2011 # Actives DOM Months Supply # Actives DOM Months Supply # Actives DOM Months Supply Mundelein - 60 $ 0 $ 199,999 69 231 12.18 68 192 11.83 65 213 11.14 $ 200,000 $ 349,999 14 407 18.67 11 446 16.50 9 562 15.43 $ 350,000 $ 499,999 3 745 No Sales 1 13 No Sales 2 24 No Sales $ 500,000 $ 749,999 0 0 0.00 0 0 0.00 0 0 0.00 $ 750,000 $ 999,999 0 0 0.00 0 0 0.00 0 0 0.00 $ 1,000,000 $ 1,499,999 0 0 0.00 0 0 0.00 0 0 0.00 $ 1,500,000 and up 0 0 0.00 0 0 0.00 0 0 0.00 ALL 86 278 13.40 80 224 12.47 76 249 11.84 Naperville - 540 $ 0 $ 199,999 295 227 12.04 283 224 12.09 260 244 10.58 $ 200,000 $ 349,999 129 198 12.90 128 185 13.24 118 194 11.90 $ 350,000 $ 499,999 23 265 15.33 22 269 13.20 19 344 12.00 $ 500,000 $ 749,999 10 503 15.00 15 348 20.00 15 344 25.71 $ 750,000 $ 999,999 1 263 No Sales 1 293 No Sales 0 0 0.00 $ 1,000,000 $ 1,499,999 0 0 0.00 0 0 0.00 0 0 0.00 $ 1,500,000 and up 0 0 0.00 0 0 0.00 0 0 0.00 ALL 458 227 12.49 449 219 12.65 412 238 11.24 New Lenox - 451 $ 0 $ 199,999 40 197 17.78 41 189 18.92 42 203 20.16 $ 200,000 $ 349,999 50 365 54.55 45 414 49.09 42 459 38.77 $ 350,000 $ 499,999 0 0 0.00 0 0 0.00 0 0 0.00 $ 500,000 $ 749,999 0 0 0.00 0 0 0.00 0 0 0.00 $ 750,000 $ 999,999 0 0 0.00 0 0 0.00 0 0 0.00 $ 1,000,000 $ 1,499,999 0 0 0.00 0 0 0.00 0 0 0.00 $ 1,500,000 and up 0 0 0.00 0 0 0.00 0 0 0.00 ALL 90 290 28.42 86 307 27.89 84 331 26.53 Niles - 648 $ 0 $ 199,999 85 236 9.19 78 249 8.14 78 252 8.00 $ 200,000 $ 349,999 24 240 22.15 25 256 25.00 24 293 22.15 $ 350,000 $ 499,999 0 0 0.00 0 0 0.00 0 0 0.00 $ 500,000 $ 749,999 0 0 0.00 0 0 0.00 0 0 0.00 $ 750,000 $ 999,999 0 0 0.00 0 0 0.00 0 0 0.00 $ 1,000,000 $ 1,499,999 0 0 0.00 0 0 0.00 0 0 0.00 $ 1,500,000 and up 0 0 0.00 0 0 0.00 0 0 0.00 ALL 109 237 10.55 103 251 9.73 102 261 9.42 Data Source: MRED LLC (C) Copyright 2011, A.L. Wagner Appraisal Group, Inc. Midwest Real Estate Data, LLC www.WagnerAppraisal.com ~ (630) 416-6556 Page 19