APHA Webinar Slides
•Descargar como PPTX, PDF•
0 recomendaciones•159 vistas

Slides for Bob

Recomendados
Recomendados
Más contenido relacionado
La actualidad más candente
La actualidad más candente (20)
Destacado
Destacado (12)
Similar a APHA Webinar Slides
Similar a APHA Webinar Slides (20)
Último
Último (20)
APHA Webinar Slides
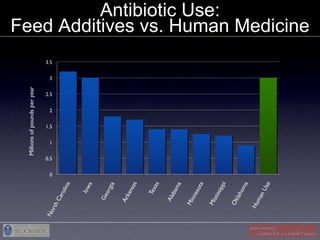
- 1. Antibiotic Use: Feed Additives vs. Human Medicine
- 2. Externalitie • Not included in retail price or in s analyses of productivity • Externalities include: – Depletion of resources—e.g., fossil fuel, water, soil, and biodiversity – Pollution of resources by the products of fuel combustion, pesticides and fertilizers – Economic, social and health costs to communities—e.g., lost property values, lost QALYs • External costs seldom accounted for in the food’s price
- 3. Horizontal gene transfer from Fuyura, Nature Reviews Microbiology, 2006
- 4. Why do processed foods cost less than healthy foods?
- 5. Global Hunger & Malnutrition
- 6. GHG Emissions from Food
- 7. Antibiotic Use: Feed Additives vs. Human Medicine
- 8. Produce Contamination and Human Illness • 76 million cases of foodborne illness in the U.S. per year (Mead et al., 1999) • Foodborne illness associated with produce is increasing over time
- 9. Environmental • Water consumed at Impacts unsustainable rates • Synthetic chemical pesticides and fertilizers pollute soil, water, and air • Soil eroding much faster than it can be replenished • Monocultures erode biodiversity among both plants and animals
- 10. Plant-Based Diets vs. Diets with Animal Protein … 9.5–10 billion people … 6.2 billion people A grain-based diet could feed … An ―American-style‖ diet high in … 2.5 billion … 3.5–4 billion animal protein could feed … people people
- 11. Global Meat Consumption 82% Increase Since 1961 Source: Food and Agriculture Organization of the United Nations (FAO)
- 12. U.S. Meat Consumption Growth Continues *Data for 2005 is an estimate; data for 2006-2007 are projections ^Excluding veal Source: USDA, Economic Research Service
- 13. Meat Consumption in America Meat consumption comparison (pounds per person per year)
- 14. The link between diet and health Diets high in meat and saturated fat increase our risk for heart disease, stroke, cancer and diabetes. Typical American meal high in fat and saturated fat Diets high in fruit, vegetables, whole grains, beans and low-fat dairy foods help prevent these same Healthy, low-fat meal diseases.
- 15. Produce Contamination and Human Illness • Approx. 48 million cases of foodborne illness in the U.S. per year (CDC estimates) • Foodborne illness associated with produce is increasing over time
- 16. Meat Consumption Continues to Increase in US U.S Per Capita Meat Consumption 1950 - 2007* . 300 Retail cut equiv./lb. per person 225 Total 150 Chicken 75 Beef^ Pork Turkey 0 Veal 1950 1960 1970 1980 1990 2000 2002 2004 2006* *Data for 2005 is an estimate; data for 2006-2007 are projections ^Excluding veal Source: US DA, Economic Research S vice er
Notas del editor
- Atur