SlideShare una empresa de Scribd logo
1 de 232
Descargar para leer sin conexión
CONFIDENTIAL OFFERING MEMORANDUM
28,333,000 Common Shares
Offer Price: R$11.00 per Common Share
We, Cia. Hering, are offering 20,833,000 of our common shares, and the selling shareholder, Socinvest Finance
S.A., is offering an aggregate of 7,500,000 of our common shares, in each case to the public in Brazil, to qualified
institutional buyers in the United States and to institutional and other investors elsewhere.
We have registered this offering with the Brazilian Securities Commission (Comissão de Valores Mobiliários), or
the CVM. Our common shares are listed on the Novo Mercado segment of the São Paulo Stock Exchange (Bolsa de
Valores de São Paulo), or the BOVESPA, under the symbol “HGTX3.” The ISIN number for our common shares is
BRMGTXACNOR9. Neither the CVM, the U.S. Securities and Exchange Commission, or the SEC, nor any other
regulatory authority has approved or disapproved these securities or determined if this offering memorandum (or the
Portuguese-language prospectus used in connection with the offering of our common shares in Brazil) is accurate or
complete. Any representation to the contrary is a criminal offense.
We will not receive any proceeds from the offering of our common shares by the selling shareholder.
We have granted to Banco Itaú BBA S.A. an option, excercisable upon consultation with Banco Santander Banespa
S.A., to place up to an additional 4,249,950 common shares at the offering price, representing up to 15% of the
common shares initially offered hereby, to cover over-allotments, if any, for a period of up to 30 days from the date
of the publication of the announcement in Brazil of the commencement of this offering.
This offering of our common shares has not been and will not be registered under the U.S. Securities Act of 1933, as
amended, or the Securities Act, or under any U.S. state securities laws. Accordingly, our common shares are being
offered in the United States only to qualified institutional buyers as defined in Rule 144A under the Securities Act,
or Rule 144A, pursuant to exemptions from registration provided under the Securities Act, the rules thereunder and
to certain non-US persons outside the United States in accordance with Regulation S under the Securities Act, or
Regulation S. By purchasing our common shares in the United States, you will be deemed to have represented to us
that you are a qualified institutional buyer. See “Transfer restrictions” on page 140 for a description of restrictions
on transfers of our common shares.
Investors residing outside Brazil may purchase our common shares if they comply with the registration
requirements of CVM Instruction No. 325, dated January 27, 2000, and Resolution No. 2,689, dated
January 26, 2000, of the Brazilian National Monetary Council (Conselho Monetário Nacional), or CMN, as
amended.
Investing in our common shares involves risks. See “Risk factors” beginning on page 15 for a discussion of
certain factors you should consider before investing in our common shares.
Payment for our common shares must be made in reais through the Brazilian Settlement and Custodial Company
(Companhia Brasileira de Liquidação e Custódia), or CBLC. It is expected that our common shares will be
delivered through the CBLC on or about July 25, 2007. See “Market information.”
Joint Bookrunners
Banco Itaú BBA Santander Investment
Co-managers
BB Investimentos Banco Fator Safra
The date of this offering memorandum is July 19, 2007
You should only rely on the information contained in this offering memorandum. Neither we, the selling
shareholder, the Brazilian underwriters nor the agents appointed by the Brazilian underwriters to
facilitate the placement of common shares outside of Brazil, or the agents, have authorized anyone to
provide you with information that is different or additional from that contained in this offering
memorandum. If anyone provides you with different or additional information, you should not rely on it.
You should assume that the information in this offering memorandum is accurate only as of the date on
the front cover of this offering memorandum, regardless of time of delivery of this offering memorandum
or any sale of our common shares. Our business, financial condition, results of operations and prospects
may change after the date on the front cover of this offering memorandum. Neither we, the selling
shareholder, the Brazilian underwriters nor the agents is making an offer to sell the common shares in any
jurisdiction where the offer or sale is not permitted.
This offering memorandum is highly confidential, and we have prepared it for use solely in connection with the
proposed offering of our common shares outside Brazil. This offering memorandum is personal to the offeree to
whom it has been delivered by the Brazilian underwriters or the agents and does not constitute an offer to any
other person or to the public in general to subscribe for or otherwise to acquire our common shares. Distribution
of this offering memorandum to any person other than the offeree and those persons, if any, retained to advise
that offeree with respect thereto is unauthorized, and any disclosure of any of its contents without our prior
written consent is prohibited. Each offeree, by accepting delivery of this offering memorandum, agrees to the
foregoing and agrees to make no photocopies of this offering memorandum, in whole or in part.
Neither the SEC, any state securities commission nor any other regulatory authority has approved or
disapproved the securities nor have any of the foregoing authorities passed upon or endorsed the merits of
this offering or the accuracy or adequacy of this offering memorandum. Any representation to the
contrary is a criminal offense.
We and the selling shareholder are relying on an exemption from registration under the Securities Act for offers
and sales of securities that do not involve a public offering. Our common shares offered through this offering
memorandum are subject to restrictions on transferability and resale and may not be transferred or resold in the
United States except as permitted under the Securities Act and applicable U.S. state securities laws pursuant to
registration or exemption from them. By purchasing the common shares, you will be deemed to have made the
acknowledgements, representations and warranties and agreements described under the heading “Transfer
restrictions” in this offering memorandum. You should be aware that you may be required to bear the financial
risks of this investment for an indefinite period of time. In making an investment decision, you must rely on your
own examination of our business and the terms of this offering, including the merits and risks involved.
Investors residing outside Brazil, including institutional investors, may purchase or sell our common shares if
they comply with the registration requirements of CVM Instruction No. 325, dated January 27, 2000, and
Resolution No. 2,689, dated January 26, 2000, of the CMN. See “Market information.”
You must comply with all applicable laws and regulations in force in any jurisdiction in which you purchase,
offer or sell our common shares or possess or distribute this offering memorandum and must obtain any consent,
approval or permission required for your purchase, offer or sale of our common shares under the laws and
regulations in force in any jurisdiction to which you are subject or in which you make such purchases, offers or
sales, and neither we, the selling shareholder, the Brazilian underwriters nor the agents will have any
responsibility therefor.
We, the selling shareholder, the Brazilian underwriters and the agents reserve the right to reject any offer to
purchase, in whole or in part, and for any reason, our common shares offered hereby. We, the selling shareholder,
the Brazilian underwriters and the agents also reserve the right to sell or place less than all of our common shares
offered hereby.
i
In any Member State of the European Economic Area, or EEA, that has implemented Directive 2003/71/EC
(together with any applicable implementing measures in any Member State, the Prospectus Directive), this
communication is only addressed to and is only directed at qualified investors in that Member State within the
meaning of the Prospectus Directive.
This offering memorandum has been prepared on the basis that all offers of our common shares will be made
pursuant to an exemption under the Prospectus Directive, as implemented in Member States of the EEA, from the
requirement to produce a prospectus for offers of our common shares. Accordingly any person making or
intending to make any offer within the EEA of our common shares, which are the subject of the offer
contemplated in this offering memorandum should only do so in circumstances in which no obligation arises for
us, the selling shareholder, or any of the Brazilian underwriters or agents to produce a prospectus for such offer.
Neither we, the selling shareholder nor the Brazilian underwriters or agents have authorized, nor do they
authorize, the making of any offer of our common shares through any financial intermediary, other than offers
made by underwriters which constitute the final placement of our common shares contemplated in this offering
memorandum.
Each person in a Member State of the EEA which has implemented the Prospectus Directive (each, a Relevant
Member State) who receives any communication in respect of, or who acquires any of our common shares under,
the offers contemplated in this offering memorandum will be deemed to have represented, warranted and agreed
to and with each Brazilian underwriter, agent, us and the selling shareholder that:
➢ it is a qualified investor within the meaning of the law in that Relevant Member State implementing
Article 2(1)(e) of the Prospectus Directive; and
➢ in the case of any common shares acquired by it as a financial intermediary, as that term is used in
Article 3(2) of the Prospectus Directive, (i) the common shares acquired by it in the offer have not been
acquired on behalf of, nor have they been acquired with a view to their offer or resale to, persons in any
Relevant Member State other than qualified investors, as that term is defined in the Prospectus Directive, or
in circumstances in which the prior consent of the global coordinator has been given to the offer or resale; or
(ii) where common shares have been acquired by it on behalf of persons in any Relevant Member State other
than qualified investors, the offer of those common shares to it is not treated under the Prospectus Directive
as having been made to such persons.
For the purposes of this representation, the expression an “offer” in relation to any common shares in any
Relevant Member State means the communication in any form and by any means of sufficient information on the
terms of the offer and any common shares to be offered so as to enable an investor to decide to purchase or
subscribe for our common shares, as the same may be varied in that Relevant Member State by any measure
implementing the Prospectus Directive in that Relevant Member State.
This document is being distributed and is only directed at persons who (i) are outside the United Kingdom, or
(ii) are investment professionals under Article 19(5) of the Financial Services and Markets Act of 2000
(Financial Promotion) Order 2005, or the Order, or (iii) are high net worth entities and other persons to whom it
may lawfully be communicated, falling under Article 49(2)(a) to (d), all such persons together being referred to
as relevant persons. The common shares are only available to, and any invitation, offer or agreement to
subscribe, purchase or acquire such common shares will only be engaged in with relevant persons. Any person
who is not a relevant person should not act or rely on this document or any of its contents.
This offering is being made in Brazil by a prospectus in Portuguese with the same date as this offering
memorandum. The Brazilian prospectus, which has been filed with the CVM, is in a format different from that of
this offering memorandum and contains certain information generally not included in documents such as this
one. This offering is made in the United States and elsewhere outside Brazil solely on the basis of the
information contained in this offering memorandum and you should take this information into account when
making an investment decision.
ii
In connection with this offering, Banco Itaú BBA S.A., acting through Itaú Corretora de Valores S.A., by joint
decision with Banco Santander Banespa S.A., may over-allot or effect transactions with a view to supporting the
market price of our common shares at a level higher than that which might otherwise prevail. However, there is
no assurance that Banco Itaú BBA S.A. or Itaú Corretora de Valores S.A. will engage in such transactions. Such
stabilizing activities, if commenced, may be discontinued at any time and must be brought to an end after a
limited period. Such stabilizing shall be in compliance with all applicable laws, regulations and rules. See “Plan
of distribution.”
We and the selling shareholder are not, and the Brazilian underwriters and the agents are not, making any
representation, express or implied, to any purchaser of the securities regarding the legality of an investment in the
securities by such purchaser under any legal investment or similar laws or regulations. You should not consider
any information in this offering memorandum to be legal, business or tax advice. You should consult your own
attorney, business advisor and tax advisor for legal, business and tax advice regarding an investment in the
securities. No representation or warranty, express or implied, is made by the Brazilian underwriters or the agents
as to the accuracy or completeness of any of the information set out in this offering memorandum, and nothing
contained herein is or shall be relied upon as a promise or representation by the Brazilian underwriters or the
agents, whether as to the past or the future. See “Forward-looking statements.”
Notice to investors
Notwithstanding anything to the contrary contained in this offering memorandum, except as reasonably
necessary to comply with applicable securities laws, all persons may disclose to any and all persons, without
limitation of any kind, the U.S. federal, state and local income tax treatment of the offering, any fact relevant to
understanding the U.S. federal, state and local income tax treatment of the offering and all materials of any kind
(including opinions or other tax analyses) relating to such U.S. federal, state and local income tax treatment;
provided that no person may disclose the name of or identifying information with respect to any party identified
herein or any pricing terms or other nonpublic business or financial information that is unrelated to the U.S.
federal, state and local income tax treatment of the offering and is not relevant to understanding the U.S. federal,
state and local income tax treatment of the offering.
Notice to New Hampshire residents
Neither the fact that a registration statement or an application for a license has been filed under RSA
421-B with the State of New Hampshire nor the fact that a security is effectively registered or a person is
licensed in the State of New Hampshire implies that any document filed under RSA 421-B is true, complete
and not misleading. Neither any such fact nor the fact that an exemption or exception is available for a
security or a transaction means that the Secretary of State of the State of New Hampshire has passed in
any way upon the merits or qualifications of, or recommended or given approval to, any person, security
or transaction. It is unlawful to make, or cause to be made, to any prospective purchaser, customer or
client any representation inconsistent with the provisions of this paragraph.
iii
Internal Revenue Service Circular 230 Disclosure
Pursuant to Internal Revenue Service Circular 230, we hereby inform you that the description set forth
herein with respect to U.S. federal tax issues was not intended or written to be used, and such description
cannot be used, by any taxpayer for the purpose of avoiding any penalties that may be imposed on the
taxpayer under the U.S. Internal Revenue Code. Such description was written to support the marketing of
the common shares. Taxpayers should seek advice based on the taxpayer’s particular circumstances from
an independent tax advisor.
iv
TABLE OF CONTENTS
Page
Forward-looking statements . . . . . . . . . . . . . . . vi
Presentation of financial and other
information . . . . . . . . . . . . . . . . . . . . . . . . . . vii
Summary . . . . . . . . . . . . . . . . . . . . . . . . . . . . . . 1
Risk factors . . . . . . . . . . . . . . . . . . . . . . . . . . . . 15
Use of proceeds . . . . . . . . . . . . . . . . . . . . . . . . . 24
Market information . . . . . . . . . . . . . . . . . . . . . . 25
Exchange rates and exchange controls . . . . . . . 30
Capitalization . . . . . . . . . . . . . . . . . . . . . . . . . . 32
Dilution . . . . . . . . . . . . . . . . . . . . . . . . . . . . . . . 33
Selected financial and other information . . . . . 35
Management’s discussion and analysis of
financial condition and results of
operations . . . . . . . . . . . . . . . . . . . . . . . . . . . 41
Overview of the retail and apparel industry in
Brazil . . . . . . . . . . . . . . . . . . . . . . . . . . . . . . . 69
Page
Business . . . . . . . . . . . . . . . . . . . . . . . . . . . . . . 75
Management . . . . . . . . . . . . . . . . . . . . . . . . . . . 100
Principal shareholders and selling shareholder 107
Related party transactions . . . . . . . . . . . . . . . . . 110
Description of capital stock . . . . . . . . . . . . . . . 111
Dividends and dividend policy . . . . . . . . . . . . . 124
Taxation . . . . . . . . . . . . . . . . . . . . . . . . . . . . . . 128
Certain ERISA considerations . . . . . . . . . . . . . 135
Plan of distribution . . . . . . . . . . . . . . . . . . . . . . 136
Transfer restrictions . . . . . . . . . . . . . . . . . . . . . 139
Legal matters . . . . . . . . . . . . . . . . . . . . . . . . . . 143
Independent accountants . . . . . . . . . . . . . . . . . . 143
Enforcement of foreign judgments and service
of process . . . . . . . . . . . . . . . . . . . . . . . . . . . 145
Index to financial statements . . . . . . . . . . . . . . F-1
v
Forward-looking statements
This offering memorandum includes forward-looking statements, in particular under “Summary,” “Risk factors,”
“Management’s discussion and analysis of financial condition and results of operations” and “Business.”
Our estimates and forward-looking statements are based principally on our current expectations and estimates on
future events and trends, which affect or may affect our businesses and results. Although we believe that these
estimates and forward-looking statements are based on reasonable assumptions, they are subject to several risks,
uncertainties and assumptions and are based on information currently available to us.
Our estimates and forward-looking statements may be affected by several factors, including, without limitation:
➢ the Brazilian economic, political and business scenarios;
➢ governmental interventions resulting in changes in the economy, taxes, tariffs, and regulatory environment in
Brazil;
➢ our ability to fully implement our business strategies;
➢ sudden or unexpected fluctuations in the prices we pay for raw materials;
➢ our ability to successfully compete and run our business in the future;
➢ inflation and fluctuations in interest rates and exchange rates;
➢ other factors which may affect our financial situation, liquidity and operating results; and
➢ other risk factors discussed under “Risk factors.”
Statements that depend on or are related to future or uncertain conditions or events, or that include the words
“believe,” “anticipate,” “continue,” “expect,” “estimate,” “intend,” “plan,” “may,” “assume” and other variations,
as well as similar words, are intended to identify forward-looking statements. Forward-looking statements
include information concerning our potential or assumed future results of operations, business strategies, funding
plans, competitive position, industry environment, potential growth opportunities and the effects of future
regulation and competition.
Forward-looking statements and estimates speak only as of the date they are made, and neither we nor the selling
shareholder, the Brazilian underwriters or the agents undertake the obligation to update or revise any forward-
looking statements after we distribute this offering memorandum to reflect new information, future events or
other factors. In light of the risks and uncertainties described above, the forward-looking events and
circumstances discussed in this offering memorandum may not occur or be accurate, and our future results of
operations and performance may differ materially from those set out for a number of reasons. Any such forward-
looking statements and estimates are not guarantees of future performance and involve risks and uncertainties.
Given such limitations, you should not rely on these forward-looking statements to make a decision to invest in
our common shares.
vi
Presentation of financial and other information
Financial information
Our financial information should be read in conjunction with our annual and interim individual and consolidated
financial statements, prepared in accordance with accounting practices adopted in Brazil, or Brazilian GAAP, and
the respective footnotes included elsewhere in this offering memorandum. Brazilian GAAP is based on:
➢ the Brazilian Corporate Law (Lei das Sociedades por Ações, or Law No. 6,404/76, as amended);
➢ the rules and regulations of the CVM; and
➢ accounting standards issued by the Brazilian Institute of Independent Accountants (Instituto dos Auditores
Independentes do Brasil), or IBRACON, and the Brazilian Federal Accounting Council (Conselho Federal de
Contabilidade), or CFC.
Brazilian GAAP differs in certain significant respects from accounting principles generally accepted in the
United States, or U.S. GAAP, and from International Financial Reporting Standards, or IFRS. There are
significant differences between U.S. GAAP and IFRS and Brazilian GAAP. The financial statements of the
Company and the consolidated financial statements of the Company and its subsidiaries contained in this offering
memorandum differ from those that would have been prepared based upon U.S. GAAP or IFRS. We have made
no attempt to identify or quantify the impact of these differences. No reconciliation to U.S. GAAP or IFRS of
any of the financial statements presented in this offering memorandum has been prepared for the purpose of this
offering memorandum or for any other purpose. There can be no assurance that reconciliations would not identify
material quantitative differences as well as disclosures and presentation differences between our consolidated
financial statements as prepared in accordance with Brazilian GAAP and the financial statements as prepared
under U.S. GAAP or IFRS.
The following financial statements are included in this offering memorandum:
➢ The individual and consolidated financial statements of the Company as of and for the years ended
December 31, 2004, 2005 and 2006, audited by our independent accountants, in accordance with audit
standards applicable in Brazil, as stated in their independent auditor report included elsewhere in this offering
memorandum, which include the following qualification and explanatory paragraphs:
- a qualification relating to the recognition of tax loss carryforwards amounting to R$25.0 million in 2002.
Since the Company had not presented taxable income in three of the last five years, these tax loss
carryforwards would not have been recorded based on CVM instructions. As a result, non current assets
and shareholders’ equity for the years presented are overstated by R$25.0 million;
- a qualification relating to the reversal in 2005 of exercise tax credits on exports previously recorded in
2003 against net income instead of retained earnings. Consequently, net income for the year ended
December 31, 2005 was understated by R$35.0 million;
- qualifications relating to (1) amortization of foreign currency losses accounted for as deferred charges in
prior years. These foreign currency losses should have been recognized as incurred. Consequently, net loss
for the year ended December 31, 2004 was overstated in the amount of R$2.7 million; and (2) unrecorded
provision for contingencies related to tax credits inappropriately offset against taxes due for which the
Company received an administrative assessment during the year ended December 31, 2004, and for losses
related to the portion of such tax credits not yet realized which were recorded as current assets. As a result,
as of December 31, 2004, current assets were overstated in R$25.4 million, noncurrent liabilities were
understated by R$15.5 million, and shareholders equity and net loss for the year ended December 31, 2004
was understated in R$40.9 million;
vii
Presentation of financial and other information
- an explanatory paragraph relating to the realization of income and social contribution tax credits
amounting to R$41.0 million at December 31, 2006, 2005 and 2004 which are derived from tax loss carry
forwards. The realization of such tax credits depends on the achievement of the budget which was
approved by the board of directors, and the Company’s five-year strategic plan; and
- an explanatory paragraph relating to the implementation of financial and operational restructuring plans of
the Company.
➢ The individual and consolidated financial statements of the Company as of and for the three-month period
ended March, 31, 2006, subject to a special review by our independent accountants in accordance with the
procedures established by IBRACON and the CFC for a special review of interim financial information, as
stated in their special review report included elsewhere in this offering memorandum, which contains a
qualification related to tax credits arising from tax loss carryforwards in the amount of R$25.0 million and an
emphasis paragraph on the utilization of tax credits of R$41.5 million arising from tax loss carryforwards
which will depend on the successful fulfillment of the Company’s budget and strategic plan and the
implementation of the Company’s operational and financial restructuring plan.
➢ The individual and consolidated financial statements of the Company as of and for the three-month period
ended March, 31, 2007, subject to a special review by our independent accountants in accordance with the
procedures established by IBRACON and the CFC for a special review of interim financial information, as
stated in their special review report included elsewhere in this offering memorandum, contains an emphasis
paragraph which states that the recoverability of deferred income tax assets in the amount of approximately
R$49.6 million is subject to the achievement of future taxable profits.
Other information
The inclusion of Adjusted EBITDA information is intended to present a measure of our economic and operating
performance and is determined in accordance with criteria established by the Company. Our Adjusted EBITDA
means net income before interest, income tax and social contribution, depreciation and amortization,
non-operating results and income from reversal of assignment of tax credits and expenses, and excludes
non-operating results, which we believe are not part of the Company’s business cycle, and income from the
reversal of the assignment of tax credits and expenses from the reversal of a credit related to an industrialized
products tax we paid in connection with exported goods (IPI Credit), as we view these results are non-recurring
income and expenses, because they have not occurred in the past two years and we expect that they will not occur
within the next two years. Adjusted EBITDA is not a measure of financial performance in accordance with
Brazilian GAAP and should not be considered individually, or as an alternative to net income as an indicator of
operating performance, or as an alternative to operating cash flow, nor should it be considered as an indicator of
liquidity. Adjusted EBITDA is not affected by debt restructuring processes, interest rate fluctuations, changes in
tax rates or depreciation and amortization levels. Accordingly, we believe that Adjusted EBITDA is an important
tool to compare our operating performance, over time, as well as to assist us in certain administrative decisions.
We believe that Adjusted EBITDA provides a better understanding of our financial performance as well as our
capacity to satisfy our liabilities and obtain funds for our capital expenditures and working capital. Adjusted
EBITDA, however, presents limitations that prevent it from being used as an indicator of our profitability, as it
does not consider certain costs arising from our business that could significantly affect our profits, such as
financial expenses, taxes, depreciation, capital expenditures and other related charges.
All references to “U.S. dollar,” “U.S. dollars” and the “US$” symbol presented herein are to the legal currency of
the United States herein. All references to “real,” “reais” and the “R$” symbol are to the legal currency of Brazil.
Certain numbers included in this offering memorandum have been subject to rounding adjustments. Accordingly,
some of the total amounts in the tables herein may not represent an exact sum of the figures that precede them.
viii
Presentation of financial and other information
Market information
We state several estimates herein, including market estimates, past and future details, sales in our sector, our
competitive position and our market share in the retail apparel sector in Brazil. We make such statements based
on information obtained through sources that we consider reliable, such as the Central Bank of Brazil (Banco
Central do Brasil), or Central Bank, the Brazilian Institute of Geography and Statistics (Instituto Brasileiro de
Geografia e Estatística), or IBGE, the Getulio Vargas Foundation (Fundação Getúlio Vargas), or FGV, and trade
associations (such as the Brazilian Textile Industry Association (Associação Brasileira da Indústria Têxtil), or
ABIT, the Brazilian Association of Apparel Companies (Associação Brasileira de Empresas de Vestuário), or
ABRAVEST, and the Brazilian Shopping Malls Association (Associação Brasileira de Shopping Centers), or
ABRASCE), the International Textile Manufacturers Federation, or ITMF, among others. Unless otherwise
stated, all macroeconomic information was obtained through the Central Bank, IBGE or FGV. We have no
reason to believe that such information is inaccurate in any material aspect, and accordingly we have not
independently verified such information.
Additional information
In this offering memorandum, references to “Cia. Hering,” “Hering,” “Group,” the “Company,” “we,” “us” and
“our” mean Cia. Hering and its consolidated subsidiaries, except where the context requires otherwise. When
used in this offering memorandum, the term “selling shareholder” refers to Socinvest Finance S.A. References to
“former controlling shareholders” are to Investimentos e Participações Inpasa S.A., IPE Investimentos,
Administradora Blumenauense, Amaral Investimentos, Ivo Hering, Carlos Tavares D’Amaral, Hans Prayon,
Marcio Tavares D’Amaral, Jean Prayon, Fabio Hering, Isolde Hering Dandrea, Raul de Aguiar Hering and Dietz
Ernst Fritz Linnenkamp. We do not have a controlling shareholder or controlling group holding a majority of our
common shares as of the date of this offering memorandum.
The term “Brazil” refers to the Federative Republic of Brazil. The phrase “Brazilian government” refers to the
federal government of the Federative Republic of Brazil.
References to the “Synovate survey” are to a quantitative research study prepared by Synovate Brasil Ltda., a
multinational market research firm, at our request, in order to determine the market share and consumers’
opinions of our brands. References to the “Target survey” are to a database, prepared and updated annually, at
our request, by Target Marketing S/C Ltda., named “Brasil em Foco—IPC Target” (Brasil in Focus—IPC
Target), based on demographic and economic data provided by IBGE and other government sources.
References to (i) “upper income class” or “upper income consumers,” (ii) “upper-middle income class” or
“upper-middle income consumers,” (iii) “middle income class” or “middle income consumers,” and (iv) “lower-
middle income class” or “lower-middle income consumers” are to, respectively, economic classes in Brazil
classified as “Class A,” “Class B1,” “Class B2,” and “Class C” in accordance with the Brazilian Economic
Classification Criteria of the Brazilian Association of Research Companies (ABEP). The classification of a
particular class by ABEP is based on a rating methodology that measures a person’s educational level and the
number and types of home appliances that such person owns at home. According to ABEP data, the monthly
average family income (i) in Class A, represented by Class A1 and Class A2, is approximately R$7,793 and
R$4,468, respectively; (ii) in Class B, represented by Class B1 and Class B2, is approximately R$2,804 and
R$1,169, respectively; and (iii) in Class C is R$927.
ix
Summary
This summary highlights information about our business, financial and operating data, activities, strengths and
strategies. This summary does not contain all information that investors should consider before making an
investiment decision. Before investing in our common shares, you should carefully read this entire offering
memorandum, including the information contained in the sections entitled “Presentation of financial and other
information,” “Risk factors” and “Management’s discussion and analysis of financial condition and results of
operations,” as well as our financial statements and related notes included elsewhere in this offering
memorandum.
OVERVIEW
We are one of the largest retail apparel designers and manufacturers in Brazil, in terms of consolidated net sales
in 2006, according to the Target survey. We have been operating in the retail industry for 127 years and currently
develop apparel collections under three proprietary brands: “Hering,” “PUC” and “dzarm.” As of March 31,
2007, we oversaw a chain of 151 Hering and 39 PUC stores, located throughout Brazil’s main markets, as well as
17 Hering and four PUC stores outside Brazil.
Our brands
The “Hering” brand is our primary and most profitable brand, accounting for 59.5% of our gross sales in 2006.
According to the Synovate survey, the “Hering” brand is recognized by 87.6% of Brazilian consumers, and is
commonly used to express the word “T-shirt” in Brazil. The “Hering” brand is also associated with casualwear,
valued for the quality of its products and highly accepted among all income levels and age groups, especially
those over 20 years of age. Our products are designed internally and offered to the market in six annual
collections following worldwide fast fashion trends.
Our “PUC” brand is recognized as a premium brand of childrens’s apparel for special occasions and is the fourth
largest brand in the upper income class, in terms of gross sales, according to the Synovate survey. The “dzarm.”
brand, meanwhile, is a jeanswear brand targeted at the teen market, especially young women.
Our retail structure
Our retail structure includes two complementary sales channels: (i) Hering and PUC stores, comprised of owned
and franchised stores, and (ii) multibrand retail stores.
Hering stores accounted for 46.3% of the revenues arising from our “Hering” brand in 2006. Hering stores are
present in 20 Brazilian states through a chain of 151 owned and franchised stores (totaling 19,617 square meters),
of which 78 are located in the state of São Paulo (which represented one third of Brazil’s gross domestic product,
or GDP, in 2006). PUC stores accounted for 37.8% of the revenues arising from our “PUC” brand in 2006. PUC
stores are present in 16 Brazilian states, through 39 owned and franchised stores (totaling 1,809 square meters),
21 of which are located in the state of São Paulo. Our store chains rely on different store formats (shopping malls
and street stores) and sizes, which are established in accordance with local market conditions.
We have developed our chains of stores mainly through the franchise model (operated by rigorously selected
franchisees), with stores that can be replicated quickly, cost efficiently and close to our target consumers. We are
able to provide uniformity and consistency of the consumer’s shopping experience in all Hering and PUC stores
through our centralized control of product assortment, prices, architectural design, window displays, product
disposition, advertising material, packaging and banners, among other features, and the adaptation of these
features to local market conditions. We maintain a frequent dialogue with franchisees through our franchise
board, which is comprised of three members appointed by our Company and seven members appointed by our
1
franchisees, and other informal means, which enables us to exchange experiences and improve the decision-
making process related to the operation of the stores. Of the total number of Hering and PUC stores, we own nine
Hering stores and one PUC store, which are typically model stores that are larger than the average store and the
operations of which we conduct ourselves given their importance to our brands.
In addition to Hering and PUC stores, our products are present in approximately 8,800 points of sale, through
multibrand retail stores, thereby increasing our distribution network throughout Brazil. Multibrand retail stores
represent 53.7% of the revenues arising from our “Hering” brand, 62.2% of the revenues arising from our “PUC”
brand and 100% of the revenues arising from our “dzarm.” brand. These points of sale are serviced by a team of
196 sales representatives.
Supply model
Our make-or-buy supply model combines our own production, in which lesser value-added steps of the
production process may be outsourced, with the purchase of finished products from domestic and international
suppliers. This model provides us with flexibility to adapt to market demand at a relatively low cost, while
maintaining control over quality standards. Our production activities are primarily concentrated in Blumenau, in
the state of Santa Catarina, where the knitting, dyeing, cutting, and finishing processes are carried out, including
embroidery, printing, washing and packaging. We also maintain operations in other municipalities in the state of
Santa Catarina and in the states of Rio Grande do Norte and Goiás.
We have three strategically located distribution centers in the states of Santa Catarina, Goiás and Rio Grande do
Norte.
We constantly invest in information technology to obtain and monitor information concerning sales and
inventory levels in Hering and PUC stores. We use this information together with our production, supply,
distribution and logistics flexibility to design, develop and distribute six annual collections, while being able to
minimize the shortage of products in stores and control costs related to inventory and overstock.
Exports
We are also one of the leading apparel exporters in Brazil, serving the United States, our main foreign consumer
market, and several Latin American and European countries. We export apparel under our own brands and under
third party private labels, through which we have the opportunity to exchange technical and administrative
expertise, allowing us to constantly improve our products in accordance with international standards.
2
Financial information
In recent years, we have sought to improve our capital structure, focusing on increasing profitability by
repositioning the “Hering” brand and focusing on fashionable products with higher value-added return. We also
discontinued certain less profitable brands and sales channels and decreased our level of indebtedness, in lieu of
growth. The following table sets forth our net sales, Adjusted EBITDA and net debt during the past three years
and in the three-month periods ending March 31, 2006 and 2007:
Year ended December 31,
Three-month period
ended March 31,
2004 2005 2006 2006 2007 2007
(in millions of R$,
unless noted otherwise)
(in millions of US$,
unless noted otherwise)(5)
Net sales . . . . . . . . . . . . . . . . . . . . . . 334.2 320.3 329.9 73.4 77.7 37.9
Hering Brand . . . . . . . . . . . . . . . . . . 178.6 172.5 189.0 43.2 46.7 22.8
Other brands . . . . . . . . . . . . . . . . . . . 77.6 74.5 74.9 17.0 18.8 9.2
Exports . . . . . . . . . . . . . . . . . . . . . . . 78.0 73.2 66.0 13.2 12.2 6.0
Adjusted EBITDA(1) . . . . . . . . . . . . 34.3 43.9 52.1 8.8 10.5 5.1
Adjusted EBITDA Margin(2) . . . . . . 10.3% 13.7% 15.8% 11.9% 13.4% 13.4%
Net Debt(3) . . . . . . . . . . . . . . . . . . . . 344.9 201.3 184.6 184.0 184.3 89.9
Net Debt/Adjusted EBITDA(4) . . . . . 10.1 4.6 3.5 4.5 3.4 3.4
(1) The inclusion of Adjusted EBITDA information is intended to present a measure of our economic and operating performance and is determined
in accordance with criteria established by the Company. Our Adjusted EBITDA means net income before interest, income tax and social
contribution, depreciation and amortization, non-operating results and income from reversal of assignment of tax credits and expenses, and
excludes non-operating results, which we believe are not part of the Company’s business cycle, and income from the reversal of the assignment
of tax credits and expenses from the reversal of a credit related to industrialized product taxes we paid in connection with exported goods (IPI
Credit), as we view these results are non-recurring income and expenses, because they have not occurred in the past two years and we expect that
they will not occur within the next two years. Adjusted EBITDA is not a measure of financial performance in accordance with Brazilian GAAP
and should not be considered individually, or as an alternative to net income as an indicator of operating performance, or as an alternative to
operating cash flow, nor should it be considered as an indicator of liquidity. Adjusted EBITDA is not affected by debt restructuring processes,
interest rate fluctuations, changes in tax rates or depreciation and amortization levels. Accordingly, we believe that Adjusted EBITDA is an
important tool to compare our operating performance, over time, as well as to assist us in certain administrative decisions. We believe that
Adjusted EBITDA provides a better understanding of our financial performance as well as our capacity to satisfy our liabilities and obtain funds
for our capital expenditures and working capital. Adjusted EBITDA, however, presents limitations that prevent it from being used as an indicator
of our profitability, as it does not consider certain costs arising from our business that could significantly affect our profits, such as financial
expenses, taxes, depreciation, capital expenditures and other related charges. See “Summary financial and other information—Reconciliation of
net income (loss) and Adjusted EBITDA.”
(2) Adjusted EBITDA margin is Adjusted EBITDA divided by net income.
(3) Net debt is calculated as the difference between the balance of short and long term loans and financings and cash and cash equivalents.
(4) We consider Adjusted EBITDA for the past 12 months to calculate Net Debt /Adjusted EBITDA for the three-month periods ended March 31,
2006 and 2007.
(5) Using the exchange rate in effect on March 31, 2007 of R$2.0504 to US$1.00.
3
OUR COMPETITIVE STRENGTHS
We believe our principal strengths include the following:
➢ Strong Brand Names. “Hering” is one of the most well-known apparel brand names in Brazil, recognized
by 93.9% of upper and upper-middle income class respondents and by 85% of middle and lower-middle
income class respondents in the Synovate survey. The “Hering” brand is associated with casualwear and
T-shirts in Brazil, setting itself apart from its competitors as a result of the quality of its products, according
to the Synovate survey. Our quality, along with the brand’s recognition and tradition, places the “Hering”
brand in a privileged position of acceptance across a wide variety of product categories and age ranges, in
particular among consumers over 20 years of age, and by upper, upper-middle, middle and lower-middle
income consumers. “PUC” and “dzarm.,” on the other hand, are niche market brands, with “PUC” being a
leading brand in children’s wear for upper income consumers and “dzarm.” associated with young and
contemporary apparel products.
➢ Distinguished Shopping Experience at Hering and PUC stores. The distinguished attributes of our brands
are reinforced by the shopping experience offered at our Hering and PUC stores. The shopping experience at
Hering stores is a distinguishing feature that consumers value in relation to department stores, as we combine
assisted sales with self-service sales. According to the Synovate survey, loyalty to the “Hering” brand among
consumers at Hering stores is 63.3% greater than of consumers who shop at multibrand retail stores.
➢ Widespread Retail Structure. Our retail structure comprises 190 Hering and PUC stores and approximately
8,800 multibrand retail stores, providing us with a widespread presence throughout Brazil. By franchising
Hering and PUC stores with different formats and sizes, we benefit from greater store density as compared to
the traditional department store model, whether in shopping malls, street stores or commercial centers. In
addition to our chain of owned and franchised stores, multibrand retail stores allow us to be present in cities
where potential demand may not justify the investment of opening a Hering or PUC store.
➢ Development of Collections and Fast Supply Chain Model (Fast Fashion). Our product development
team and supply chain is prepared to offer six collections throughout the year to our chain of stores and
multibrand retail stores, delivered in two to three-week cycles, ensuring availability of new products at our
stores and encouraging consumers to visit our stores more often. We are able to achieve this result in part
because we design our collections in-house, thereby reducing the product development cycle. Additionally,
we use the make-or-buy hybrid supply model whereby we either manufacture products internally or purchase
them from local or foreign suppliers, based upon market conditions and the most efficient and profitable
alternative for us. We believe we are one of the only Brazilian apparel chains capable of implementing this
business model, which has been increasingly adopted in more devoloped markets, such as Europe.
➢ Growth Potential. Current macroeconomic conditions in Brazil are favorable for the retail apparel industry.
These conditions include growing consumer credit availability, increase in per capita income, continuous
decrease of interest rates and retail sector consolidation. We believe that within this macroeconomic
framework we will have the opportunity to increase our market share, given the high rate of market
fragmentation, in which the top five retailers in the apparel industry have a combined market share of
approximately 32.4%.
OUR GROWTH STRATEGY
Our growth strategy for the forthcoming years focuses on the strength of the “Hering” brand, which has been the
major driving force for our growth, as well as our retail structure, seeking to increase our market share in Brazil
to the same level as our market share in the state of São Paulo, as described below. The principal elements of our
strategy are summarized below:
➢ Repositioning the “Hering” brand as affordable fashion. Our “Hering” brand has strong growth potential
given that its penetration among potential consumers is relatively low. Even in São Paulo, where we have a
4
stronger presence, the Synovate survey showed that the brand’s penetration is no greater than 21.7% in the
upper income class, 24.4% in the upper-middle income class, 15.6% in the middle income class and 4% in
the lower-middle income class. The greatest barrier to increase the brand’s penetration, especially among
upper-middle, middle and lower-middle income consumers, is the brand’s association with higher priced
products by these consumers. According to the Synovate survey, 20.9% of upper income class and 30% of
upper-middle, middle and lower-middle income consumers who know the brand and do not purchase its
products stated they do so because of price. In order to increase our sales to these consumers, we intend to
reposition the “Hering” brand as affordable fashion, a segment that today in the Brazilian market is occupied
only by department stores, from which we distinguish ourselves due to the shopping experience at our stores.
We intend to increase our offer of affordable products and increase investment in marketing and publicity in
order to increase the brand’s visibility. We believe this strategy will result in an increase in the ratio of sales
per square meter of all Hering stores, which is currently around R$11,000 per year, and recover our share of
wallet among the clients of multibrand retail stores (our average revenue per client in multibrand retail stores
was 13.7% greater in 2001 than in 2006 in real terms).
➢ Expand credit availability at Hering stores. We intend to expand our credit card (“Cartão Hering,” or the
Hering Card) operations based on a revenue sharing (and, potentially, risk sharing) commercial agreement to
be entered into with a financial institution, in order to allow users to buy our products under more favorable
payment terms. We intend to focus our strategy on a private label card with characteristics similar to those of
other cards in the retail market (such as management fees, interest rates, types of purchase and financing
options), combined with a co-branded card and additional products, such as personal credit lines and
insurance.
➢ Expand and strengthen Hering stores. A detailed mapping of the shopping malls, commercial centers and
residential neighborhoods in 135 Brazilian cities showed that there is an opportunity to, at least, double the
number of Hering stores. Our market share is greater in cities where Hering stores are physically located.
Taking into account the upper, upper-middle, middle and lower-middle income classes, we believe our
national market share is approximately 1.6% (considering net sales plus franchise and multibrand retail store
mark-ups), and based on the Target survey, we believe our market share is approximately 3.6% in the city of
São Paulo, where our presence is stronger. Outside the city of São Paulo, in cities where Hering stores are
located, we estimate our market share is approximately 1.5%, while in cities where Hering stores are not
located, our estimated market share is approximately 1.2%. We will focus our growth in mid-sized and large
cities, in both shopping malls and street, adopting the most appropriate store format for the local market.
Relatively larger stores can be established in shopping malls, especially those that have a high frequency of
upper, upper-middle and middle income consumers. We believe shopping mall stores could be as large as up
to 170 square meters on average, while the current average is 136 square meters. Commercial centers are able
to sustain mid-sized stores (approximately 115 square meters), while smaller stores (100 square meters) are
suitable for upper, upper-middle and middle income residential neighborhoods.
➢ Increase number of owned stores. Additionally, we intend to increase the number of stores we own,
generally larger model stores, of approximately 200 to 240 square meters, which demand a greater initial
investment, currently around R$2,000 per square meter, including location costs. We expect to focus on
larger cities where our presence is not as significant, such as Rio de Janeiro, or shopping malls with a high
frequency of upper, upper-middle and middle income consumers. Our goal is to take advantage of the
incremental EBITDA generated by stores we own, manage high visibility outlets and strengthen our brand.
We owned ten stores as of December 2006 and expect to significantly increase this number in 2007 and 2008.
➢ Increase sales at multibrand retail stores. Repositioning the “Hering” brand as affordable fashion, in
addition to allowing us to reestablish our historical share of wallet at our current 6,500 “Hering” brand points
of sale (out of a total of approximately 8,800 points of sale for all of our brands) will allow us to capture new
clients at multibrand retail stores. As a result, we intend to increase the number of our “Hering” brand sales
representatives from 119 (out of a total of 196 for all our brands) to more than 200 representatives.
5
The offering
Issuer . . . . . . . . . . . . . . . . . . . . . . . . . . . . Cia. Hering.
Selling shareholder . . . . . . . . . . . . . . . . . Socinvest Finance S.A. See “Principal shareholders and selling
shareholder” regarding the legal limitations on disclosure of the
identity of the investors of the selling shareholder. Upon completion
of the offering, the selling shareholder will hold directly
approximately 3.38% of our capital stock and, indirectly (through
Target Investment Fund Ltd. SAC, or the Target Fund, one of our
principal shareholders) approximately 10.43% of our capital stock
(assuming the exercise in full of the over-allotment option).
Joint bookrunners . . . . . . . . . . . . . . . . . . Itaú Securites Inc. and Santander Investment Securities, Inc.
Securities offered . . . . . . . . . . . . . . . . . . . The offering consists of a primary offering of 20,833,000 common
shares and a secondary offering of 7,500,000 common shares to:
➢ the public in Brazil pursuant to an offering registered in
Brazil;
➢ qualified institutional buyers in the United States as defined
under Rule 144A under the Securities Act, pursuant to
exemptions from the Securities Act and the rules issued
thereunder; and
➢ institutions and other investors outside the United States and
Brazil that are not U.S. persons in accordance with
Regulation S under the Securities Act.
Over-allotment option . . . . . . . . . . . . . . . We have granted to Banco Itaú BBA S.A. an option, excercisable
upon consultation with Banco Santander Banespa S.A., to place up to
4,249,950 additional common shares at the offering price,
representing up to 15% of the common shares initially offered hereby,
to cover over-allotments, if any, for a period of up to 30 days
following the date of publication of the announcement in Brazil of the
commencement of the offering.
Offering price . . . . . . . . . . . . . . . . . . . . . R$11.00 per common share.
Capital stock . . . . . . . . . . . . . . . . . . . . . . Our capital stock immediately prior to this offering consists of
33,094,681 common shares. Immediately following completion of
this offering, our capital stock will consist of 53,927,681 common
shares (assuming no exercise of the over-allotment option). See
“Description of capital stock”.
Use of proceeds . . . . . . . . . . . . . . . . . . . . We estimate that the proceeds, before expenses, from the primary
offering will be approximately R$218.7 million, after deducting
estimated underwriting commissions and assuming no exercise of the
over-allotment option.
6
We intend to use the net proceeds from the primary offering for: (i)
working capital and other corporate purposes, (ii) investments in
owned Hering and PUC stores, (iii) investments in information,
textile and industrial technologies and (iv) the repayment of debt and
improvement of our capital structure. See “Use of proceeds.”
We will not receive any proceeds from the sale of common shares by
the selling shareholder in the secondary offering.
Lock-up agreements . . . . . . . . . . . . . . . . We, the selling shareholder, the former controlling shareholders and
our directors and officers have agreed, subject to certain exceptions,
not to issue, sell, offer or agree to sell, grant any option to sell or
otherwise dispose of, directly or indirectly, any shares or securities
convertible into or exchangeable or exercisable for shares or warrants
or other rights to purchase shares during the 180-day period following
the date of this offering memorandum without prior written consent
of the underwriters.
Transfer restrictions . . . . . . . . . . . . . . . . Our common shares have not been registered under the Securities Act
and are subject to U.S. restrictions on transfer and resale, as described
in “Transfer restrictions.” Transfers of our shares, including by or
between residents of jurisdictions outside Brazil, may be effected
only in Brazil.
Voting rights . . . . . . . . . . . . . . . . . . . . . . Each common share entitles its holder to one vote at any annual or
special shareholders’ meeting. See “Description of capital stock—
Rights of common shares.”
Tag-along rights . . . . . . . . . . . . . . . . . . . Following the listing of our common shares on the Novo Mercado
segment of the BOVESPA, holders of our common shares will be
entitled to be included in a public tender offer in case a controlling
shareholder sells its controlling stake in us, under the same terms as
those being offered to such controlling shareholder. See “Description
of capital stock.”
Dividends . . . . . . . . . . . . . . . . . . . . . . . . The Brazilian Corporate Law and our by-laws require us to distribute
at least 25% of our annual adjusted net income, as calculated under
Brazilian GAAP and adjusted under the Brazilian Corporate Law
(which differs significantly from net income as calculated under
U.S. GAAP and IFRS). The payment of dividends may be suspended
by our board of directors, however, if it concludes that such
distribution would not be advisable at such time taking into account
our financial condition or prospects, macroeconomic conditions,
regulatory changes, our growth strategy and contractual restrictions,
among other factors deemed relevant by our board of directors or
shareholders. We have not declared dividends in the preceding five
fiscal years. Dividends may be made in the form of interest attributed
to shareholders’ equity. See “Dividends and dividend policy.”
7
Trading, settlement and clearance . . . . . . Payment for our common shares will be required to be made to us in
reais in Brazil through the facility of the CBLC and we expect to
deliver our shares in Brazil through the facility of the CBLC on or
about July 25, 2007. Trades in our common shares on the BOVESPA
will settle through the CBLC.
Listing . . . . . . . . . . . . . . . . . . . . . . . . . . . Our common shares are listed with the Novo Mercado segment of
BOVESPA, under the symbol “HGTX3.”
Risk factors . . . . . . . . . . . . . . . . . . . . . . . An investment in our common shares involves risks. See
“Risk factors” beginning on page 15 and the other information
included in this offering memorandum for a discussion of factors you
should consider before deciding to invest in our common shares.
Taxation . . . . . . . . . . . . . . . . . . . . . . . . . . Dividend distributions with respect to our common shares are not
currently subject to withholding of Brazilian income tax. However,
payments of interest attributable to shareholders’ equity (in lieu of
dividends) are subject to withholding of Brazilian income tax. For
certain Brazilian and U.S. tax consequences with respect to
U.S. holders of our common shares, see “Taxation.”
8
Summary financial and other information
The tables below present summary financial and other information for the periods indicated therein. The
financial information below should be read and analyzed in conjunction with the sections “Selected financial
data and other information,” “Management’s discussion and analysis of financial condition and results of
operations” and “Presentation of financial and other information.”
The summary financial information relating to the balance sheet and income statement as of and for the
years ended December 31, 2004, 2005 and 2006, is derived from our audited financial statements, prepared in
accordance with accounting practices adopted in Brazil, audited by our independent accountants in accordance
with audit standards applicable in Brazil, as stated in their independent auditor report, which contains
qualifications relating to (i) the realization of deferred income and social contribution taxes for the years
presented amounting to R$25.0 million, (ii) the recognition of R$35.0 million related to tax credits offset against
taxable income recorded as current assets, (iii) R$2.7 million, related to deferred currency exchange losses and
(iv) unrecorded provisions for contingencies related to tax credits which were inappropriately offset against
taxable income amounting to R$16.0 million in which the Company received an administrative assessment
during the year ended December 31, 2004, and explanatory paragraphs relating to (i) the realization of income
and social contribution tax credits amounting to R$41.0 million at December 31, 2006 and (ii) the
implementation of financial and operational restructuring plans of the Company as approved by our board of
directors. This report is included elsewhere in this offering memorandum.
The selected financial information relating to the balance sheet and income statement as of and for the
three-month period ended March 31, 2006, is derived from our unaudited financial statements, prepared in
accordance with Brazilian GAAP, which were subject to special review performed by our independent
accountantsin accordance with the procedures established by IBRACON, in conjunction with the CFC, for a
special review of interim financial information, as stated in their special review report, which contains
qualifications relating to the realization of deferred income and social contribution taxes for the years presented
amounting to R$25.0 million and explanatory paragraphs relating to (i) the realization of income and social
contribution tax credits amounting to R$41.0 million and (ii) the implementation of the company’s financial
restructuring plans of the Company.
The selected financial information relating to the balance sheet and income statement as of and for the
three-month period ended March 31, 2007, is derived from our unaudited financial statements, prepared in
accordance with Brazilian GAAP, which were subject to special review performed by our independent
accountants in accordance with the procedures established by IBRACON, in conjunction with the CFC, for a
special review of interim financial information, as stated in the special review report included elsewhere in this
offering memorandum, contains an emphasis paragraph which states that the recoverability of deferred income
tax assets in the amount of R$49.6 million is subject to the achievement of future taxable profits.
Brazilian GAAP differs in certain significant respects from U.S. GAAP from IFRS. The financial statements of
the Company and the consolidated financial statements of the Company and subsidiaries contained in this
offering memorandum differ from those that would be prepared based upon U.S. GAAP or IFRS. We have made
no attempt to identify or quantify the impact of those differences. No reconciliation to U.S. GAAP or IFRS of
any of the financial statements presented in this offering memorandum has been prepared for the purpose of this
offering memorandum or for any other purpose. There can be no assurance that reconciliations would not identify
material quantitative differences as well as disclosures and presentation differences between our consolidated
financial statements as prepared in accordance with Brazilian GAAP and the financial statements as prepared
under U.S. GAAP or IFRS.
Solely for the convenience of the reader, real amounts as of and for the three-month period ended March 31,
2007 and as of and for the year ended December 31, 2006 have been translated into U.S. dollars at the
9
commercial selling rate at closing for the purchase of U.S. dollars, as reported by the Central Bank, on March 31,
2007 of R$2.0504 to US$1.00. The U.S. dollar equivalent information should not be construed to imply that the
real amount represented, or could have been or could be converted into, U.S. dollars at this rate or at any other
rate.
For additional information regarding qualifications and explanatory paragraphs in our financial statements, see
“Presentation of financial and other information.”
Year ended
December 31,
Three-month period
ended March 31,
Statements of operations 2004 2005 2006 2006 2007 2007
(in millions of R$,
unless otherwise noted)
(in millions of US$,
unless otherwise noted)(1)
Gross sales . . . . . . . . . . . . . . . . . . . . . . . 391.3 376.6 389.6 86.3 92.7 45.1
Domestic market . . . . . . . . . . . . . . . . . . . 313.3 303.4 323.6 73.1 80.5 39.2
Foreign market . . . . . . . . . . . . . . . . . . . . 78.0 73.2 66.0 13.2 12.1 5.9
Sales deductions . . . . . . . . . . . . . . . . . . . (57.1) (56.3) (59.6) (12.9) (14.9) (7.2)
Net Sales . . . . . . . . . . . . . . . . . . . . . . . . . 334.2 320.3 330.0 73.4 77.7 37.9
Cost of sales . . . . . . . . . . . . . . . . . . . . . . . (215.3) (201.2) (198.6) (46.0) (47.9) (23.3)
Gross profit . . . . . . . . . . . . . . . . . . . . . . 118.9 119.1 131.4 27.4 29.8 14.5
Operating income (expense)
Selling expenses . . . . . . . . . . . . . . . . . . . (69.3) (64.7) (70.0) (15.9) (17.2) (8.3)
General and administrative expenses . . . (14.3) (13.7) (15.6) (3.9) (3.9) (1.9)
Management compensation . . . . . . . . . . . (1.8) (1.9) (2.0) (0.5) (0.5) (0.2)
Depreciation and amortization . . . . . . . . (9.7) (8.8) (9.1) (2.2) (2.0) (0.9)
Depreciation and amortization allocated
to cost . . . . . . . . . . . . . . . . . . . . . . . . . 7.7 6.7 7.2 1.7 1.6 0.7
Profit sharing . . . . . . . . . . . . . . . . . . . . . . (1.3) (1.1) (1.0) — — —
Other operating income (expense),
net . . . . . . . . . . . . . . . . . . . . . . . . . . . . (5.6) (22.0) 2.1 (0.1) 0.6 0.2
Income from operations before
financial income (expense) and
equity in subsidiaries . . . . . . . . . . . . . 24.6 13.6 43.0 6.5 8.4 4.0
Financial result . . . . . . . . . . . . . . . . . . . . (39.7) 42.9 (23.3) 1.1 (2.2) (1.0)
Amortization of goodwill . . . . . . . . . . . . (0.9) (0.9) (0.7) (0.2) — —
Income (loss) from operations (16.0) 55.6 19.0 7.4 6.2 3.0
Non-operating income (expense) . . . . . . (3.8) (25.7) (3.3) (0.5) — —
Income (loss) before taxes on income
and minority interest . . . . . . . . . . . . . (19.8) 29.9 15.7 6.9 6.2 3.0
Provision and deferred income tax and
social contribution . . . . . . . . . . . . . . . . 2.1 1.0 1.5 0.4 8.5 4.1
Income tax and social contribution . . . . . — — — — (0.6) (0.2)
Net income (loss) for the period . . . . . . (17.7) 30.9 17.2 7.3 14.1 6.8
(1) Using the exchange rate in effect on March 31, 2007 of R$2.0504 to US$1.00.
10
Year ended
December 31,
Three–month period
ended March 31,
Consolidated balance sheet 2004 2005 2006 2006 2007 2007
(in millions of R$,
unless noted otherwise)
(in millions of US$,
unless noted otherwise)(1)
CURRENT ASSETS
Cash and cash equivalents . . . . . . . . . . . . . . . . . . . . . . . . . . . . . . 7.7 8.9 5.2 3.9 5.9 2.9
Trade accounts receivable . . . . . . . . . . . . . . . . . . . . . . . . . . . . . . 92.4 93.6 86.1 81.8 96.2 46.9
Inventories . . . . . . . . . . . . . . . . . . . . . . . . . . . . . . . . . . . . . . . . . . 40.9 33.6 41.6 36.7 46.8 22.8
Recoverable taxes . . . . . . . . . . . . . . . . . . . . . . . . . . . . . . . . . . . . 31.9 27.5 22.9 26.5 20.6 10.0
Prepaid expenses . . . . . . . . . . . . . . . . . . . . . . . . . . . . . . . . . . . . . 2.1 1.4 1.4 1.2 1.7 0.8
Other receivables . . . . . . . . . . . . . . . . . . . . . . . . . . . . . . . . . . . . . 3.9 4.5 5.1 4.2 3.7 1.8
Total current assets . . . . . . . . . . . . . . . . . . . . . . . . . . . . . . . . . . 178.9 169.5 162.3 154.3 174.9 85.3
NONCURRENT ASSETS
Non current assets
Related parties . . . . . . . . . . . . . . . . . . . . . . . . . . . . . . . . . . . 0.8 0.7 0.8 0.7 0.8 0.3
Notes and accounts receivable . . . . . . . . . . . . . . . . . . . . . . . 3.3 2.7 4.4 6.1 4.9 2.3
Properties for sale . . . . . . . . . . . . . . . . . . . . . . . . . . . . . . . . 31.8 — — — — —
Prepaid expenses . . . . . . . . . . . . . . . . . . . . . . . . . . . . . . . . . 6.5 4.0 2.8 3.7 2.4 1.2
Recoverable taxes . . . . . . . . . . . . . . . . . . . . . . . . . . . . . . . . 1.9 9.8 2.6 9.8 3.9 1.9
Compulsory loans . . . . . . . . . . . . . . . . . . . . . . . . . . . . . . . . 12.1 12.1 24.5 12.1 24.5 11.9
Deferred income and social contribution tax . . . . . . . . . . . . 66.5 66.5 66.5 66.5 49.6 24.2
Investments . . . . . . . . . . . . . . . . . . . . . . . . . . . . . . . . . . . . . . . . .
Subsidiaries . . . . . . . . . . . . . . . . . . . . . . . . . . . . . . . . . . . . . 1.7 0.7 — 0.4 — —
Other investments . . . . . . . . . . . . . . . . . . . . . . . . . . . . . . . . 2.8 2.8 1.0 2.8 1.0 0.5
Property, plant and equipment . . . . . . . . . . . . . . . . . . . . . . . . . . . 216.9 212.4 212.0 209.6 212.5 103.6
Intangible asset . . . . . . . . . . . . . . . . . . . . . . . . . . . . . . . . . . . . . . 4.9 4.1 4.8 4.9 4.9 2.3
Deferred charges . . . . . . . . . . . . . . . . . . . . . . . . . . . . . . . . . . . . . 0.1 — 0.1 — 0.1 0.1
Total non current assets . . . . . . . . . . . . . . . . . . . . . . . . . . . . . . 349.3 315.8 319.5 316.6 307.6 150.0
TOTAL ASSETS . . . . . . . . . . . . . . . . . . . . . . . . . . . . . . . . . . . . 528.2 485.3 481.8 470.9 482.5 235.3
LIABILITIES AND SHAREHOLDERS’ EQUITY
CURRENT LIABILITIES
Loans and financing . . . . . . . . . . . . . . . . . . . . . . . . . . . . . . . . . . . 78.2 56.7 44.6 49.3 69.0 33.6
Trade accounts payable . . . . . . . . . . . . . . . . . . . . . . . . . . . . . . . . 34.4 35.8 25.6 35.8 31.4 15.3
Payroll and related charges . . . . . . . . . . . . . . . . . . . . . . . . . . . . . 15.8 12.9 14.5 13.1 14.9 7.2
Taxes in installments . . . . . . . . . . . . . . . . . . . . . . . . . . . . . . . . . . 5.3 12.3 11.3 11.9 10.2 4.9
Taxes payable . . . . . . . . . . . . . . . . . . . . . . . . . . . . . . . . . . . . . . . 15.4 43.1 23.8 44.4 25.1 12.2
Provisions . . . . . . . . . . . . . . . . . . . . . . . . . . . . . . . . . . . . . . . . . . 5.3 4.1 4.9 4.2 5.3 2.5
Tax incentives . . . . . . . . . . . . . . . . . . . . . . . . . . . . . . . . . . . . . . . — — 1.1 — 1.1 0.5
Other payables . . . . . . . . . . . . . . . . . . . . . . . . . . . . . . . . . . . . . . . 6.5 5.4 1.1 3.0 2.6 1.3
Total current liabilities . . . . . . . . . . . . . . . . . . . . . . . . . . . . . . . 160.9 170.3 126.9 161.7 159.8 77.9
NONCURRENT LIABILITIES
Loans and financing . . . . . . . . . . . . . . . . . . . . . . . . . . . . . . . . . . . 274.4 153.5 145.2 138.6 124.1 60.5
Provisions . . . . . . . . . . . . . . . . . . . . . . . . . . . . . . . . . . . . . . . . . . 30.4 23.8 21.0 25.8 20.4 9.9
Tax incentives . . . . . . . . . . . . . . . . . . . . . . . . . . . . . . . . . . . . . . . 17.1 19.3 23.1 19.3 24.1 11.7
Deferred taxes on revaluation . . . . . . . . . . . . . . . . . . . . . . . . . . . 19.9 18.8 16.2 18.3 15.9 7.7
Taxes in installments . . . . . . . . . . . . . . . . . . . . . . . . . . . . . . . . . . 14.2 15.4 42.5 13.6 41.4 20.1
Taxes payable . . . . . . . . . . . . . . . . . . . . . . . . . . . . . . . . . . . . . . . 7.0 46.9 48.0 49.0 48.8 23.8
Other payables . . . . . . . . . . . . . . . . . . . . . . . . . . . . . . . . . . . . . . . 3.2 5.3 5.2 5.2 5.3 2.6
Total non current liabilities . . . . . . . . . . . . . . . . . . . . . . . . . . . 366.2 283.0 301.2 269.8 280.0 136.5
MINORITY INTEREST . . . . . . . . . . . . . . . . . . . . . . . . . . . . . . — — — — — —
SHAREHOLDERS’ EQUITY
Capital . . . . . . . . . . . . . . . . . . . . . . . . . . . . . . . . . . . . . . . . . . . . . 146.0 146.0 146.0 146.0 146.0 71.2
Revaluation reserve . . . . . . . . . . . . . . . . . . . . . . . . . . . . . . . . . . . 54.1 51.9 53.4 51.1 53.0 25.8
Accumulated deficit . . . . . . . . . . . . . . . . . . . . . . . . . . . . . . . . . . . (199.0) (165.9) (145.7) (157.7) (156.3) 76.2
Total shareholders’ equity . . . . . . . . . . . . . . . . . . . . . . . . . . . . 1.1 32.0 53.7 39.4 42.7 20.8
TOTAL LIABILITIES AND SHAREHOLDERS’
EQUITY . . . . . . . . . . . . . . . . . . . . . . . . . . . . . . . . . . . . . . . . . 528.2 485.3 481.8 470.9 482.5 235.3
(1) Using the exchange rate in effect on March 31, 2007 of R$2.0504 to US$1.00.
11
Other financial information
Years ended
December 31,
Three-month period
ended March 31,
2004 2005 2006 2006 2007 2007
(in millions of R$,
unless noted otherwise)
(in millions of US$,
unless noted otherwise)(5)
Net sales . . . . . . . . . . . . . . . . . . . . . . . . 334.2 320.3 330.0 73.4 77.7 37.9
Gross profit . . . . . . . . . . . . . . . . . . . . . 118.9 119.1 131.4 27.4 29.8 14.5
Adjusted EBITDA(1) . . . . . . . . . . . . . . . 34.3 43.9 52.1 8.8 10.5 5.1
Net income (loss) . . . . . . . . . . . . . . . . . (17.7) 30.9 17.2 7.3 14.1 6.9
Gross margin(2) . . . . . . . . . . . . . . . . . . . 35.6% 37.2% 39.8% 37.3% 38.4% 38.4%
Adjusted EBITDA margin(3) . . . . . . . . 10.3% 13.7% 15.8% 11.9% 13.4% 13.4%
Net margin(4) . . . . . . . . . . . . . . . . . . . . . (5.3)% 9.6% 5.2% 9.9% 18.1% 18.1%
(1) The inclusion of Adjusted EBITDA information is intended to present a measure of our economic and operating performance and is determined in
accordance with criteria established by the Company. Our Adjusted EBITDA means net income before interest, income tax and social
contribution, depreciation and amortization, non-operating results and income from reversal of assignment of tax credits and expenses, and
excludes non-operating results, which we believe are not part of the Company’s business cycle, and income from the reversal of the assignment of
tax credits and expenses from the reversal a credit related to industrialized product taxes we paid in connection with exported goods (IPI Credit),
as we view these results are non-recurring income and expenses, because they have not occurred in the past two years and we expect that they will
not occur within the next two years. Adjusted EBITDA is not a measure of financial performance in accordance with Brazilian GAAP and should
not be considered individually, or as an alternative to net income as an indicator of operating performance, or as an alternative to operating cash
flow, nor should it be considered as an indicator of liquidity. Adjusted EBITDA is not affected by debt restructuring processes, interest rate
fluctuations, changes in tax rates or depreciation and amortization levels. Accordingly, we believe that Adjusted EBITDA is an important tool to
compare our operating performance, over time, as well as to assist us in certain administrative decisions. We believe that Adjusted EBITDA
provides a better understanding of our financial performance as well as our capacity to satisfy our liabilities and obtain funds for our capital
expenditures and working capital. Adjusted EBITDA, however, presents limitations that prevent it from being used as an indicator of our
profitability, as it does not consider certain costs arising from our business that could significantly affect our profits, such as financial expenses,
taxes, depreciation, capital expenditures and other related charges. See “Selected financial and other information.”
(2) Gross Margin is gross profit divided by net income.
(3) Adjusted EBITDA Margin is Adjusted EBITDA divided by net sales revenue.
(4) Net margin is net income (loss) divided by net sales.
(5) Using the exchange rate in effect on March 31, 2007 of R$2.0504 to US$1.00.
12
Reconciliation of net income (loss) and Adjusted EBITDA
Year ended
December 31,
Three-month period
ended March 31,
2004 2005 2006 2006 2007 2007
(in millions of R$) (in millions of US$)(6)
Net Income (loss) . . . . . . . . . . . . . . . . . . . . . (17.7) 31.0 17.2 7.3 14.1 6.9
(-) Depreciation and amortization . . . . . . . . 9.7 8.8 9.1 2.2 2.1 1.0
(-) Financial result . . . . . . . . . . . . . . . . . . . . 39.7 (42.9) 23.3 (1.1) 2.2 1.1
(-) Income tax and social contribution . . . . . (2.0) (1.0) (1.5) (0.5) (7.9) (3.8)
(-) Non-operational result(1) . . . . . . . . . . . . . 4.7 26.6(2) 4.0 0.8 0.0 0.0
(-) Recovery of expenses . . . . . . . . . . . . . . . — (13.5)(3) — — — —
(-) IPI Credit reversion . . . . . . . . . . . . . . . . . — 35.0(4) — — — —
Adjusted EBITDA(5) . . . . . . . . . . . . . . . . . . 34.3 43.9 52.1 8.8 10.5 5.1
(1) Non-operational result is calculated as non-operational result plus amortization of goodwill.
(2) Refers to the difference determined between the acquisition and sales prices of real property in Spain, on which a former industrial facility,
disactivated in 1996, was located. This property had been classified as property, plant and equipment valued at its acquisition cost of R$28.1
million, but was sold in 2005 for R$2.3 million, resulting in a loss of R$25.7 million, depreciated until its realization.
(3) Refers to the income resulting from the reversal of the assignment of tax credits carried out by third parties in 2003 and 2004, being reverted in
the year ended December 31 2005 and recorded as other operating income (expense), in the amount of R$13.5 million, as described in
explanatory note no. 20 of our financial statements for that year.
(4) Resulting from the reversal of a credit related to industrialized product taxes we paid in connection with exported goods (IPI Credit), which took
place in 2003, in view of changes in case law regarding this issue in the Superior Court of Justice (STJ). We reversed the aforementioned credit in
the year ended December 31, 2005, reflecting this amount in the company’s results under other operating income (expense), as described in
explanatory note no. 20 of our financial statements for that year, in a net amount of R$35.0 million.
(5) The inclusion of Adjusted EBITDA information is intended to present a measure of our economic and operating performance and is determined in
accordance with criteria established by the Company. Our Adjusted EBITDA means net income before interest, income tax and social
contribution, depreciation and amortization, non-operating results and income from reversal of assignment of tax credits and expenses, and
excludes non-operating results, which we believe are not part of the Company’s business cycle, and income from the reversal of the assignment of
tax credits and expenses from the reversal of a credit related to industrialized product taxes we paid in connection with exported goods (IPI
Credit), as we view these results are non-recurring income and expenses, because they have not occurred in the past two years and we expect that
they will not occur within the next two years. Adjusted EBITDA is not a measure of financial performance in accordance with Brazilian GAAP
and should not be considered individually, or as an alternative to net income as an indicator of operating performance, or as an alternative to
operating cash flow, nor should it be considered as an indicator of liquidity. Adjusted EBITDA is not affected by debt restructuring processes,
interest rate fluctuations, changes in tax rates or depreciation and amortization levels. Accordingly, we believe that Adjusted EBITDA is an
important tool to compare our operating performance, over time, as well as to assist us in certain administrative decisions. We believe that
Adjusted EBITDA provides a better understanding of our financial performance as well as our capacity to satisfy our liabilities and obtain funds
for our capital expenditures and working capital. Adjusted EBITDA, however, presents limitations that prevent it from being used as an indicator
of our profitability, as it does not consider certain costs arising from our business that could significantly affect our profits, such as financial
expenses, taxes, depreciation, capital expenditures and other related charges. See “Selected financial and other information.”
(6) Using the exchange rate in effect on March 31, 2007 of R$2.0504 to US$1.00.
13
The following table shows our indebtedness, in terms of debt and net debt for the periods indicated in the table.
As of December 31, Three–month period ended March 31,
2004 2005 2006 2006 2007 2007
(in millions of R$,
unless noted otherwise)
(in millions of US$,
unless noted otherwise)(2)
Debt (loans and financings)
Current . . . . . . . . . . . . . . . . . . . . . . . . . . . . . . . . . 78.2 56.7 44.6 49.3 69.1 33.7
Noncurrent . . . . . . . . . . . . . . . . . . . . . . . . . . . . . . 274.4 153.5 145.2 138.6 124.1 60.5
Total . . . . . . . . . . . . . . . . . . . . . . . . . . . . . . . . . . . 352.6 210.2 189.8 187.9 193.2 94.2
Net Debt(1)
Current . . . . . . . . . . . . . . . . . . . . . . . . . . . . . . . . . 70.5 47.8 39.4 45.4 63.2 30.8
Noncurrent . . . . . . . . . . . . . . . . . . . . . . . . . . . . . . 274.4 153.5 145.2 138.6 121.1 59.1
Total . . . . . . . . . . . . . . . . . . . . . . . . . . . . . . . . . . . 344.9 201.3 184.6 184.0 184.3 89.9
(1) Net debt is calculated as the difference between the balance of short and long term loans and financings and cash and cash equivalents.
(2) Using the exchange rate in effect on March 31, 2007 of R$2.0504 to US$1.00.
14
Risk factors
An investment in our common shares involves a high degree of risk. You should carefully consider all of the
information set forth in this offering memorandum and the risks described below before deciding whether to
invest in our common shares. Additional risks not currently known to us or that we now consider immaterial
could also adversely affect our operations and the value of your investment. If any of these risks actually occur,
our business, financial condition or results of operations could be adversely affected. In that case, the market
price for our common shares could decline and you could lose all or part of your investment in our common
shares.
RISKS RELATING TO BRAZIL
The Brazilian government has exercised, and continues to exercise, significant influence over the Brazilian
economy. This influence, as well as Brazilian political and economic conditions, could have a material
adverse effect on us and on the market price of our common shares.
The Brazilian government frequently intervenes in the Brazilian economy and occasionally makes significant
changes in policy and regulations. The Brazilian government’s actions to control inflation and other policies and
regulations have often resulted in increases in interest rates, changes in tax policies, price controls, currency
devaluations, capital controls and limits on imports, among other measures. We may be materially adversely
affected by changes in policies or regulations involving or affecting factors such as:
➢ exchange rate fluctuations;
➢ exchange controls and restrictions, such as those which were briefly imposed in 1989 and 1990;
➢ inflation;
➢ interest rates;
➢ tax policies;
➢ economic growth;
➢ liquidity of domestic financial and capital markets; and
➢ other political, social and economic measures that may be implemented or affect Brazil.
Uncertainty over whether the Brazilian government will implement changes in policies or regulations affecting
these or other factors may contribute to economic uncertainty in Brazil and to heightened volatility in the
Brazilian securities market and securities issued by Brazilian issuers. These uncertainties may have a material
adverse effect on us and may also adversely affect the market price of our common shares.
In October 2006, presidential elections were held and President Luis Inácio Lula da Silva was re-elected. We
cannot predict what policies will be maintained or adopted by the Brazilian government and whether these
policies will negative affect the economy or us or the market price of our common shares.
Developments and the perception of risk in other countries, specifically in emerging market countries,
may affect the market price of Brazilian securities, including our common shares.
The market value of securities of Brazilian companies is affected to varying degrees by economic and market
conditions in other countries, including countries in Latin American and emerging market countries. Although
economic conditions of these countries are significantly different from the economic conditions in Brazil,
investors’ reactions to developments in these other countries may have an adverse effect on the market value of
securities of Brazilian companies. Crises in other emerging market countries may reduce investor interest in
15
Risk factors
securities of Brazilian companies, including our common shares. This could adversely affect the market price of
our common shares and make it more difficult for us to gain access to the capital markets and finance our
operations in the future on acceptable terms or at all.
The Brazilian government’s efforts to combat inflation may significantly influence economic uncertainty
in Brazil and could harm us and the market value of our common shares.
Brazil has in the past experienced extremely high rates of inflation. Inflation, and the Brazilian government’s
efforts to combat inflation, have had significant negative effects on the Brazilian economy, contributing to
economic uncertainty and heightened volatility in the Brazilian securities markets. The Brazilian government’s
measures to control inflation have often included maintaining a tight monetary policy with high interest rates,
thereby restricting the availability of credit and reducing economic growth. The annual inflation rate, as
measured by the General Price Index—Internal Availability (Índice Geral de Preços Disponibilidade Interna), or
IGP-DI, reached 2,708% in 1993. Although inflation rates have been substantially lower since 1994 than in
previous periods, inflationary pressures may persist. Annual inflation rates at the end of 2001, 2002, 2003, 2004,
2005 and 2006 were 10.4%, 26.4%, 7.7%, 12.1%, 1.4% and 3.8%, respectively, as measured by the IGP-DI.
Brazil may experience high levels of inflation in the future. Inflationary pressures may cause governmental
interventions in the economy, including the introduction of governmental policies that may adversely affect our
business and, consequently, the market price of our common shares. If investor confidence lags, the liquidity of
the Brazilian economy and the price of our common shares may be affected.
Future inflationary measures may also adversely affect consumption in the Brazilian retail market. As a result,
our suppliers may be forced to increase the price of their products to compensate for inflation. We cannot predict
whether we will be able to transfer any such increase in the cost of our products to our consumers in the future
and whether this will adversely affect our operating results and, consequently, the market price of our common
shares.
High inflation rates could result in higher interest rates, thereby affecting our cost of funding, and could have a
material adverse effect on the level of our debt in reais and may adversely affect our operating margins.
Exchange rate instability may have a material adverse effect on us and on the market price of our common
shares.
The real has experienced frequent and substantial devaluations in relation to the U.S. dollar and other foreign
currencies during the last decades. Throughout this period, the Brazilian government has implemented various
economic plans and utilized a number of exchange rate policies, including sudden devaluations, periodic
mini-devaluations during which the frequency of adjustments has ranged from daily to monthly, floating
exchange rate systems, exchange controls and dual exchange rate markets. From time to time, there have been
significant fluctuations in the exchange rate between the real and the U.S. dollar and other currencies. On
March 31, 2007, the foreign exchange rate between the real and U.S. dollar was R$2.0504 to US$1.00,
representing an appreciation of the real of approximately 4.9% compared to December 31, 2006. We cannot
assure you that the foreign exchange rate between the real and U.S. dollar will remain the same.
The devaluation of the real against the U.S. dollar and other foreign currencies could create additional
inflationary pressures in Brazil and cause increases in interest rates, which could negatively affect consumption
in the Brazilian retail market and the Brazilian economy as a whole and have a material adverse effect on us. It
could also affect our ability to bear our costs and obligations in foreign currencies, which could adversely affect
us and the market price of our common shares.
16
Risk factors
RISKS RELATING TO OUR INDUSTRY
The retail industry is sensitive to decreases in consumer purchasing power and unfavorable economic
cycles.
Historically, the Brazilian retail industry has been susceptible to downturns in the Brazilian economy, which
decrease consumers’ purchasing power. The success of our operations depends, among other things, on
consumers’ purchasing power, which, in turn, depends on the levels of income and on overall business
conditions, interest rates, inflation, credit availability to the consumer, taxation, consumer with respect to future
economic conditions, unemployment levels and wages.
A significant downturn in the Brazilian economy may adversely reduce consumers’ purchasing power and
available income, which could adversely affect our sales, operating results and financial condition.
The retail apparel market is highly competitive.
The Brazilian and foreign retail apparel market is characterized by strong and increasing competition and we
have several competitors in these markets. Moreover, we may face competition from new players entering the
market, which could change our competitive outlook. In the event that we are not able to effectively compete in
the Brazilian and foreign retail apparel market, our operating results may be adversely affected.
Our sales and inventory levels are exposed to seasonality.
Our sales are typically higher in the fourth quarter of each year as a result of the Christmas season. In 2006,
28.3% of our sales in the domestic market were made during this period. Any economic downturn, suspension of
our business or delay on the delivery of raw materials to us by our suppliers in the last quarter of the year may
adversely affect our operating results. Moreover, during the Christmas period, we must proportionally increase
our inventory levels and hire additional employees in order to properly meet the additional consumer demand. As
a result, any unexpected decrease or an inaccurate estimate of demand for our products during this period may
force us to sell excess inventory at lower prices, which could have a material adverse effect on us.
Our operating results may be adversely affected by climate fluctuations.
Our business may be adversely affected by unseasonable climatic conditions. We cannot predict prolonged
periods of hot temperatures during the winter or cold temperatures during the summer, which could cause our
inventory levels to be misaligned with consumer demand during these unexpected conditions. As a result,
unseasonable climatic conditions may force us to sell our excess inventory at low prices, which could have a
material adverse effect on us.
The principal raw material of our products is cotton, the price of which is established in the international
market and is denominated in U.S. dollars.
As we operate in the apparel industry, our principal raw material is cotton and its by-products (such as fibers and
textiles). The price of cotton is established in accordance with the worldwide variation of supply and demand and
is generally denominated in U.S. dollars. In the event of a significant increase in cotton prices, or an increase in
the value of the U.S. dollar against the real, we may not be able to transfer these costs to our consumers, which
may decrease our profit margins and adversely affect our business.
17
Risk factors
RISKS RELATING TO OUR BUSINESS
We may not be able to identify or promptly and accurately respond to changes in apparel industry trends
and consumer preferences.
Our sales and operating results depend on our ability to manage inventories and predict, identify and respond
promptly to changes in apparel industry trends and consumer preferences. Due to their nature, however, our
estimates carry a degree of risk.
In the event that we are not able to predict, identify or respond to changes in apparel trends and consumer
preferences or in the event we are not able to properly analyze the market for the sale of our products or any new
line of products, our sales may decrease and, therefore, we may not be able to sell a significant volume of our
inventory. As a result, we may be forced to lower the prices of our products or carry out promotional sales to sell
our inventory, which could have a material adverse effect on us.
Our information technology systems are subject to possible failures, which may adversely affect our
business.
Our operations depend on the operational security, reliability and stability of several systems comprising our
information technology platform, such as the systems related to points of sale, logistics and communications,
among others. Our existing contingency plans do not assure complete and prompt recovery of our activities in the
event of any accident or failure in our information technology systems. In the event our information technology
systems do not operate properly, our business may be adversely affected.
We are subject to risks related to our distribution centers.
Currently, we have three distribution centers located in the southern and midwestern regions of Brazil. All of our
products are distributed through these distribution centers. In the event of significant damage to any of these
distribution centers, we would be unable to distribute all our products on schedule and our business may be
adversely affected.
The departure of members of our management or key employees, or our failure to attract and retain
qualified personnel to replace them, may adversely affect us.
Our ability to be competitive and meet our growth strategies depends on our management, which is comprised of
experienced executives and key employees with a deep understanding of our business. We cannot assure you that
we will be able to attract and retain qualified personnel to our management or to occupy key positions. The
departure of any member of our management or key employee, or our failure to attract and retain qualified
personnel to replace them, may adversely affect our financial condition and results of operations.
We may face difficulties in successfully launching new stores, which may adversely affect our net sales and
operating results.
Our growth depends on the successful launching of new owned and franchised stores. We intend to launch a
significant number of new owned and franchised stores over the next years. Our ability to open new stores,
however, is subject to a number of risks and uncertainties, including an increase in competitors and in
competition in strategic points of sale, difficulty in finding adequate locations, as well as ongoing periodic
refurbishments of existing stores. In addition, our recently launched architectural refurbishment project for
Hering stores may not result in the increased sales and additional customers we expect. In the event we are not
able to launch or successfully operate new stores, our results of operations and the market price of our common
shares may be adversely affected.
18
Risk factors
We are subject to extensive environmental and health regulations, which may become stricter in the future
and thereby increase the costs necessary to comply with applicable regulatory requirements.
We are subject to extensive Brazilian federal, state and local environmental and health regulations, including
inspections by government agencies which regulate, among other things: (i) the emission and disposal of
hazardous materials into the ground, air and water; (ii) the generation, storage, handling, usage and transportation
of hazardous materials; and (iii) the health and security of our employees. We are required to obtain permits from
appropriate governmental authorities in connection with certain aspects of our operations and any expansion of
our operations will be subject to our further ability to obtain additional permits. Under current regulations, we are
required to maintain pollution control equipment, as well as to make operational changes to limit negative effects
or potential negative effects on the environment and the health and safety of our employees.
Any inability to comply with these regulations may subject us to significant fines, revocation of our licenses,
suspension of our activities or possible criminal penalties, which may result in a material adverse effect on us.
We may also be required to allocate significant resources and increase our capital expenditures in order to
comply with these regulations, which could reduce other planned expenditures and negatively affect our financial
condition and operating results. We cannot assure that the costs arising from our compliance with all present and
future environmental protection rules will not have a material adverse effect on us. We may also be responsible
for significant costs for environmental recovery. Moreover, a governmental decision to reject the renewal, or
delay the issuance of, a new license, or to modify an existing license, may negatively affect the continuity of our
operations at the relevant manufacturing facility.
In the event of significant devaluation of the real, we may not have the sufficient financial resources to
service our foreign currency denominated indebtedness arising from the issuance of Eurobonds.
After the Brazilian foreign exchange crisis of 1999, we were required to restructure our real and foreign currency
denominated debt by extending maturities and reducing interest rates. As a result, we maintained, under the terms
and conditions of the restructuring, our debt in foreign currencies, represented primarily by Eurobonds maturing
in 2007, 2008 and 2009. As of March 31, 2007, the aggregate principal amount of our Eurobonds was
R$60.5 million (US$ 29.7 million) and accrued interest thereon was R$1.7 million (US$0.8 million). We have
not entered into hedging transactions to cover the foreign exchange risks related to these obligations. As a result,
in the event of significant devaluation of the real, we may not be able to service the indebtedness represented by
the Eurobonds, which could adversely affect our results of operations and financial condition.
We received a tax assessment related to our Eurobonds. In the event that we are not able to obtain a
favorable outcome from the administrative claim we have filed, we may be obligated to pay a significant
tax assessment to the Brazilian government.
We received a tax assessment from the Brazilian Federal Revenue Service (Secretaria da Receita Federal)
alleging a failure to pay withholding tax in connection with the purchase of our Eurobonds by one of our
subsidiaries in December 2000, April, May and December 2001, and April and May 2002. We have filed an
appeal challenging the constitutionality of the tax assessment and our legal advisors consider the chances of an
unfavorable outcome to be remote. However, there is no prior case law on the matter, and we cannot assure a
favorable outcome. In the event of an unfavorable outcome, we would be required to pay taxes not collected, plus
interest and fines (equal to 150% of the taxes not collected). The amount payable, which was equivalent to
approximately R$34.5 million as of March 31, 2007, would immediately be recorded in our balance sheet, and
would negatively affect our business and our results of operations. See “Business—Legal and administrative
contingencies—Tax proceedings.”
19
Hering final prospectus

Más contenido relacionado

Destacado

Prospecto Definitivo Hering
Prospecto Definitivo HeringProspecto Definitivo Hering
Prospecto Definitivo HeringCia Hering RI
 
Us patent cases weekly update january 13th january 20th 2015
Us patent cases weekly update  january 13th january 20th 2015Us patent cases weekly update  january 13th january 20th 2015
Us patent cases weekly update january 13th january 20th 2015InvnTree IP Services Pvt. Ltd.
 
Listado de 500 mayores aportantes a la set 2014 22 may15
Listado de 500 mayores aportantes a la set 2014 22 may15Listado de 500 mayores aportantes a la set 2014 22 may15
Listado de 500 mayores aportantes a la set 2014 22 may15Richard Moreira
 
Protocolo de investigación. identificación de áreas de inundacion en tramo cr...
Protocolo de investigación. identificación de áreas de inundacion en tramo cr...Protocolo de investigación. identificación de áreas de inundacion en tramo cr...
Protocolo de investigación. identificación de áreas de inundacion en tramo cr...Enrique Santana
 
Agricultura Orgânica e Certificação - Canal com o Produtor
Agricultura Orgânica e Certificação - Canal com o ProdutorAgricultura Orgânica e Certificação - Canal com o Produtor
Agricultura Orgânica e Certificação - Canal com o ProdutorIdesam
 
Vishak_2256- Dissertation final doc - reduced size
Vishak_2256- Dissertation final doc - reduced sizeVishak_2256- Dissertation final doc - reduced size
Vishak_2256- Dissertation final doc - reduced sizeVishak Gopi
 
Orientações para a elaboração e apresentação de projeto de barragem
Orientações para a elaboração e apresentação de projeto de barragemOrientações para a elaboração e apresentação de projeto de barragem
Orientações para a elaboração e apresentação de projeto de barragemiicabrasil
 
Apostila contabilidade rural
Apostila contabilidade ruralApostila contabilidade rural
Apostila contabilidade ruraladmcontabil
 

Destacado (12)

Prospecto Definitivo Hering
Prospecto Definitivo HeringProspecto Definitivo Hering
Prospecto Definitivo Hering
 
Apimec 2005
Apimec 2005Apimec 2005
Apimec 2005
 
Us patent cases weekly update january 13th january 20th 2015
Us patent cases weekly update  january 13th january 20th 2015Us patent cases weekly update  january 13th january 20th 2015
Us patent cases weekly update january 13th january 20th 2015
 
Apontamentos dende
Apontamentos dendeApontamentos dende
Apontamentos dende
 
LIÇÃO 10 - As setenta semanas
LIÇÃO 10 - As setenta semanasLIÇÃO 10 - As setenta semanas
LIÇÃO 10 - As setenta semanas
 
Listado de 500 mayores aportantes a la set 2014 22 may15
Listado de 500 mayores aportantes a la set 2014 22 may15Listado de 500 mayores aportantes a la set 2014 22 may15
Listado de 500 mayores aportantes a la set 2014 22 may15
 
Protocolo de investigación. identificación de áreas de inundacion en tramo cr...
Protocolo de investigación. identificación de áreas de inundacion en tramo cr...Protocolo de investigación. identificación de áreas de inundacion en tramo cr...
Protocolo de investigación. identificación de áreas de inundacion en tramo cr...
 
Agricultura Orgânica e Certificação - Canal com o Produtor
Agricultura Orgânica e Certificação - Canal com o ProdutorAgricultura Orgânica e Certificação - Canal com o Produtor
Agricultura Orgânica e Certificação - Canal com o Produtor
 
Vishak_2256- Dissertation final doc - reduced size
Vishak_2256- Dissertation final doc - reduced sizeVishak_2256- Dissertation final doc - reduced size
Vishak_2256- Dissertation final doc - reduced size
 
Orientações para a elaboração e apresentação de projeto de barragem
Orientações para a elaboração e apresentação de projeto de barragemOrientações para a elaboração e apresentação de projeto de barragem
Orientações para a elaboração e apresentação de projeto de barragem
 
Manual del Huerto Escolar
Manual del Huerto EscolarManual del Huerto Escolar
Manual del Huerto Escolar
 
Apostila contabilidade rural
Apostila contabilidade ruralApostila contabilidade rural
Apostila contabilidade rural
 

Similar a Hering final prospectus

Zeus Executive Summary Revision Apr 06
Zeus Executive Summary Revision Apr 06Zeus Executive Summary Revision Apr 06
Zeus Executive Summary Revision Apr 06Luis Nassif
 
Adani Green Energy Limited Offering Circular.pdf
Adani Green Energy Limited Offering Circular.pdfAdani Green Energy Limited Offering Circular.pdf
Adani Green Energy Limited Offering Circular.pdfHindenburg Research
 
Prospectus
ProspectusProspectus
Prospectuskbasset
 
Prospectus (2017)
Prospectus (2017)Prospectus (2017)
Prospectus (2017)kbasset
 
GCM Corporate Presentation 02 28, 2019
GCM Corporate Presentation 02 28, 2019GCM Corporate Presentation 02 28, 2019
GCM Corporate Presentation 02 28, 2019GranColombiaGold
 
Mendoza extiende plazo de negociación
Mendoza extiende plazo de negociaciónMendoza extiende plazo de negociación
Mendoza extiende plazo de negociaciónSantiago Montiveros
 
TransBioTec: Offering Memorandum
TransBioTec: Offering MemorandumTransBioTec: Offering Memorandum
TransBioTec: Offering MemorandumTransBioTec
 
Kazakh Railways Investor Presentation
Kazakh Railways Investor PresentationKazakh Railways Investor Presentation
Kazakh Railways Investor Presentationktzhpress
 
AIM Prospectus Page
AIM Prospectus PageAIM Prospectus Page
AIM Prospectus PageRick Renner
 
Alexander Elbanna - Founder at Digital World Exchange
Alexander Elbanna - Founder at Digital World ExchangeAlexander Elbanna - Founder at Digital World Exchange
Alexander Elbanna - Founder at Digital World ExchangeAlexander Elbanna
 
LOL (A) 5M BANK LEASE CONTRACT 2015 v2 2015 05
LOL (A) 5M BANK LEASE CONTRACT 2015 v2 2015 05LOL (A) 5M BANK LEASE CONTRACT 2015 v2 2015 05
LOL (A) 5M BANK LEASE CONTRACT 2015 v2 2015 05David Gribkowski
 
Northern Empire Resources Corp
Northern Empire Resources CorpNorthern Empire Resources Corp
Northern Empire Resources Corpnorthernempire
 
BF Token Sale Institutional Investor Deck (Strictly Private & Confidential)
BF Token Sale Institutional Investor Deck (Strictly Private & Confidential)BF Token Sale Institutional Investor Deck (Strictly Private & Confidential)
BF Token Sale Institutional Investor Deck (Strictly Private & Confidential)Simon Dixon
 
100322 ing bank rd
100322 ing bank rd100322 ing bank rd
100322 ing bank rdgeomerits
 
International Metals Trading, LLC 506c Offering Memorandum
International Metals Trading, LLC 506c Offering MemorandumInternational Metals Trading, LLC 506c Offering Memorandum
International Metals Trading, LLC 506c Offering MemorandumScott J. Levine
 
Province of mendoza extension of expiration and consent payment eligibility...
Province of mendoza   extension of expiration and consent payment eligibility...Province of mendoza   extension of expiration and consent payment eligibility...
Province of mendoza extension of expiration and consent payment eligibility...Mendoza Post
 

Similar a Hering final prospectus (20)

Zeus Executive Summary Revision Apr 06
Zeus Executive Summary Revision Apr 06Zeus Executive Summary Revision Apr 06
Zeus Executive Summary Revision Apr 06
 
Adani Green Energy Limited Offering Circular.pdf
Adani Green Energy Limited Offering Circular.pdfAdani Green Energy Limited Offering Circular.pdf
Adani Green Energy Limited Offering Circular.pdf
 
Prospectus
ProspectusProspectus
Prospectus
 
Prospectus (2017)
Prospectus (2017)Prospectus (2017)
Prospectus (2017)
 
GCM Corporate Presentation 02 28, 2019
GCM Corporate Presentation 02 28, 2019GCM Corporate Presentation 02 28, 2019
GCM Corporate Presentation 02 28, 2019
 
Mendoza extiende plazo de negociación
Mendoza extiende plazo de negociaciónMendoza extiende plazo de negociación
Mendoza extiende plazo de negociación
 
TransBioTec: Offering Memorandum
TransBioTec: Offering MemorandumTransBioTec: Offering Memorandum
TransBioTec: Offering Memorandum
 
Kazakh Railways Investor Presentation
Kazakh Railways Investor PresentationKazakh Railways Investor Presentation
Kazakh Railways Investor Presentation
 
AIM Prospectus Page
AIM Prospectus PageAIM Prospectus Page
AIM Prospectus Page
 
Alexander Elbanna - Founder at Digital World Exchange
Alexander Elbanna - Founder at Digital World ExchangeAlexander Elbanna - Founder at Digital World Exchange
Alexander Elbanna - Founder at Digital World Exchange
 
Conforama
ConforamaConforama
Conforama
 
LOL (A) 5M BANK LEASE CONTRACT 2015 v2 2015 05
LOL (A) 5M BANK LEASE CONTRACT 2015 v2 2015 05LOL (A) 5M BANK LEASE CONTRACT 2015 v2 2015 05
LOL (A) 5M BANK LEASE CONTRACT 2015 v2 2015 05
 
Investor relations 101
Investor relations 101Investor relations 101
Investor relations 101
 
Northern Empire Resources Corp
Northern Empire Resources CorpNorthern Empire Resources Corp
Northern Empire Resources Corp
 
INNO Holdings Presentation
INNO Holdings PresentationINNO Holdings Presentation
INNO Holdings Presentation
 
Building the next gold giant
Building the next gold giantBuilding the next gold giant
Building the next gold giant
 
BF Token Sale Institutional Investor Deck (Strictly Private & Confidential)
BF Token Sale Institutional Investor Deck (Strictly Private & Confidential)BF Token Sale Institutional Investor Deck (Strictly Private & Confidential)
BF Token Sale Institutional Investor Deck (Strictly Private & Confidential)
 
100322 ing bank rd
100322 ing bank rd100322 ing bank rd
100322 ing bank rd
 
International Metals Trading, LLC 506c Offering Memorandum
International Metals Trading, LLC 506c Offering MemorandumInternational Metals Trading, LLC 506c Offering Memorandum
International Metals Trading, LLC 506c Offering Memorandum
 
Province of mendoza extension of expiration and consent payment eligibility...
Province of mendoza   extension of expiration and consent payment eligibility...Province of mendoza   extension of expiration and consent payment eligibility...
Province of mendoza extension of expiration and consent payment eligibility...
 

Más de Cia Hering RI

Cia. Hering – 3Q17 Results
Cia. Hering – 3Q17 ResultsCia. Hering – 3Q17 Results
Cia. Hering – 3Q17 ResultsCia Hering RI
 
Cia. Hering – Resultados 3T17
Cia. Hering – Resultados 3T17Cia. Hering – Resultados 3T17
Cia. Hering – Resultados 3T17Cia Hering RI
 
Cia. Hering – Resultados 2T17
Cia. Hering – Resultados 2T17Cia. Hering – Resultados 2T17
Cia. Hering – Resultados 2T17Cia Hering RI
 
Cia. Hering – 2Q17 Results
Cia. Hering – 2Q17 ResultsCia. Hering – 2Q17 Results
Cia. Hering – 2Q17 ResultsCia Hering RI
 
Cia. Hering – Resultados 1T17
Cia. Hering – Resultados 1T17Cia. Hering – Resultados 1T17
Cia. Hering – Resultados 1T17Cia Hering RI
 
Cia. Hering – 1Q17 Results
Cia. Hering – 1Q17 ResultsCia. Hering – 1Q17 Results
Cia. Hering – 1Q17 ResultsCia Hering RI
 
Cia. Hering - 4Q16 Results
Cia. Hering - 4Q16 ResultsCia. Hering - 4Q16 Results
Cia. Hering - 4Q16 ResultsCia Hering RI
 
Cia. Hering - Resultados 4T16
Cia. Hering - Resultados 4T16Cia. Hering - Resultados 4T16
Cia. Hering - Resultados 4T16Cia Hering RI
 
Cia. Hering Investor's Day 2016_port
Cia. Hering Investor's Day 2016_portCia. Hering Investor's Day 2016_port
Cia. Hering Investor's Day 2016_portCia Hering RI
 
Cia. Hering Investor's Day 2016_inglês
Cia. Hering Investor's Day 2016_inglêsCia. Hering Investor's Day 2016_inglês
Cia. Hering Investor's Day 2016_inglêsCia Hering RI
 
Cia. Hering - Resultados 3T16
Cia. Hering - Resultados 3T16Cia. Hering - Resultados 3T16
Cia. Hering - Resultados 3T16Cia Hering RI
 
Cia. Hering - 3Q16 Results
Cia. Hering - 3Q16 ResultsCia. Hering - 3Q16 Results
Cia. Hering - 3Q16 ResultsCia Hering RI
 
Cia. Hering - Resultados 2T16
Cia. Hering - Resultados 2T16Cia. Hering - Resultados 2T16
Cia. Hering - Resultados 2T16Cia Hering RI
 
Cia. Hering - 2Q16 Results
Cia. Hering - 2Q16 ResultsCia. Hering - 2Q16 Results
Cia. Hering - 2Q16 ResultsCia Hering RI
 
Cia. Hering - Resultados 1T16
Cia. Hering - Resultados 1T16Cia. Hering - Resultados 1T16
Cia. Hering - Resultados 1T16Cia Hering RI
 
Cia. Hering - 1Q16 Results
Cia. Hering - 1Q16 ResultsCia. Hering - 1Q16 Results
Cia. Hering - 1Q16 ResultsCia Hering RI
 
Apresentação de Resultados 4T15 e 2015
Apresentação de Resultados 4T15 e 2015Apresentação de Resultados 4T15 e 2015
Apresentação de Resultados 4T15 e 2015Cia Hering RI
 
Earnings Presentation - 4Q15 and 2015
Earnings Presentation - 4Q15 and 2015Earnings Presentation - 4Q15 and 2015
Earnings Presentation - 4Q15 and 2015Cia Hering RI
 
Hering day15 apresentação final_engl
Hering day15 apresentação final_englHering day15 apresentação final_engl
Hering day15 apresentação final_englCia Hering RI
 
Cia. Hering Apresentação 3T15
Cia. Hering Apresentação 3T15 Cia. Hering Apresentação 3T15
Cia. Hering Apresentação 3T15 Cia Hering RI
 

Más de Cia Hering RI (20)

Cia. Hering – 3Q17 Results
Cia. Hering – 3Q17 ResultsCia. Hering – 3Q17 Results
Cia. Hering – 3Q17 Results
 
Cia. Hering – Resultados 3T17
Cia. Hering – Resultados 3T17Cia. Hering – Resultados 3T17
Cia. Hering – Resultados 3T17
 
Cia. Hering – Resultados 2T17
Cia. Hering – Resultados 2T17Cia. Hering – Resultados 2T17
Cia. Hering – Resultados 2T17
 
Cia. Hering – 2Q17 Results
Cia. Hering – 2Q17 ResultsCia. Hering – 2Q17 Results
Cia. Hering – 2Q17 Results
 
Cia. Hering – Resultados 1T17
Cia. Hering – Resultados 1T17Cia. Hering – Resultados 1T17
Cia. Hering – Resultados 1T17
 
Cia. Hering – 1Q17 Results
Cia. Hering – 1Q17 ResultsCia. Hering – 1Q17 Results
Cia. Hering – 1Q17 Results
 
Cia. Hering - 4Q16 Results
Cia. Hering - 4Q16 ResultsCia. Hering - 4Q16 Results
Cia. Hering - 4Q16 Results
 
Cia. Hering - Resultados 4T16
Cia. Hering - Resultados 4T16Cia. Hering - Resultados 4T16
Cia. Hering - Resultados 4T16
 
Cia. Hering Investor's Day 2016_port
Cia. Hering Investor's Day 2016_portCia. Hering Investor's Day 2016_port
Cia. Hering Investor's Day 2016_port
 
Cia. Hering Investor's Day 2016_inglês
Cia. Hering Investor's Day 2016_inglêsCia. Hering Investor's Day 2016_inglês
Cia. Hering Investor's Day 2016_inglês
 
Cia. Hering - Resultados 3T16
Cia. Hering - Resultados 3T16Cia. Hering - Resultados 3T16
Cia. Hering - Resultados 3T16
 
Cia. Hering - 3Q16 Results
Cia. Hering - 3Q16 ResultsCia. Hering - 3Q16 Results
Cia. Hering - 3Q16 Results
 
Cia. Hering - Resultados 2T16
Cia. Hering - Resultados 2T16Cia. Hering - Resultados 2T16
Cia. Hering - Resultados 2T16
 
Cia. Hering - 2Q16 Results
Cia. Hering - 2Q16 ResultsCia. Hering - 2Q16 Results
Cia. Hering - 2Q16 Results
 
Cia. Hering - Resultados 1T16
Cia. Hering - Resultados 1T16Cia. Hering - Resultados 1T16
Cia. Hering - Resultados 1T16
 
Cia. Hering - 1Q16 Results
Cia. Hering - 1Q16 ResultsCia. Hering - 1Q16 Results
Cia. Hering - 1Q16 Results
 
Apresentação de Resultados 4T15 e 2015
Apresentação de Resultados 4T15 e 2015Apresentação de Resultados 4T15 e 2015
Apresentação de Resultados 4T15 e 2015
 
Earnings Presentation - 4Q15 and 2015
Earnings Presentation - 4Q15 and 2015Earnings Presentation - 4Q15 and 2015
Earnings Presentation - 4Q15 and 2015
 
Hering day15 apresentação final_engl
Hering day15 apresentação final_englHering day15 apresentação final_engl
Hering day15 apresentação final_engl
 
Cia. Hering Apresentação 3T15
Cia. Hering Apresentação 3T15 Cia. Hering Apresentação 3T15
Cia. Hering Apresentação 3T15
 

Hering final prospectus

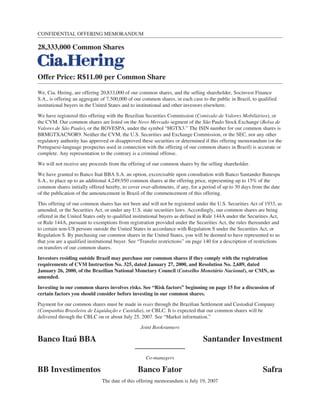
  • 1. CONFIDENTIAL OFFERING MEMORANDUM 28,333,000 Common Shares Offer Price: R$11.00 per Common Share We, Cia. Hering, are offering 20,833,000 of our common shares, and the selling shareholder, Socinvest Finance S.A., is offering an aggregate of 7,500,000 of our common shares, in each case to the public in Brazil, to qualified institutional buyers in the United States and to institutional and other investors elsewhere. We have registered this offering with the Brazilian Securities Commission (Comissão de Valores Mobiliários), or the CVM. Our common shares are listed on the Novo Mercado segment of the São Paulo Stock Exchange (Bolsa de Valores de São Paulo), or the BOVESPA, under the symbol “HGTX3.” The ISIN number for our common shares is BRMGTXACNOR9. Neither the CVM, the U.S. Securities and Exchange Commission, or the SEC, nor any other regulatory authority has approved or disapproved these securities or determined if this offering memorandum (or the Portuguese-language prospectus used in connection with the offering of our common shares in Brazil) is accurate or complete. Any representation to the contrary is a criminal offense. We will not receive any proceeds from the offering of our common shares by the selling shareholder. We have granted to Banco Itaú BBA S.A. an option, excercisable upon consultation with Banco Santander Banespa S.A., to place up to an additional 4,249,950 common shares at the offering price, representing up to 15% of the common shares initially offered hereby, to cover over-allotments, if any, for a period of up to 30 days from the date of the publication of the announcement in Brazil of the commencement of this offering. This offering of our common shares has not been and will not be registered under the U.S. Securities Act of 1933, as amended, or the Securities Act, or under any U.S. state securities laws. Accordingly, our common shares are being offered in the United States only to qualified institutional buyers as defined in Rule 144A under the Securities Act, or Rule 144A, pursuant to exemptions from registration provided under the Securities Act, the rules thereunder and to certain non-US persons outside the United States in accordance with Regulation S under the Securities Act, or Regulation S. By purchasing our common shares in the United States, you will be deemed to have represented to us that you are a qualified institutional buyer. See “Transfer restrictions” on page 140 for a description of restrictions on transfers of our common shares. Investors residing outside Brazil may purchase our common shares if they comply with the registration requirements of CVM Instruction No. 325, dated January 27, 2000, and Resolution No. 2,689, dated January 26, 2000, of the Brazilian National Monetary Council (Conselho Monetário Nacional), or CMN, as amended. Investing in our common shares involves risks. See “Risk factors” beginning on page 15 for a discussion of certain factors you should consider before investing in our common shares. Payment for our common shares must be made in reais through the Brazilian Settlement and Custodial Company (Companhia Brasileira de Liquidação e Custódia), or CBLC. It is expected that our common shares will be delivered through the CBLC on or about July 25, 2007. See “Market information.” Joint Bookrunners Banco Itaú BBA Santander Investment Co-managers BB Investimentos Banco Fator Safra The date of this offering memorandum is July 19, 2007
  • 2. You should only rely on the information contained in this offering memorandum. Neither we, the selling shareholder, the Brazilian underwriters nor the agents appointed by the Brazilian underwriters to facilitate the placement of common shares outside of Brazil, or the agents, have authorized anyone to provide you with information that is different or additional from that contained in this offering memorandum. If anyone provides you with different or additional information, you should not rely on it. You should assume that the information in this offering memorandum is accurate only as of the date on the front cover of this offering memorandum, regardless of time of delivery of this offering memorandum or any sale of our common shares. Our business, financial condition, results of operations and prospects may change after the date on the front cover of this offering memorandum. Neither we, the selling shareholder, the Brazilian underwriters nor the agents is making an offer to sell the common shares in any jurisdiction where the offer or sale is not permitted. This offering memorandum is highly confidential, and we have prepared it for use solely in connection with the proposed offering of our common shares outside Brazil. This offering memorandum is personal to the offeree to whom it has been delivered by the Brazilian underwriters or the agents and does not constitute an offer to any other person or to the public in general to subscribe for or otherwise to acquire our common shares. Distribution of this offering memorandum to any person other than the offeree and those persons, if any, retained to advise that offeree with respect thereto is unauthorized, and any disclosure of any of its contents without our prior written consent is prohibited. Each offeree, by accepting delivery of this offering memorandum, agrees to the foregoing and agrees to make no photocopies of this offering memorandum, in whole or in part. Neither the SEC, any state securities commission nor any other regulatory authority has approved or disapproved the securities nor have any of the foregoing authorities passed upon or endorsed the merits of this offering or the accuracy or adequacy of this offering memorandum. Any representation to the contrary is a criminal offense. We and the selling shareholder are relying on an exemption from registration under the Securities Act for offers and sales of securities that do not involve a public offering. Our common shares offered through this offering memorandum are subject to restrictions on transferability and resale and may not be transferred or resold in the United States except as permitted under the Securities Act and applicable U.S. state securities laws pursuant to registration or exemption from them. By purchasing the common shares, you will be deemed to have made the acknowledgements, representations and warranties and agreements described under the heading “Transfer restrictions” in this offering memorandum. You should be aware that you may be required to bear the financial risks of this investment for an indefinite period of time. In making an investment decision, you must rely on your own examination of our business and the terms of this offering, including the merits and risks involved. Investors residing outside Brazil, including institutional investors, may purchase or sell our common shares if they comply with the registration requirements of CVM Instruction No. 325, dated January 27, 2000, and Resolution No. 2,689, dated January 26, 2000, of the CMN. See “Market information.” You must comply with all applicable laws and regulations in force in any jurisdiction in which you purchase, offer or sell our common shares or possess or distribute this offering memorandum and must obtain any consent, approval or permission required for your purchase, offer or sale of our common shares under the laws and regulations in force in any jurisdiction to which you are subject or in which you make such purchases, offers or sales, and neither we, the selling shareholder, the Brazilian underwriters nor the agents will have any responsibility therefor. We, the selling shareholder, the Brazilian underwriters and the agents reserve the right to reject any offer to purchase, in whole or in part, and for any reason, our common shares offered hereby. We, the selling shareholder, the Brazilian underwriters and the agents also reserve the right to sell or place less than all of our common shares offered hereby. i
  • 3. In any Member State of the European Economic Area, or EEA, that has implemented Directive 2003/71/EC (together with any applicable implementing measures in any Member State, the Prospectus Directive), this communication is only addressed to and is only directed at qualified investors in that Member State within the meaning of the Prospectus Directive. This offering memorandum has been prepared on the basis that all offers of our common shares will be made pursuant to an exemption under the Prospectus Directive, as implemented in Member States of the EEA, from the requirement to produce a prospectus for offers of our common shares. Accordingly any person making or intending to make any offer within the EEA of our common shares, which are the subject of the offer contemplated in this offering memorandum should only do so in circumstances in which no obligation arises for us, the selling shareholder, or any of the Brazilian underwriters or agents to produce a prospectus for such offer. Neither we, the selling shareholder nor the Brazilian underwriters or agents have authorized, nor do they authorize, the making of any offer of our common shares through any financial intermediary, other than offers made by underwriters which constitute the final placement of our common shares contemplated in this offering memorandum. Each person in a Member State of the EEA which has implemented the Prospectus Directive (each, a Relevant Member State) who receives any communication in respect of, or who acquires any of our common shares under, the offers contemplated in this offering memorandum will be deemed to have represented, warranted and agreed to and with each Brazilian underwriter, agent, us and the selling shareholder that: ➢ it is a qualified investor within the meaning of the law in that Relevant Member State implementing Article 2(1)(e) of the Prospectus Directive; and ➢ in the case of any common shares acquired by it as a financial intermediary, as that term is used in Article 3(2) of the Prospectus Directive, (i) the common shares acquired by it in the offer have not been acquired on behalf of, nor have they been acquired with a view to their offer or resale to, persons in any Relevant Member State other than qualified investors, as that term is defined in the Prospectus Directive, or in circumstances in which the prior consent of the global coordinator has been given to the offer or resale; or (ii) where common shares have been acquired by it on behalf of persons in any Relevant Member State other than qualified investors, the offer of those common shares to it is not treated under the Prospectus Directive as having been made to such persons. For the purposes of this representation, the expression an “offer” in relation to any common shares in any Relevant Member State means the communication in any form and by any means of sufficient information on the terms of the offer and any common shares to be offered so as to enable an investor to decide to purchase or subscribe for our common shares, as the same may be varied in that Relevant Member State by any measure implementing the Prospectus Directive in that Relevant Member State. This document is being distributed and is only directed at persons who (i) are outside the United Kingdom, or (ii) are investment professionals under Article 19(5) of the Financial Services and Markets Act of 2000 (Financial Promotion) Order 2005, or the Order, or (iii) are high net worth entities and other persons to whom it may lawfully be communicated, falling under Article 49(2)(a) to (d), all such persons together being referred to as relevant persons. The common shares are only available to, and any invitation, offer or agreement to subscribe, purchase or acquire such common shares will only be engaged in with relevant persons. Any person who is not a relevant person should not act or rely on this document or any of its contents. This offering is being made in Brazil by a prospectus in Portuguese with the same date as this offering memorandum. The Brazilian prospectus, which has been filed with the CVM, is in a format different from that of this offering memorandum and contains certain information generally not included in documents such as this one. This offering is made in the United States and elsewhere outside Brazil solely on the basis of the information contained in this offering memorandum and you should take this information into account when making an investment decision. ii
  • 4. In connection with this offering, Banco Itaú BBA S.A., acting through Itaú Corretora de Valores S.A., by joint decision with Banco Santander Banespa S.A., may over-allot or effect transactions with a view to supporting the market price of our common shares at a level higher than that which might otherwise prevail. However, there is no assurance that Banco Itaú BBA S.A. or Itaú Corretora de Valores S.A. will engage in such transactions. Such stabilizing activities, if commenced, may be discontinued at any time and must be brought to an end after a limited period. Such stabilizing shall be in compliance with all applicable laws, regulations and rules. See “Plan of distribution.” We and the selling shareholder are not, and the Brazilian underwriters and the agents are not, making any representation, express or implied, to any purchaser of the securities regarding the legality of an investment in the securities by such purchaser under any legal investment or similar laws or regulations. You should not consider any information in this offering memorandum to be legal, business or tax advice. You should consult your own attorney, business advisor and tax advisor for legal, business and tax advice regarding an investment in the securities. No representation or warranty, express or implied, is made by the Brazilian underwriters or the agents as to the accuracy or completeness of any of the information set out in this offering memorandum, and nothing contained herein is or shall be relied upon as a promise or representation by the Brazilian underwriters or the agents, whether as to the past or the future. See “Forward-looking statements.” Notice to investors Notwithstanding anything to the contrary contained in this offering memorandum, except as reasonably necessary to comply with applicable securities laws, all persons may disclose to any and all persons, without limitation of any kind, the U.S. federal, state and local income tax treatment of the offering, any fact relevant to understanding the U.S. federal, state and local income tax treatment of the offering and all materials of any kind (including opinions or other tax analyses) relating to such U.S. federal, state and local income tax treatment; provided that no person may disclose the name of or identifying information with respect to any party identified herein or any pricing terms or other nonpublic business or financial information that is unrelated to the U.S. federal, state and local income tax treatment of the offering and is not relevant to understanding the U.S. federal, state and local income tax treatment of the offering. Notice to New Hampshire residents Neither the fact that a registration statement or an application for a license has been filed under RSA 421-B with the State of New Hampshire nor the fact that a security is effectively registered or a person is licensed in the State of New Hampshire implies that any document filed under RSA 421-B is true, complete and not misleading. Neither any such fact nor the fact that an exemption or exception is available for a security or a transaction means that the Secretary of State of the State of New Hampshire has passed in any way upon the merits or qualifications of, or recommended or given approval to, any person, security or transaction. It is unlawful to make, or cause to be made, to any prospective purchaser, customer or client any representation inconsistent with the provisions of this paragraph. iii
  • 5. Internal Revenue Service Circular 230 Disclosure Pursuant to Internal Revenue Service Circular 230, we hereby inform you that the description set forth herein with respect to U.S. federal tax issues was not intended or written to be used, and such description cannot be used, by any taxpayer for the purpose of avoiding any penalties that may be imposed on the taxpayer under the U.S. Internal Revenue Code. Such description was written to support the marketing of the common shares. Taxpayers should seek advice based on the taxpayer’s particular circumstances from an independent tax advisor. iv
  • 6. TABLE OF CONTENTS Page Forward-looking statements . . . . . . . . . . . . . . . vi Presentation of financial and other information . . . . . . . . . . . . . . . . . . . . . . . . . . vii Summary . . . . . . . . . . . . . . . . . . . . . . . . . . . . . . 1 Risk factors . . . . . . . . . . . . . . . . . . . . . . . . . . . . 15 Use of proceeds . . . . . . . . . . . . . . . . . . . . . . . . . 24 Market information . . . . . . . . . . . . . . . . . . . . . . 25 Exchange rates and exchange controls . . . . . . . 30 Capitalization . . . . . . . . . . . . . . . . . . . . . . . . . . 32 Dilution . . . . . . . . . . . . . . . . . . . . . . . . . . . . . . . 33 Selected financial and other information . . . . . 35 Management’s discussion and analysis of financial condition and results of operations . . . . . . . . . . . . . . . . . . . . . . . . . . . 41 Overview of the retail and apparel industry in Brazil . . . . . . . . . . . . . . . . . . . . . . . . . . . . . . . 69 Page Business . . . . . . . . . . . . . . . . . . . . . . . . . . . . . . 75 Management . . . . . . . . . . . . . . . . . . . . . . . . . . . 100 Principal shareholders and selling shareholder 107 Related party transactions . . . . . . . . . . . . . . . . . 110 Description of capital stock . . . . . . . . . . . . . . . 111 Dividends and dividend policy . . . . . . . . . . . . . 124 Taxation . . . . . . . . . . . . . . . . . . . . . . . . . . . . . . 128 Certain ERISA considerations . . . . . . . . . . . . . 135 Plan of distribution . . . . . . . . . . . . . . . . . . . . . . 136 Transfer restrictions . . . . . . . . . . . . . . . . . . . . . 139 Legal matters . . . . . . . . . . . . . . . . . . . . . . . . . . 143 Independent accountants . . . . . . . . . . . . . . . . . . 143 Enforcement of foreign judgments and service of process . . . . . . . . . . . . . . . . . . . . . . . . . . . 145 Index to financial statements . . . . . . . . . . . . . . F-1 v
  • 7. Forward-looking statements This offering memorandum includes forward-looking statements, in particular under “Summary,” “Risk factors,” “Management’s discussion and analysis of financial condition and results of operations” and “Business.” Our estimates and forward-looking statements are based principally on our current expectations and estimates on future events and trends, which affect or may affect our businesses and results. Although we believe that these estimates and forward-looking statements are based on reasonable assumptions, they are subject to several risks, uncertainties and assumptions and are based on information currently available to us. Our estimates and forward-looking statements may be affected by several factors, including, without limitation: ➢ the Brazilian economic, political and business scenarios; ➢ governmental interventions resulting in changes in the economy, taxes, tariffs, and regulatory environment in Brazil; ➢ our ability to fully implement our business strategies; ➢ sudden or unexpected fluctuations in the prices we pay for raw materials; ➢ our ability to successfully compete and run our business in the future; ➢ inflation and fluctuations in interest rates and exchange rates; ➢ other factors which may affect our financial situation, liquidity and operating results; and ➢ other risk factors discussed under “Risk factors.” Statements that depend on or are related to future or uncertain conditions or events, or that include the words “believe,” “anticipate,” “continue,” “expect,” “estimate,” “intend,” “plan,” “may,” “assume” and other variations, as well as similar words, are intended to identify forward-looking statements. Forward-looking statements include information concerning our potential or assumed future results of operations, business strategies, funding plans, competitive position, industry environment, potential growth opportunities and the effects of future regulation and competition. Forward-looking statements and estimates speak only as of the date they are made, and neither we nor the selling shareholder, the Brazilian underwriters or the agents undertake the obligation to update or revise any forward- looking statements after we distribute this offering memorandum to reflect new information, future events or other factors. In light of the risks and uncertainties described above, the forward-looking events and circumstances discussed in this offering memorandum may not occur or be accurate, and our future results of operations and performance may differ materially from those set out for a number of reasons. Any such forward- looking statements and estimates are not guarantees of future performance and involve risks and uncertainties. Given such limitations, you should not rely on these forward-looking statements to make a decision to invest in our common shares. vi
  • 8. Presentation of financial and other information Financial information Our financial information should be read in conjunction with our annual and interim individual and consolidated financial statements, prepared in accordance with accounting practices adopted in Brazil, or Brazilian GAAP, and the respective footnotes included elsewhere in this offering memorandum. Brazilian GAAP is based on: ➢ the Brazilian Corporate Law (Lei das Sociedades por Ações, or Law No. 6,404/76, as amended); ➢ the rules and regulations of the CVM; and ➢ accounting standards issued by the Brazilian Institute of Independent Accountants (Instituto dos Auditores Independentes do Brasil), or IBRACON, and the Brazilian Federal Accounting Council (Conselho Federal de Contabilidade), or CFC. Brazilian GAAP differs in certain significant respects from accounting principles generally accepted in the United States, or U.S. GAAP, and from International Financial Reporting Standards, or IFRS. There are significant differences between U.S. GAAP and IFRS and Brazilian GAAP. The financial statements of the Company and the consolidated financial statements of the Company and its subsidiaries contained in this offering memorandum differ from those that would have been prepared based upon U.S. GAAP or IFRS. We have made no attempt to identify or quantify the impact of these differences. No reconciliation to U.S. GAAP or IFRS of any of the financial statements presented in this offering memorandum has been prepared for the purpose of this offering memorandum or for any other purpose. There can be no assurance that reconciliations would not identify material quantitative differences as well as disclosures and presentation differences between our consolidated financial statements as prepared in accordance with Brazilian GAAP and the financial statements as prepared under U.S. GAAP or IFRS. The following financial statements are included in this offering memorandum: ➢ The individual and consolidated financial statements of the Company as of and for the years ended December 31, 2004, 2005 and 2006, audited by our independent accountants, in accordance with audit standards applicable in Brazil, as stated in their independent auditor report included elsewhere in this offering memorandum, which include the following qualification and explanatory paragraphs: - a qualification relating to the recognition of tax loss carryforwards amounting to R$25.0 million in 2002. Since the Company had not presented taxable income in three of the last five years, these tax loss carryforwards would not have been recorded based on CVM instructions. As a result, non current assets and shareholders’ equity for the years presented are overstated by R$25.0 million; - a qualification relating to the reversal in 2005 of exercise tax credits on exports previously recorded in 2003 against net income instead of retained earnings. Consequently, net income for the year ended December 31, 2005 was understated by R$35.0 million; - qualifications relating to (1) amortization of foreign currency losses accounted for as deferred charges in prior years. These foreign currency losses should have been recognized as incurred. Consequently, net loss for the year ended December 31, 2004 was overstated in the amount of R$2.7 million; and (2) unrecorded provision for contingencies related to tax credits inappropriately offset against taxes due for which the Company received an administrative assessment during the year ended December 31, 2004, and for losses related to the portion of such tax credits not yet realized which were recorded as current assets. As a result, as of December 31, 2004, current assets were overstated in R$25.4 million, noncurrent liabilities were understated by R$15.5 million, and shareholders equity and net loss for the year ended December 31, 2004 was understated in R$40.9 million; vii
  • 9. Presentation of financial and other information - an explanatory paragraph relating to the realization of income and social contribution tax credits amounting to R$41.0 million at December 31, 2006, 2005 and 2004 which are derived from tax loss carry forwards. The realization of such tax credits depends on the achievement of the budget which was approved by the board of directors, and the Company’s five-year strategic plan; and - an explanatory paragraph relating to the implementation of financial and operational restructuring plans of the Company. ➢ The individual and consolidated financial statements of the Company as of and for the three-month period ended March, 31, 2006, subject to a special review by our independent accountants in accordance with the procedures established by IBRACON and the CFC for a special review of interim financial information, as stated in their special review report included elsewhere in this offering memorandum, which contains a qualification related to tax credits arising from tax loss carryforwards in the amount of R$25.0 million and an emphasis paragraph on the utilization of tax credits of R$41.5 million arising from tax loss carryforwards which will depend on the successful fulfillment of the Company’s budget and strategic plan and the implementation of the Company’s operational and financial restructuring plan. ➢ The individual and consolidated financial statements of the Company as of and for the three-month period ended March, 31, 2007, subject to a special review by our independent accountants in accordance with the procedures established by IBRACON and the CFC for a special review of interim financial information, as stated in their special review report included elsewhere in this offering memorandum, contains an emphasis paragraph which states that the recoverability of deferred income tax assets in the amount of approximately R$49.6 million is subject to the achievement of future taxable profits. Other information The inclusion of Adjusted EBITDA information is intended to present a measure of our economic and operating performance and is determined in accordance with criteria established by the Company. Our Adjusted EBITDA means net income before interest, income tax and social contribution, depreciation and amortization, non-operating results and income from reversal of assignment of tax credits and expenses, and excludes non-operating results, which we believe are not part of the Company’s business cycle, and income from the reversal of the assignment of tax credits and expenses from the reversal of a credit related to an industrialized products tax we paid in connection with exported goods (IPI Credit), as we view these results are non-recurring income and expenses, because they have not occurred in the past two years and we expect that they will not occur within the next two years. Adjusted EBITDA is not a measure of financial performance in accordance with Brazilian GAAP and should not be considered individually, or as an alternative to net income as an indicator of operating performance, or as an alternative to operating cash flow, nor should it be considered as an indicator of liquidity. Adjusted EBITDA is not affected by debt restructuring processes, interest rate fluctuations, changes in tax rates or depreciation and amortization levels. Accordingly, we believe that Adjusted EBITDA is an important tool to compare our operating performance, over time, as well as to assist us in certain administrative decisions. We believe that Adjusted EBITDA provides a better understanding of our financial performance as well as our capacity to satisfy our liabilities and obtain funds for our capital expenditures and working capital. Adjusted EBITDA, however, presents limitations that prevent it from being used as an indicator of our profitability, as it does not consider certain costs arising from our business that could significantly affect our profits, such as financial expenses, taxes, depreciation, capital expenditures and other related charges. All references to “U.S. dollar,” “U.S. dollars” and the “US$” symbol presented herein are to the legal currency of the United States herein. All references to “real,” “reais” and the “R$” symbol are to the legal currency of Brazil. Certain numbers included in this offering memorandum have been subject to rounding adjustments. Accordingly, some of the total amounts in the tables herein may not represent an exact sum of the figures that precede them. viii
  • 10. Presentation of financial and other information Market information We state several estimates herein, including market estimates, past and future details, sales in our sector, our competitive position and our market share in the retail apparel sector in Brazil. We make such statements based on information obtained through sources that we consider reliable, such as the Central Bank of Brazil (Banco Central do Brasil), or Central Bank, the Brazilian Institute of Geography and Statistics (Instituto Brasileiro de Geografia e Estatística), or IBGE, the Getulio Vargas Foundation (Fundação Getúlio Vargas), or FGV, and trade associations (such as the Brazilian Textile Industry Association (Associação Brasileira da Indústria Têxtil), or ABIT, the Brazilian Association of Apparel Companies (Associação Brasileira de Empresas de Vestuário), or ABRAVEST, and the Brazilian Shopping Malls Association (Associação Brasileira de Shopping Centers), or ABRASCE), the International Textile Manufacturers Federation, or ITMF, among others. Unless otherwise stated, all macroeconomic information was obtained through the Central Bank, IBGE or FGV. We have no reason to believe that such information is inaccurate in any material aspect, and accordingly we have not independently verified such information. Additional information In this offering memorandum, references to “Cia. Hering,” “Hering,” “Group,” the “Company,” “we,” “us” and “our” mean Cia. Hering and its consolidated subsidiaries, except where the context requires otherwise. When used in this offering memorandum, the term “selling shareholder” refers to Socinvest Finance S.A. References to “former controlling shareholders” are to Investimentos e Participações Inpasa S.A., IPE Investimentos, Administradora Blumenauense, Amaral Investimentos, Ivo Hering, Carlos Tavares D’Amaral, Hans Prayon, Marcio Tavares D’Amaral, Jean Prayon, Fabio Hering, Isolde Hering Dandrea, Raul de Aguiar Hering and Dietz Ernst Fritz Linnenkamp. We do not have a controlling shareholder or controlling group holding a majority of our common shares as of the date of this offering memorandum. The term “Brazil” refers to the Federative Republic of Brazil. The phrase “Brazilian government” refers to the federal government of the Federative Republic of Brazil. References to the “Synovate survey” are to a quantitative research study prepared by Synovate Brasil Ltda., a multinational market research firm, at our request, in order to determine the market share and consumers’ opinions of our brands. References to the “Target survey” are to a database, prepared and updated annually, at our request, by Target Marketing S/C Ltda., named “Brasil em Foco—IPC Target” (Brasil in Focus—IPC Target), based on demographic and economic data provided by IBGE and other government sources. References to (i) “upper income class” or “upper income consumers,” (ii) “upper-middle income class” or “upper-middle income consumers,” (iii) “middle income class” or “middle income consumers,” and (iv) “lower- middle income class” or “lower-middle income consumers” are to, respectively, economic classes in Brazil classified as “Class A,” “Class B1,” “Class B2,” and “Class C” in accordance with the Brazilian Economic Classification Criteria of the Brazilian Association of Research Companies (ABEP). The classification of a particular class by ABEP is based on a rating methodology that measures a person’s educational level and the number and types of home appliances that such person owns at home. According to ABEP data, the monthly average family income (i) in Class A, represented by Class A1 and Class A2, is approximately R$7,793 and R$4,468, respectively; (ii) in Class B, represented by Class B1 and Class B2, is approximately R$2,804 and R$1,169, respectively; and (iii) in Class C is R$927. ix
  • 11. Summary This summary highlights information about our business, financial and operating data, activities, strengths and strategies. This summary does not contain all information that investors should consider before making an investiment decision. Before investing in our common shares, you should carefully read this entire offering memorandum, including the information contained in the sections entitled “Presentation of financial and other information,” “Risk factors” and “Management’s discussion and analysis of financial condition and results of operations,” as well as our financial statements and related notes included elsewhere in this offering memorandum. OVERVIEW We are one of the largest retail apparel designers and manufacturers in Brazil, in terms of consolidated net sales in 2006, according to the Target survey. We have been operating in the retail industry for 127 years and currently develop apparel collections under three proprietary brands: “Hering,” “PUC” and “dzarm.” As of March 31, 2007, we oversaw a chain of 151 Hering and 39 PUC stores, located throughout Brazil’s main markets, as well as 17 Hering and four PUC stores outside Brazil. Our brands The “Hering” brand is our primary and most profitable brand, accounting for 59.5% of our gross sales in 2006. According to the Synovate survey, the “Hering” brand is recognized by 87.6% of Brazilian consumers, and is commonly used to express the word “T-shirt” in Brazil. The “Hering” brand is also associated with casualwear, valued for the quality of its products and highly accepted among all income levels and age groups, especially those over 20 years of age. Our products are designed internally and offered to the market in six annual collections following worldwide fast fashion trends. Our “PUC” brand is recognized as a premium brand of childrens’s apparel for special occasions and is the fourth largest brand in the upper income class, in terms of gross sales, according to the Synovate survey. The “dzarm.” brand, meanwhile, is a jeanswear brand targeted at the teen market, especially young women. Our retail structure Our retail structure includes two complementary sales channels: (i) Hering and PUC stores, comprised of owned and franchised stores, and (ii) multibrand retail stores. Hering stores accounted for 46.3% of the revenues arising from our “Hering” brand in 2006. Hering stores are present in 20 Brazilian states through a chain of 151 owned and franchised stores (totaling 19,617 square meters), of which 78 are located in the state of São Paulo (which represented one third of Brazil’s gross domestic product, or GDP, in 2006). PUC stores accounted for 37.8% of the revenues arising from our “PUC” brand in 2006. PUC stores are present in 16 Brazilian states, through 39 owned and franchised stores (totaling 1,809 square meters), 21 of which are located in the state of São Paulo. Our store chains rely on different store formats (shopping malls and street stores) and sizes, which are established in accordance with local market conditions. We have developed our chains of stores mainly through the franchise model (operated by rigorously selected franchisees), with stores that can be replicated quickly, cost efficiently and close to our target consumers. We are able to provide uniformity and consistency of the consumer’s shopping experience in all Hering and PUC stores through our centralized control of product assortment, prices, architectural design, window displays, product disposition, advertising material, packaging and banners, among other features, and the adaptation of these features to local market conditions. We maintain a frequent dialogue with franchisees through our franchise board, which is comprised of three members appointed by our Company and seven members appointed by our 1
  • 12. franchisees, and other informal means, which enables us to exchange experiences and improve the decision- making process related to the operation of the stores. Of the total number of Hering and PUC stores, we own nine Hering stores and one PUC store, which are typically model stores that are larger than the average store and the operations of which we conduct ourselves given their importance to our brands. In addition to Hering and PUC stores, our products are present in approximately 8,800 points of sale, through multibrand retail stores, thereby increasing our distribution network throughout Brazil. Multibrand retail stores represent 53.7% of the revenues arising from our “Hering” brand, 62.2% of the revenues arising from our “PUC” brand and 100% of the revenues arising from our “dzarm.” brand. These points of sale are serviced by a team of 196 sales representatives. Supply model Our make-or-buy supply model combines our own production, in which lesser value-added steps of the production process may be outsourced, with the purchase of finished products from domestic and international suppliers. This model provides us with flexibility to adapt to market demand at a relatively low cost, while maintaining control over quality standards. Our production activities are primarily concentrated in Blumenau, in the state of Santa Catarina, where the knitting, dyeing, cutting, and finishing processes are carried out, including embroidery, printing, washing and packaging. We also maintain operations in other municipalities in the state of Santa Catarina and in the states of Rio Grande do Norte and Goiás. We have three strategically located distribution centers in the states of Santa Catarina, Goiás and Rio Grande do Norte. We constantly invest in information technology to obtain and monitor information concerning sales and inventory levels in Hering and PUC stores. We use this information together with our production, supply, distribution and logistics flexibility to design, develop and distribute six annual collections, while being able to minimize the shortage of products in stores and control costs related to inventory and overstock. Exports We are also one of the leading apparel exporters in Brazil, serving the United States, our main foreign consumer market, and several Latin American and European countries. We export apparel under our own brands and under third party private labels, through which we have the opportunity to exchange technical and administrative expertise, allowing us to constantly improve our products in accordance with international standards. 2
  • 13. Financial information In recent years, we have sought to improve our capital structure, focusing on increasing profitability by repositioning the “Hering” brand and focusing on fashionable products with higher value-added return. We also discontinued certain less profitable brands and sales channels and decreased our level of indebtedness, in lieu of growth. The following table sets forth our net sales, Adjusted EBITDA and net debt during the past three years and in the three-month periods ending March 31, 2006 and 2007: Year ended December 31, Three-month period ended March 31, 2004 2005 2006 2006 2007 2007 (in millions of R$, unless noted otherwise) (in millions of US$, unless noted otherwise)(5) Net sales . . . . . . . . . . . . . . . . . . . . . . 334.2 320.3 329.9 73.4 77.7 37.9 Hering Brand . . . . . . . . . . . . . . . . . . 178.6 172.5 189.0 43.2 46.7 22.8 Other brands . . . . . . . . . . . . . . . . . . . 77.6 74.5 74.9 17.0 18.8 9.2 Exports . . . . . . . . . . . . . . . . . . . . . . . 78.0 73.2 66.0 13.2 12.2 6.0 Adjusted EBITDA(1) . . . . . . . . . . . . 34.3 43.9 52.1 8.8 10.5 5.1 Adjusted EBITDA Margin(2) . . . . . . 10.3% 13.7% 15.8% 11.9% 13.4% 13.4% Net Debt(3) . . . . . . . . . . . . . . . . . . . . 344.9 201.3 184.6 184.0 184.3 89.9 Net Debt/Adjusted EBITDA(4) . . . . . 10.1 4.6 3.5 4.5 3.4 3.4 (1) The inclusion of Adjusted EBITDA information is intended to present a measure of our economic and operating performance and is determined in accordance with criteria established by the Company. Our Adjusted EBITDA means net income before interest, income tax and social contribution, depreciation and amortization, non-operating results and income from reversal of assignment of tax credits and expenses, and excludes non-operating results, which we believe are not part of the Company’s business cycle, and income from the reversal of the assignment of tax credits and expenses from the reversal of a credit related to industrialized product taxes we paid in connection with exported goods (IPI Credit), as we view these results are non-recurring income and expenses, because they have not occurred in the past two years and we expect that they will not occur within the next two years. Adjusted EBITDA is not a measure of financial performance in accordance with Brazilian GAAP and should not be considered individually, or as an alternative to net income as an indicator of operating performance, or as an alternative to operating cash flow, nor should it be considered as an indicator of liquidity. Adjusted EBITDA is not affected by debt restructuring processes, interest rate fluctuations, changes in tax rates or depreciation and amortization levels. Accordingly, we believe that Adjusted EBITDA is an important tool to compare our operating performance, over time, as well as to assist us in certain administrative decisions. We believe that Adjusted EBITDA provides a better understanding of our financial performance as well as our capacity to satisfy our liabilities and obtain funds for our capital expenditures and working capital. Adjusted EBITDA, however, presents limitations that prevent it from being used as an indicator of our profitability, as it does not consider certain costs arising from our business that could significantly affect our profits, such as financial expenses, taxes, depreciation, capital expenditures and other related charges. See “Summary financial and other information—Reconciliation of net income (loss) and Adjusted EBITDA.” (2) Adjusted EBITDA margin is Adjusted EBITDA divided by net income. (3) Net debt is calculated as the difference between the balance of short and long term loans and financings and cash and cash equivalents. (4) We consider Adjusted EBITDA for the past 12 months to calculate Net Debt /Adjusted EBITDA for the three-month periods ended March 31, 2006 and 2007. (5) Using the exchange rate in effect on March 31, 2007 of R$2.0504 to US$1.00. 3
  • 14. OUR COMPETITIVE STRENGTHS We believe our principal strengths include the following: ➢ Strong Brand Names. “Hering” is one of the most well-known apparel brand names in Brazil, recognized by 93.9% of upper and upper-middle income class respondents and by 85% of middle and lower-middle income class respondents in the Synovate survey. The “Hering” brand is associated with casualwear and T-shirts in Brazil, setting itself apart from its competitors as a result of the quality of its products, according to the Synovate survey. Our quality, along with the brand’s recognition and tradition, places the “Hering” brand in a privileged position of acceptance across a wide variety of product categories and age ranges, in particular among consumers over 20 years of age, and by upper, upper-middle, middle and lower-middle income consumers. “PUC” and “dzarm.,” on the other hand, are niche market brands, with “PUC” being a leading brand in children’s wear for upper income consumers and “dzarm.” associated with young and contemporary apparel products. ➢ Distinguished Shopping Experience at Hering and PUC stores. The distinguished attributes of our brands are reinforced by the shopping experience offered at our Hering and PUC stores. The shopping experience at Hering stores is a distinguishing feature that consumers value in relation to department stores, as we combine assisted sales with self-service sales. According to the Synovate survey, loyalty to the “Hering” brand among consumers at Hering stores is 63.3% greater than of consumers who shop at multibrand retail stores. ➢ Widespread Retail Structure. Our retail structure comprises 190 Hering and PUC stores and approximately 8,800 multibrand retail stores, providing us with a widespread presence throughout Brazil. By franchising Hering and PUC stores with different formats and sizes, we benefit from greater store density as compared to the traditional department store model, whether in shopping malls, street stores or commercial centers. In addition to our chain of owned and franchised stores, multibrand retail stores allow us to be present in cities where potential demand may not justify the investment of opening a Hering or PUC store. ➢ Development of Collections and Fast Supply Chain Model (Fast Fashion). Our product development team and supply chain is prepared to offer six collections throughout the year to our chain of stores and multibrand retail stores, delivered in two to three-week cycles, ensuring availability of new products at our stores and encouraging consumers to visit our stores more often. We are able to achieve this result in part because we design our collections in-house, thereby reducing the product development cycle. Additionally, we use the make-or-buy hybrid supply model whereby we either manufacture products internally or purchase them from local or foreign suppliers, based upon market conditions and the most efficient and profitable alternative for us. We believe we are one of the only Brazilian apparel chains capable of implementing this business model, which has been increasingly adopted in more devoloped markets, such as Europe. ➢ Growth Potential. Current macroeconomic conditions in Brazil are favorable for the retail apparel industry. These conditions include growing consumer credit availability, increase in per capita income, continuous decrease of interest rates and retail sector consolidation. We believe that within this macroeconomic framework we will have the opportunity to increase our market share, given the high rate of market fragmentation, in which the top five retailers in the apparel industry have a combined market share of approximately 32.4%. OUR GROWTH STRATEGY Our growth strategy for the forthcoming years focuses on the strength of the “Hering” brand, which has been the major driving force for our growth, as well as our retail structure, seeking to increase our market share in Brazil to the same level as our market share in the state of São Paulo, as described below. The principal elements of our strategy are summarized below: ➢ Repositioning the “Hering” brand as affordable fashion. Our “Hering” brand has strong growth potential given that its penetration among potential consumers is relatively low. Even in São Paulo, where we have a 4
  • 15. stronger presence, the Synovate survey showed that the brand’s penetration is no greater than 21.7% in the upper income class, 24.4% in the upper-middle income class, 15.6% in the middle income class and 4% in the lower-middle income class. The greatest barrier to increase the brand’s penetration, especially among upper-middle, middle and lower-middle income consumers, is the brand’s association with higher priced products by these consumers. According to the Synovate survey, 20.9% of upper income class and 30% of upper-middle, middle and lower-middle income consumers who know the brand and do not purchase its products stated they do so because of price. In order to increase our sales to these consumers, we intend to reposition the “Hering” brand as affordable fashion, a segment that today in the Brazilian market is occupied only by department stores, from which we distinguish ourselves due to the shopping experience at our stores. We intend to increase our offer of affordable products and increase investment in marketing and publicity in order to increase the brand’s visibility. We believe this strategy will result in an increase in the ratio of sales per square meter of all Hering stores, which is currently around R$11,000 per year, and recover our share of wallet among the clients of multibrand retail stores (our average revenue per client in multibrand retail stores was 13.7% greater in 2001 than in 2006 in real terms). ➢ Expand credit availability at Hering stores. We intend to expand our credit card (“Cartão Hering,” or the Hering Card) operations based on a revenue sharing (and, potentially, risk sharing) commercial agreement to be entered into with a financial institution, in order to allow users to buy our products under more favorable payment terms. We intend to focus our strategy on a private label card with characteristics similar to those of other cards in the retail market (such as management fees, interest rates, types of purchase and financing options), combined with a co-branded card and additional products, such as personal credit lines and insurance. ➢ Expand and strengthen Hering stores. A detailed mapping of the shopping malls, commercial centers and residential neighborhoods in 135 Brazilian cities showed that there is an opportunity to, at least, double the number of Hering stores. Our market share is greater in cities where Hering stores are physically located. Taking into account the upper, upper-middle, middle and lower-middle income classes, we believe our national market share is approximately 1.6% (considering net sales plus franchise and multibrand retail store mark-ups), and based on the Target survey, we believe our market share is approximately 3.6% in the city of São Paulo, where our presence is stronger. Outside the city of São Paulo, in cities where Hering stores are located, we estimate our market share is approximately 1.5%, while in cities where Hering stores are not located, our estimated market share is approximately 1.2%. We will focus our growth in mid-sized and large cities, in both shopping malls and street, adopting the most appropriate store format for the local market. Relatively larger stores can be established in shopping malls, especially those that have a high frequency of upper, upper-middle and middle income consumers. We believe shopping mall stores could be as large as up to 170 square meters on average, while the current average is 136 square meters. Commercial centers are able to sustain mid-sized stores (approximately 115 square meters), while smaller stores (100 square meters) are suitable for upper, upper-middle and middle income residential neighborhoods. ➢ Increase number of owned stores. Additionally, we intend to increase the number of stores we own, generally larger model stores, of approximately 200 to 240 square meters, which demand a greater initial investment, currently around R$2,000 per square meter, including location costs. We expect to focus on larger cities where our presence is not as significant, such as Rio de Janeiro, or shopping malls with a high frequency of upper, upper-middle and middle income consumers. Our goal is to take advantage of the incremental EBITDA generated by stores we own, manage high visibility outlets and strengthen our brand. We owned ten stores as of December 2006 and expect to significantly increase this number in 2007 and 2008. ➢ Increase sales at multibrand retail stores. Repositioning the “Hering” brand as affordable fashion, in addition to allowing us to reestablish our historical share of wallet at our current 6,500 “Hering” brand points of sale (out of a total of approximately 8,800 points of sale for all of our brands) will allow us to capture new clients at multibrand retail stores. As a result, we intend to increase the number of our “Hering” brand sales representatives from 119 (out of a total of 196 for all our brands) to more than 200 representatives. 5
  • 16. The offering Issuer . . . . . . . . . . . . . . . . . . . . . . . . . . . . Cia. Hering. Selling shareholder . . . . . . . . . . . . . . . . . Socinvest Finance S.A. See “Principal shareholders and selling shareholder” regarding the legal limitations on disclosure of the identity of the investors of the selling shareholder. Upon completion of the offering, the selling shareholder will hold directly approximately 3.38% of our capital stock and, indirectly (through Target Investment Fund Ltd. SAC, or the Target Fund, one of our principal shareholders) approximately 10.43% of our capital stock (assuming the exercise in full of the over-allotment option). Joint bookrunners . . . . . . . . . . . . . . . . . . Itaú Securites Inc. and Santander Investment Securities, Inc. Securities offered . . . . . . . . . . . . . . . . . . . The offering consists of a primary offering of 20,833,000 common shares and a secondary offering of 7,500,000 common shares to: ➢ the public in Brazil pursuant to an offering registered in Brazil; ➢ qualified institutional buyers in the United States as defined under Rule 144A under the Securities Act, pursuant to exemptions from the Securities Act and the rules issued thereunder; and ➢ institutions and other investors outside the United States and Brazil that are not U.S. persons in accordance with Regulation S under the Securities Act. Over-allotment option . . . . . . . . . . . . . . . We have granted to Banco Itaú BBA S.A. an option, excercisable upon consultation with Banco Santander Banespa S.A., to place up to 4,249,950 additional common shares at the offering price, representing up to 15% of the common shares initially offered hereby, to cover over-allotments, if any, for a period of up to 30 days following the date of publication of the announcement in Brazil of the commencement of the offering. Offering price . . . . . . . . . . . . . . . . . . . . . R$11.00 per common share. Capital stock . . . . . . . . . . . . . . . . . . . . . . Our capital stock immediately prior to this offering consists of 33,094,681 common shares. Immediately following completion of this offering, our capital stock will consist of 53,927,681 common shares (assuming no exercise of the over-allotment option). See “Description of capital stock”. Use of proceeds . . . . . . . . . . . . . . . . . . . . We estimate that the proceeds, before expenses, from the primary offering will be approximately R$218.7 million, after deducting estimated underwriting commissions and assuming no exercise of the over-allotment option. 6
  • 17. We intend to use the net proceeds from the primary offering for: (i) working capital and other corporate purposes, (ii) investments in owned Hering and PUC stores, (iii) investments in information, textile and industrial technologies and (iv) the repayment of debt and improvement of our capital structure. See “Use of proceeds.” We will not receive any proceeds from the sale of common shares by the selling shareholder in the secondary offering. Lock-up agreements . . . . . . . . . . . . . . . . We, the selling shareholder, the former controlling shareholders and our directors and officers have agreed, subject to certain exceptions, not to issue, sell, offer or agree to sell, grant any option to sell or otherwise dispose of, directly or indirectly, any shares or securities convertible into or exchangeable or exercisable for shares or warrants or other rights to purchase shares during the 180-day period following the date of this offering memorandum without prior written consent of the underwriters. Transfer restrictions . . . . . . . . . . . . . . . . Our common shares have not been registered under the Securities Act and are subject to U.S. restrictions on transfer and resale, as described in “Transfer restrictions.” Transfers of our shares, including by or between residents of jurisdictions outside Brazil, may be effected only in Brazil. Voting rights . . . . . . . . . . . . . . . . . . . . . . Each common share entitles its holder to one vote at any annual or special shareholders’ meeting. See “Description of capital stock— Rights of common shares.” Tag-along rights . . . . . . . . . . . . . . . . . . . Following the listing of our common shares on the Novo Mercado segment of the BOVESPA, holders of our common shares will be entitled to be included in a public tender offer in case a controlling shareholder sells its controlling stake in us, under the same terms as those being offered to such controlling shareholder. See “Description of capital stock.” Dividends . . . . . . . . . . . . . . . . . . . . . . . . The Brazilian Corporate Law and our by-laws require us to distribute at least 25% of our annual adjusted net income, as calculated under Brazilian GAAP and adjusted under the Brazilian Corporate Law (which differs significantly from net income as calculated under U.S. GAAP and IFRS). The payment of dividends may be suspended by our board of directors, however, if it concludes that such distribution would not be advisable at such time taking into account our financial condition or prospects, macroeconomic conditions, regulatory changes, our growth strategy and contractual restrictions, among other factors deemed relevant by our board of directors or shareholders. We have not declared dividends in the preceding five fiscal years. Dividends may be made in the form of interest attributed to shareholders’ equity. See “Dividends and dividend policy.” 7
  • 18. Trading, settlement and clearance . . . . . . Payment for our common shares will be required to be made to us in reais in Brazil through the facility of the CBLC and we expect to deliver our shares in Brazil through the facility of the CBLC on or about July 25, 2007. Trades in our common shares on the BOVESPA will settle through the CBLC. Listing . . . . . . . . . . . . . . . . . . . . . . . . . . . Our common shares are listed with the Novo Mercado segment of BOVESPA, under the symbol “HGTX3.” Risk factors . . . . . . . . . . . . . . . . . . . . . . . An investment in our common shares involves risks. See “Risk factors” beginning on page 15 and the other information included in this offering memorandum for a discussion of factors you should consider before deciding to invest in our common shares. Taxation . . . . . . . . . . . . . . . . . . . . . . . . . . Dividend distributions with respect to our common shares are not currently subject to withholding of Brazilian income tax. However, payments of interest attributable to shareholders’ equity (in lieu of dividends) are subject to withholding of Brazilian income tax. For certain Brazilian and U.S. tax consequences with respect to U.S. holders of our common shares, see “Taxation.” 8
  • 19. Summary financial and other information The tables below present summary financial and other information for the periods indicated therein. The financial information below should be read and analyzed in conjunction with the sections “Selected financial data and other information,” “Management’s discussion and analysis of financial condition and results of operations” and “Presentation of financial and other information.” The summary financial information relating to the balance sheet and income statement as of and for the years ended December 31, 2004, 2005 and 2006, is derived from our audited financial statements, prepared in accordance with accounting practices adopted in Brazil, audited by our independent accountants in accordance with audit standards applicable in Brazil, as stated in their independent auditor report, which contains qualifications relating to (i) the realization of deferred income and social contribution taxes for the years presented amounting to R$25.0 million, (ii) the recognition of R$35.0 million related to tax credits offset against taxable income recorded as current assets, (iii) R$2.7 million, related to deferred currency exchange losses and (iv) unrecorded provisions for contingencies related to tax credits which were inappropriately offset against taxable income amounting to R$16.0 million in which the Company received an administrative assessment during the year ended December 31, 2004, and explanatory paragraphs relating to (i) the realization of income and social contribution tax credits amounting to R$41.0 million at December 31, 2006 and (ii) the implementation of financial and operational restructuring plans of the Company as approved by our board of directors. This report is included elsewhere in this offering memorandum. The selected financial information relating to the balance sheet and income statement as of and for the three-month period ended March 31, 2006, is derived from our unaudited financial statements, prepared in accordance with Brazilian GAAP, which were subject to special review performed by our independent accountantsin accordance with the procedures established by IBRACON, in conjunction with the CFC, for a special review of interim financial information, as stated in their special review report, which contains qualifications relating to the realization of deferred income and social contribution taxes for the years presented amounting to R$25.0 million and explanatory paragraphs relating to (i) the realization of income and social contribution tax credits amounting to R$41.0 million and (ii) the implementation of the company’s financial restructuring plans of the Company. The selected financial information relating to the balance sheet and income statement as of and for the three-month period ended March 31, 2007, is derived from our unaudited financial statements, prepared in accordance with Brazilian GAAP, which were subject to special review performed by our independent accountants in accordance with the procedures established by IBRACON, in conjunction with the CFC, for a special review of interim financial information, as stated in the special review report included elsewhere in this offering memorandum, contains an emphasis paragraph which states that the recoverability of deferred income tax assets in the amount of R$49.6 million is subject to the achievement of future taxable profits. Brazilian GAAP differs in certain significant respects from U.S. GAAP from IFRS. The financial statements of the Company and the consolidated financial statements of the Company and subsidiaries contained in this offering memorandum differ from those that would be prepared based upon U.S. GAAP or IFRS. We have made no attempt to identify or quantify the impact of those differences. No reconciliation to U.S. GAAP or IFRS of any of the financial statements presented in this offering memorandum has been prepared for the purpose of this offering memorandum or for any other purpose. There can be no assurance that reconciliations would not identify material quantitative differences as well as disclosures and presentation differences between our consolidated financial statements as prepared in accordance with Brazilian GAAP and the financial statements as prepared under U.S. GAAP or IFRS. Solely for the convenience of the reader, real amounts as of and for the three-month period ended March 31, 2007 and as of and for the year ended December 31, 2006 have been translated into U.S. dollars at the 9
  • 20. commercial selling rate at closing for the purchase of U.S. dollars, as reported by the Central Bank, on March 31, 2007 of R$2.0504 to US$1.00. The U.S. dollar equivalent information should not be construed to imply that the real amount represented, or could have been or could be converted into, U.S. dollars at this rate or at any other rate. For additional information regarding qualifications and explanatory paragraphs in our financial statements, see “Presentation of financial and other information.” Year ended December 31, Three-month period ended March 31, Statements of operations 2004 2005 2006 2006 2007 2007 (in millions of R$, unless otherwise noted) (in millions of US$, unless otherwise noted)(1) Gross sales . . . . . . . . . . . . . . . . . . . . . . . 391.3 376.6 389.6 86.3 92.7 45.1 Domestic market . . . . . . . . . . . . . . . . . . . 313.3 303.4 323.6 73.1 80.5 39.2 Foreign market . . . . . . . . . . . . . . . . . . . . 78.0 73.2 66.0 13.2 12.1 5.9 Sales deductions . . . . . . . . . . . . . . . . . . . (57.1) (56.3) (59.6) (12.9) (14.9) (7.2) Net Sales . . . . . . . . . . . . . . . . . . . . . . . . . 334.2 320.3 330.0 73.4 77.7 37.9 Cost of sales . . . . . . . . . . . . . . . . . . . . . . . (215.3) (201.2) (198.6) (46.0) (47.9) (23.3) Gross profit . . . . . . . . . . . . . . . . . . . . . . 118.9 119.1 131.4 27.4 29.8 14.5 Operating income (expense) Selling expenses . . . . . . . . . . . . . . . . . . . (69.3) (64.7) (70.0) (15.9) (17.2) (8.3) General and administrative expenses . . . (14.3) (13.7) (15.6) (3.9) (3.9) (1.9) Management compensation . . . . . . . . . . . (1.8) (1.9) (2.0) (0.5) (0.5) (0.2) Depreciation and amortization . . . . . . . . (9.7) (8.8) (9.1) (2.2) (2.0) (0.9) Depreciation and amortization allocated to cost . . . . . . . . . . . . . . . . . . . . . . . . . 7.7 6.7 7.2 1.7 1.6 0.7 Profit sharing . . . . . . . . . . . . . . . . . . . . . . (1.3) (1.1) (1.0) — — — Other operating income (expense), net . . . . . . . . . . . . . . . . . . . . . . . . . . . . (5.6) (22.0) 2.1 (0.1) 0.6 0.2 Income from operations before financial income (expense) and equity in subsidiaries . . . . . . . . . . . . . 24.6 13.6 43.0 6.5 8.4 4.0 Financial result . . . . . . . . . . . . . . . . . . . . (39.7) 42.9 (23.3) 1.1 (2.2) (1.0) Amortization of goodwill . . . . . . . . . . . . (0.9) (0.9) (0.7) (0.2) — — Income (loss) from operations (16.0) 55.6 19.0 7.4 6.2 3.0 Non-operating income (expense) . . . . . . (3.8) (25.7) (3.3) (0.5) — — Income (loss) before taxes on income and minority interest . . . . . . . . . . . . . (19.8) 29.9 15.7 6.9 6.2 3.0 Provision and deferred income tax and social contribution . . . . . . . . . . . . . . . . 2.1 1.0 1.5 0.4 8.5 4.1 Income tax and social contribution . . . . . — — — — (0.6) (0.2) Net income (loss) for the period . . . . . . (17.7) 30.9 17.2 7.3 14.1 6.8 (1) Using the exchange rate in effect on March 31, 2007 of R$2.0504 to US$1.00. 10
  • 21. Year ended December 31, Three–month period ended March 31, Consolidated balance sheet 2004 2005 2006 2006 2007 2007 (in millions of R$, unless noted otherwise) (in millions of US$, unless noted otherwise)(1) CURRENT ASSETS Cash and cash equivalents . . . . . . . . . . . . . . . . . . . . . . . . . . . . . . 7.7 8.9 5.2 3.9 5.9 2.9 Trade accounts receivable . . . . . . . . . . . . . . . . . . . . . . . . . . . . . . 92.4 93.6 86.1 81.8 96.2 46.9 Inventories . . . . . . . . . . . . . . . . . . . . . . . . . . . . . . . . . . . . . . . . . . 40.9 33.6 41.6 36.7 46.8 22.8 Recoverable taxes . . . . . . . . . . . . . . . . . . . . . . . . . . . . . . . . . . . . 31.9 27.5 22.9 26.5 20.6 10.0 Prepaid expenses . . . . . . . . . . . . . . . . . . . . . . . . . . . . . . . . . . . . . 2.1 1.4 1.4 1.2 1.7 0.8 Other receivables . . . . . . . . . . . . . . . . . . . . . . . . . . . . . . . . . . . . . 3.9 4.5 5.1 4.2 3.7 1.8 Total current assets . . . . . . . . . . . . . . . . . . . . . . . . . . . . . . . . . . 178.9 169.5 162.3 154.3 174.9 85.3 NONCURRENT ASSETS Non current assets Related parties . . . . . . . . . . . . . . . . . . . . . . . . . . . . . . . . . . . 0.8 0.7 0.8 0.7 0.8 0.3 Notes and accounts receivable . . . . . . . . . . . . . . . . . . . . . . . 3.3 2.7 4.4 6.1 4.9 2.3 Properties for sale . . . . . . . . . . . . . . . . . . . . . . . . . . . . . . . . 31.8 — — — — — Prepaid expenses . . . . . . . . . . . . . . . . . . . . . . . . . . . . . . . . . 6.5 4.0 2.8 3.7 2.4 1.2 Recoverable taxes . . . . . . . . . . . . . . . . . . . . . . . . . . . . . . . . 1.9 9.8 2.6 9.8 3.9 1.9 Compulsory loans . . . . . . . . . . . . . . . . . . . . . . . . . . . . . . . . 12.1 12.1 24.5 12.1 24.5 11.9 Deferred income and social contribution tax . . . . . . . . . . . . 66.5 66.5 66.5 66.5 49.6 24.2 Investments . . . . . . . . . . . . . . . . . . . . . . . . . . . . . . . . . . . . . . . . . Subsidiaries . . . . . . . . . . . . . . . . . . . . . . . . . . . . . . . . . . . . . 1.7 0.7 — 0.4 — — Other investments . . . . . . . . . . . . . . . . . . . . . . . . . . . . . . . . 2.8 2.8 1.0 2.8 1.0 0.5 Property, plant and equipment . . . . . . . . . . . . . . . . . . . . . . . . . . . 216.9 212.4 212.0 209.6 212.5 103.6 Intangible asset . . . . . . . . . . . . . . . . . . . . . . . . . . . . . . . . . . . . . . 4.9 4.1 4.8 4.9 4.9 2.3 Deferred charges . . . . . . . . . . . . . . . . . . . . . . . . . . . . . . . . . . . . . 0.1 — 0.1 — 0.1 0.1 Total non current assets . . . . . . . . . . . . . . . . . . . . . . . . . . . . . . 349.3 315.8 319.5 316.6 307.6 150.0 TOTAL ASSETS . . . . . . . . . . . . . . . . . . . . . . . . . . . . . . . . . . . . 528.2 485.3 481.8 470.9 482.5 235.3 LIABILITIES AND SHAREHOLDERS’ EQUITY CURRENT LIABILITIES Loans and financing . . . . . . . . . . . . . . . . . . . . . . . . . . . . . . . . . . . 78.2 56.7 44.6 49.3 69.0 33.6 Trade accounts payable . . . . . . . . . . . . . . . . . . . . . . . . . . . . . . . . 34.4 35.8 25.6 35.8 31.4 15.3 Payroll and related charges . . . . . . . . . . . . . . . . . . . . . . . . . . . . . 15.8 12.9 14.5 13.1 14.9 7.2 Taxes in installments . . . . . . . . . . . . . . . . . . . . . . . . . . . . . . . . . . 5.3 12.3 11.3 11.9 10.2 4.9 Taxes payable . . . . . . . . . . . . . . . . . . . . . . . . . . . . . . . . . . . . . . . 15.4 43.1 23.8 44.4 25.1 12.2 Provisions . . . . . . . . . . . . . . . . . . . . . . . . . . . . . . . . . . . . . . . . . . 5.3 4.1 4.9 4.2 5.3 2.5 Tax incentives . . . . . . . . . . . . . . . . . . . . . . . . . . . . . . . . . . . . . . . — — 1.1 — 1.1 0.5 Other payables . . . . . . . . . . . . . . . . . . . . . . . . . . . . . . . . . . . . . . . 6.5 5.4 1.1 3.0 2.6 1.3 Total current liabilities . . . . . . . . . . . . . . . . . . . . . . . . . . . . . . . 160.9 170.3 126.9 161.7 159.8 77.9 NONCURRENT LIABILITIES Loans and financing . . . . . . . . . . . . . . . . . . . . . . . . . . . . . . . . . . . 274.4 153.5 145.2 138.6 124.1 60.5 Provisions . . . . . . . . . . . . . . . . . . . . . . . . . . . . . . . . . . . . . . . . . . 30.4 23.8 21.0 25.8 20.4 9.9 Tax incentives . . . . . . . . . . . . . . . . . . . . . . . . . . . . . . . . . . . . . . . 17.1 19.3 23.1 19.3 24.1 11.7 Deferred taxes on revaluation . . . . . . . . . . . . . . . . . . . . . . . . . . . 19.9 18.8 16.2 18.3 15.9 7.7 Taxes in installments . . . . . . . . . . . . . . . . . . . . . . . . . . . . . . . . . . 14.2 15.4 42.5 13.6 41.4 20.1 Taxes payable . . . . . . . . . . . . . . . . . . . . . . . . . . . . . . . . . . . . . . . 7.0 46.9 48.0 49.0 48.8 23.8 Other payables . . . . . . . . . . . . . . . . . . . . . . . . . . . . . . . . . . . . . . . 3.2 5.3 5.2 5.2 5.3 2.6 Total non current liabilities . . . . . . . . . . . . . . . . . . . . . . . . . . . 366.2 283.0 301.2 269.8 280.0 136.5 MINORITY INTEREST . . . . . . . . . . . . . . . . . . . . . . . . . . . . . . — — — — — — SHAREHOLDERS’ EQUITY Capital . . . . . . . . . . . . . . . . . . . . . . . . . . . . . . . . . . . . . . . . . . . . . 146.0 146.0 146.0 146.0 146.0 71.2 Revaluation reserve . . . . . . . . . . . . . . . . . . . . . . . . . . . . . . . . . . . 54.1 51.9 53.4 51.1 53.0 25.8 Accumulated deficit . . . . . . . . . . . . . . . . . . . . . . . . . . . . . . . . . . . (199.0) (165.9) (145.7) (157.7) (156.3) 76.2 Total shareholders’ equity . . . . . . . . . . . . . . . . . . . . . . . . . . . . 1.1 32.0 53.7 39.4 42.7 20.8 TOTAL LIABILITIES AND SHAREHOLDERS’ EQUITY . . . . . . . . . . . . . . . . . . . . . . . . . . . . . . . . . . . . . . . . . 528.2 485.3 481.8 470.9 482.5 235.3 (1) Using the exchange rate in effect on March 31, 2007 of R$2.0504 to US$1.00. 11
  • 22. Other financial information Years ended December 31, Three-month period ended March 31, 2004 2005 2006 2006 2007 2007 (in millions of R$, unless noted otherwise) (in millions of US$, unless noted otherwise)(5) Net sales . . . . . . . . . . . . . . . . . . . . . . . . 334.2 320.3 330.0 73.4 77.7 37.9 Gross profit . . . . . . . . . . . . . . . . . . . . . 118.9 119.1 131.4 27.4 29.8 14.5 Adjusted EBITDA(1) . . . . . . . . . . . . . . . 34.3 43.9 52.1 8.8 10.5 5.1 Net income (loss) . . . . . . . . . . . . . . . . . (17.7) 30.9 17.2 7.3 14.1 6.9 Gross margin(2) . . . . . . . . . . . . . . . . . . . 35.6% 37.2% 39.8% 37.3% 38.4% 38.4% Adjusted EBITDA margin(3) . . . . . . . . 10.3% 13.7% 15.8% 11.9% 13.4% 13.4% Net margin(4) . . . . . . . . . . . . . . . . . . . . . (5.3)% 9.6% 5.2% 9.9% 18.1% 18.1% (1) The inclusion of Adjusted EBITDA information is intended to present a measure of our economic and operating performance and is determined in accordance with criteria established by the Company. Our Adjusted EBITDA means net income before interest, income tax and social contribution, depreciation and amortization, non-operating results and income from reversal of assignment of tax credits and expenses, and excludes non-operating results, which we believe are not part of the Company’s business cycle, and income from the reversal of the assignment of tax credits and expenses from the reversal a credit related to industrialized product taxes we paid in connection with exported goods (IPI Credit), as we view these results are non-recurring income and expenses, because they have not occurred in the past two years and we expect that they will not occur within the next two years. Adjusted EBITDA is not a measure of financial performance in accordance with Brazilian GAAP and should not be considered individually, or as an alternative to net income as an indicator of operating performance, or as an alternative to operating cash flow, nor should it be considered as an indicator of liquidity. Adjusted EBITDA is not affected by debt restructuring processes, interest rate fluctuations, changes in tax rates or depreciation and amortization levels. Accordingly, we believe that Adjusted EBITDA is an important tool to compare our operating performance, over time, as well as to assist us in certain administrative decisions. We believe that Adjusted EBITDA provides a better understanding of our financial performance as well as our capacity to satisfy our liabilities and obtain funds for our capital expenditures and working capital. Adjusted EBITDA, however, presents limitations that prevent it from being used as an indicator of our profitability, as it does not consider certain costs arising from our business that could significantly affect our profits, such as financial expenses, taxes, depreciation, capital expenditures and other related charges. See “Selected financial and other information.” (2) Gross Margin is gross profit divided by net income. (3) Adjusted EBITDA Margin is Adjusted EBITDA divided by net sales revenue. (4) Net margin is net income (loss) divided by net sales. (5) Using the exchange rate in effect on March 31, 2007 of R$2.0504 to US$1.00. 12
  • 23. Reconciliation of net income (loss) and Adjusted EBITDA Year ended December 31, Three-month period ended March 31, 2004 2005 2006 2006 2007 2007 (in millions of R$) (in millions of US$)(6) Net Income (loss) . . . . . . . . . . . . . . . . . . . . . (17.7) 31.0 17.2 7.3 14.1 6.9 (-) Depreciation and amortization . . . . . . . . 9.7 8.8 9.1 2.2 2.1 1.0 (-) Financial result . . . . . . . . . . . . . . . . . . . . 39.7 (42.9) 23.3 (1.1) 2.2 1.1 (-) Income tax and social contribution . . . . . (2.0) (1.0) (1.5) (0.5) (7.9) (3.8) (-) Non-operational result(1) . . . . . . . . . . . . . 4.7 26.6(2) 4.0 0.8 0.0 0.0 (-) Recovery of expenses . . . . . . . . . . . . . . . — (13.5)(3) — — — — (-) IPI Credit reversion . . . . . . . . . . . . . . . . . — 35.0(4) — — — — Adjusted EBITDA(5) . . . . . . . . . . . . . . . . . . 34.3 43.9 52.1 8.8 10.5 5.1 (1) Non-operational result is calculated as non-operational result plus amortization of goodwill. (2) Refers to the difference determined between the acquisition and sales prices of real property in Spain, on which a former industrial facility, disactivated in 1996, was located. This property had been classified as property, plant and equipment valued at its acquisition cost of R$28.1 million, but was sold in 2005 for R$2.3 million, resulting in a loss of R$25.7 million, depreciated until its realization. (3) Refers to the income resulting from the reversal of the assignment of tax credits carried out by third parties in 2003 and 2004, being reverted in the year ended December 31 2005 and recorded as other operating income (expense), in the amount of R$13.5 million, as described in explanatory note no. 20 of our financial statements for that year. (4) Resulting from the reversal of a credit related to industrialized product taxes we paid in connection with exported goods (IPI Credit), which took place in 2003, in view of changes in case law regarding this issue in the Superior Court of Justice (STJ). We reversed the aforementioned credit in the year ended December 31, 2005, reflecting this amount in the company’s results under other operating income (expense), as described in explanatory note no. 20 of our financial statements for that year, in a net amount of R$35.0 million. (5) The inclusion of Adjusted EBITDA information is intended to present a measure of our economic and operating performance and is determined in accordance with criteria established by the Company. Our Adjusted EBITDA means net income before interest, income tax and social contribution, depreciation and amortization, non-operating results and income from reversal of assignment of tax credits and expenses, and excludes non-operating results, which we believe are not part of the Company’s business cycle, and income from the reversal of the assignment of tax credits and expenses from the reversal of a credit related to industrialized product taxes we paid in connection with exported goods (IPI Credit), as we view these results are non-recurring income and expenses, because they have not occurred in the past two years and we expect that they will not occur within the next two years. Adjusted EBITDA is not a measure of financial performance in accordance with Brazilian GAAP and should not be considered individually, or as an alternative to net income as an indicator of operating performance, or as an alternative to operating cash flow, nor should it be considered as an indicator of liquidity. Adjusted EBITDA is not affected by debt restructuring processes, interest rate fluctuations, changes in tax rates or depreciation and amortization levels. Accordingly, we believe that Adjusted EBITDA is an important tool to compare our operating performance, over time, as well as to assist us in certain administrative decisions. We believe that Adjusted EBITDA provides a better understanding of our financial performance as well as our capacity to satisfy our liabilities and obtain funds for our capital expenditures and working capital. Adjusted EBITDA, however, presents limitations that prevent it from being used as an indicator of our profitability, as it does not consider certain costs arising from our business that could significantly affect our profits, such as financial expenses, taxes, depreciation, capital expenditures and other related charges. See “Selected financial and other information.” (6) Using the exchange rate in effect on March 31, 2007 of R$2.0504 to US$1.00. 13
  • 24. The following table shows our indebtedness, in terms of debt and net debt for the periods indicated in the table. As of December 31, Three–month period ended March 31, 2004 2005 2006 2006 2007 2007 (in millions of R$, unless noted otherwise) (in millions of US$, unless noted otherwise)(2) Debt (loans and financings) Current . . . . . . . . . . . . . . . . . . . . . . . . . . . . . . . . . 78.2 56.7 44.6 49.3 69.1 33.7 Noncurrent . . . . . . . . . . . . . . . . . . . . . . . . . . . . . . 274.4 153.5 145.2 138.6 124.1 60.5 Total . . . . . . . . . . . . . . . . . . . . . . . . . . . . . . . . . . . 352.6 210.2 189.8 187.9 193.2 94.2 Net Debt(1) Current . . . . . . . . . . . . . . . . . . . . . . . . . . . . . . . . . 70.5 47.8 39.4 45.4 63.2 30.8 Noncurrent . . . . . . . . . . . . . . . . . . . . . . . . . . . . . . 274.4 153.5 145.2 138.6 121.1 59.1 Total . . . . . . . . . . . . . . . . . . . . . . . . . . . . . . . . . . . 344.9 201.3 184.6 184.0 184.3 89.9 (1) Net debt is calculated as the difference between the balance of short and long term loans and financings and cash and cash equivalents. (2) Using the exchange rate in effect on March 31, 2007 of R$2.0504 to US$1.00. 14
  • 25. Risk factors An investment in our common shares involves a high degree of risk. You should carefully consider all of the information set forth in this offering memorandum and the risks described below before deciding whether to invest in our common shares. Additional risks not currently known to us or that we now consider immaterial could also adversely affect our operations and the value of your investment. If any of these risks actually occur, our business, financial condition or results of operations could be adversely affected. In that case, the market price for our common shares could decline and you could lose all or part of your investment in our common shares. RISKS RELATING TO BRAZIL The Brazilian government has exercised, and continues to exercise, significant influence over the Brazilian economy. This influence, as well as Brazilian political and economic conditions, could have a material adverse effect on us and on the market price of our common shares. The Brazilian government frequently intervenes in the Brazilian economy and occasionally makes significant changes in policy and regulations. The Brazilian government’s actions to control inflation and other policies and regulations have often resulted in increases in interest rates, changes in tax policies, price controls, currency devaluations, capital controls and limits on imports, among other measures. We may be materially adversely affected by changes in policies or regulations involving or affecting factors such as: ➢ exchange rate fluctuations; ➢ exchange controls and restrictions, such as those which were briefly imposed in 1989 and 1990; ➢ inflation; ➢ interest rates; ➢ tax policies; ➢ economic growth; ➢ liquidity of domestic financial and capital markets; and ➢ other political, social and economic measures that may be implemented or affect Brazil. Uncertainty over whether the Brazilian government will implement changes in policies or regulations affecting these or other factors may contribute to economic uncertainty in Brazil and to heightened volatility in the Brazilian securities market and securities issued by Brazilian issuers. These uncertainties may have a material adverse effect on us and may also adversely affect the market price of our common shares. In October 2006, presidential elections were held and President Luis Inácio Lula da Silva was re-elected. We cannot predict what policies will be maintained or adopted by the Brazilian government and whether these policies will negative affect the economy or us or the market price of our common shares. Developments and the perception of risk in other countries, specifically in emerging market countries, may affect the market price of Brazilian securities, including our common shares. The market value of securities of Brazilian companies is affected to varying degrees by economic and market conditions in other countries, including countries in Latin American and emerging market countries. Although economic conditions of these countries are significantly different from the economic conditions in Brazil, investors’ reactions to developments in these other countries may have an adverse effect on the market value of securities of Brazilian companies. Crises in other emerging market countries may reduce investor interest in 15
  • 26. Risk factors securities of Brazilian companies, including our common shares. This could adversely affect the market price of our common shares and make it more difficult for us to gain access to the capital markets and finance our operations in the future on acceptable terms or at all. The Brazilian government’s efforts to combat inflation may significantly influence economic uncertainty in Brazil and could harm us and the market value of our common shares. Brazil has in the past experienced extremely high rates of inflation. Inflation, and the Brazilian government’s efforts to combat inflation, have had significant negative effects on the Brazilian economy, contributing to economic uncertainty and heightened volatility in the Brazilian securities markets. The Brazilian government’s measures to control inflation have often included maintaining a tight monetary policy with high interest rates, thereby restricting the availability of credit and reducing economic growth. The annual inflation rate, as measured by the General Price Index—Internal Availability (Índice Geral de Preços Disponibilidade Interna), or IGP-DI, reached 2,708% in 1993. Although inflation rates have been substantially lower since 1994 than in previous periods, inflationary pressures may persist. Annual inflation rates at the end of 2001, 2002, 2003, 2004, 2005 and 2006 were 10.4%, 26.4%, 7.7%, 12.1%, 1.4% and 3.8%, respectively, as measured by the IGP-DI. Brazil may experience high levels of inflation in the future. Inflationary pressures may cause governmental interventions in the economy, including the introduction of governmental policies that may adversely affect our business and, consequently, the market price of our common shares. If investor confidence lags, the liquidity of the Brazilian economy and the price of our common shares may be affected. Future inflationary measures may also adversely affect consumption in the Brazilian retail market. As a result, our suppliers may be forced to increase the price of their products to compensate for inflation. We cannot predict whether we will be able to transfer any such increase in the cost of our products to our consumers in the future and whether this will adversely affect our operating results and, consequently, the market price of our common shares. High inflation rates could result in higher interest rates, thereby affecting our cost of funding, and could have a material adverse effect on the level of our debt in reais and may adversely affect our operating margins. Exchange rate instability may have a material adverse effect on us and on the market price of our common shares. The real has experienced frequent and substantial devaluations in relation to the U.S. dollar and other foreign currencies during the last decades. Throughout this period, the Brazilian government has implemented various economic plans and utilized a number of exchange rate policies, including sudden devaluations, periodic mini-devaluations during which the frequency of adjustments has ranged from daily to monthly, floating exchange rate systems, exchange controls and dual exchange rate markets. From time to time, there have been significant fluctuations in the exchange rate between the real and the U.S. dollar and other currencies. On March 31, 2007, the foreign exchange rate between the real and U.S. dollar was R$2.0504 to US$1.00, representing an appreciation of the real of approximately 4.9% compared to December 31, 2006. We cannot assure you that the foreign exchange rate between the real and U.S. dollar will remain the same. The devaluation of the real against the U.S. dollar and other foreign currencies could create additional inflationary pressures in Brazil and cause increases in interest rates, which could negatively affect consumption in the Brazilian retail market and the Brazilian economy as a whole and have a material adverse effect on us. It could also affect our ability to bear our costs and obligations in foreign currencies, which could adversely affect us and the market price of our common shares. 16
  • 27. Risk factors RISKS RELATING TO OUR INDUSTRY The retail industry is sensitive to decreases in consumer purchasing power and unfavorable economic cycles. Historically, the Brazilian retail industry has been susceptible to downturns in the Brazilian economy, which decrease consumers’ purchasing power. The success of our operations depends, among other things, on consumers’ purchasing power, which, in turn, depends on the levels of income and on overall business conditions, interest rates, inflation, credit availability to the consumer, taxation, consumer with respect to future economic conditions, unemployment levels and wages. A significant downturn in the Brazilian economy may adversely reduce consumers’ purchasing power and available income, which could adversely affect our sales, operating results and financial condition. The retail apparel market is highly competitive. The Brazilian and foreign retail apparel market is characterized by strong and increasing competition and we have several competitors in these markets. Moreover, we may face competition from new players entering the market, which could change our competitive outlook. In the event that we are not able to effectively compete in the Brazilian and foreign retail apparel market, our operating results may be adversely affected. Our sales and inventory levels are exposed to seasonality. Our sales are typically higher in the fourth quarter of each year as a result of the Christmas season. In 2006, 28.3% of our sales in the domestic market were made during this period. Any economic downturn, suspension of our business or delay on the delivery of raw materials to us by our suppliers in the last quarter of the year may adversely affect our operating results. Moreover, during the Christmas period, we must proportionally increase our inventory levels and hire additional employees in order to properly meet the additional consumer demand. As a result, any unexpected decrease or an inaccurate estimate of demand for our products during this period may force us to sell excess inventory at lower prices, which could have a material adverse effect on us. Our operating results may be adversely affected by climate fluctuations. Our business may be adversely affected by unseasonable climatic conditions. We cannot predict prolonged periods of hot temperatures during the winter or cold temperatures during the summer, which could cause our inventory levels to be misaligned with consumer demand during these unexpected conditions. As a result, unseasonable climatic conditions may force us to sell our excess inventory at low prices, which could have a material adverse effect on us. The principal raw material of our products is cotton, the price of which is established in the international market and is denominated in U.S. dollars. As we operate in the apparel industry, our principal raw material is cotton and its by-products (such as fibers and textiles). The price of cotton is established in accordance with the worldwide variation of supply and demand and is generally denominated in U.S. dollars. In the event of a significant increase in cotton prices, or an increase in the value of the U.S. dollar against the real, we may not be able to transfer these costs to our consumers, which may decrease our profit margins and adversely affect our business. 17
  • 28. Risk factors RISKS RELATING TO OUR BUSINESS We may not be able to identify or promptly and accurately respond to changes in apparel industry trends and consumer preferences. Our sales and operating results depend on our ability to manage inventories and predict, identify and respond promptly to changes in apparel industry trends and consumer preferences. Due to their nature, however, our estimates carry a degree of risk. In the event that we are not able to predict, identify or respond to changes in apparel trends and consumer preferences or in the event we are not able to properly analyze the market for the sale of our products or any new line of products, our sales may decrease and, therefore, we may not be able to sell a significant volume of our inventory. As a result, we may be forced to lower the prices of our products or carry out promotional sales to sell our inventory, which could have a material adverse effect on us. Our information technology systems are subject to possible failures, which may adversely affect our business. Our operations depend on the operational security, reliability and stability of several systems comprising our information technology platform, such as the systems related to points of sale, logistics and communications, among others. Our existing contingency plans do not assure complete and prompt recovery of our activities in the event of any accident or failure in our information technology systems. In the event our information technology systems do not operate properly, our business may be adversely affected. We are subject to risks related to our distribution centers. Currently, we have three distribution centers located in the southern and midwestern regions of Brazil. All of our products are distributed through these distribution centers. In the event of significant damage to any of these distribution centers, we would be unable to distribute all our products on schedule and our business may be adversely affected. The departure of members of our management or key employees, or our failure to attract and retain qualified personnel to replace them, may adversely affect us. Our ability to be competitive and meet our growth strategies depends on our management, which is comprised of experienced executives and key employees with a deep understanding of our business. We cannot assure you that we will be able to attract and retain qualified personnel to our management or to occupy key positions. The departure of any member of our management or key employee, or our failure to attract and retain qualified personnel to replace them, may adversely affect our financial condition and results of operations. We may face difficulties in successfully launching new stores, which may adversely affect our net sales and operating results. Our growth depends on the successful launching of new owned and franchised stores. We intend to launch a significant number of new owned and franchised stores over the next years. Our ability to open new stores, however, is subject to a number of risks and uncertainties, including an increase in competitors and in competition in strategic points of sale, difficulty in finding adequate locations, as well as ongoing periodic refurbishments of existing stores. In addition, our recently launched architectural refurbishment project for Hering stores may not result in the increased sales and additional customers we expect. In the event we are not able to launch or successfully operate new stores, our results of operations and the market price of our common shares may be adversely affected. 18
  • 29. Risk factors We are subject to extensive environmental and health regulations, which may become stricter in the future and thereby increase the costs necessary to comply with applicable regulatory requirements. We are subject to extensive Brazilian federal, state and local environmental and health regulations, including inspections by government agencies which regulate, among other things: (i) the emission and disposal of hazardous materials into the ground, air and water; (ii) the generation, storage, handling, usage and transportation of hazardous materials; and (iii) the health and security of our employees. We are required to obtain permits from appropriate governmental authorities in connection with certain aspects of our operations and any expansion of our operations will be subject to our further ability to obtain additional permits. Under current regulations, we are required to maintain pollution control equipment, as well as to make operational changes to limit negative effects or potential negative effects on the environment and the health and safety of our employees. Any inability to comply with these regulations may subject us to significant fines, revocation of our licenses, suspension of our activities or possible criminal penalties, which may result in a material adverse effect on us. We may also be required to allocate significant resources and increase our capital expenditures in order to comply with these regulations, which could reduce other planned expenditures and negatively affect our financial condition and operating results. We cannot assure that the costs arising from our compliance with all present and future environmental protection rules will not have a material adverse effect on us. We may also be responsible for significant costs for environmental recovery. Moreover, a governmental decision to reject the renewal, or delay the issuance of, a new license, or to modify an existing license, may negatively affect the continuity of our operations at the relevant manufacturing facility. In the event of significant devaluation of the real, we may not have the sufficient financial resources to service our foreign currency denominated indebtedness arising from the issuance of Eurobonds. After the Brazilian foreign exchange crisis of 1999, we were required to restructure our real and foreign currency denominated debt by extending maturities and reducing interest rates. As a result, we maintained, under the terms and conditions of the restructuring, our debt in foreign currencies, represented primarily by Eurobonds maturing in 2007, 2008 and 2009. As of March 31, 2007, the aggregate principal amount of our Eurobonds was R$60.5 million (US$ 29.7 million) and accrued interest thereon was R$1.7 million (US$0.8 million). We have not entered into hedging transactions to cover the foreign exchange risks related to these obligations. As a result, in the event of significant devaluation of the real, we may not be able to service the indebtedness represented by the Eurobonds, which could adversely affect our results of operations and financial condition. We received a tax assessment related to our Eurobonds. In the event that we are not able to obtain a favorable outcome from the administrative claim we have filed, we may be obligated to pay a significant tax assessment to the Brazilian government. We received a tax assessment from the Brazilian Federal Revenue Service (Secretaria da Receita Federal) alleging a failure to pay withholding tax in connection with the purchase of our Eurobonds by one of our subsidiaries in December 2000, April, May and December 2001, and April and May 2002. We have filed an appeal challenging the constitutionality of the tax assessment and our legal advisors consider the chances of an unfavorable outcome to be remote. However, there is no prior case law on the matter, and we cannot assure a favorable outcome. In the event of an unfavorable outcome, we would be required to pay taxes not collected, plus interest and fines (equal to 150% of the taxes not collected). The amount payable, which was equivalent to approximately R$34.5 million as of March 31, 2007, would immediately be recorded in our balance sheet, and would negatively affect our business and our results of operations. See “Business—Legal and administrative contingencies—Tax proceedings.” 19