SlideShare una empresa de Scribd logo
1 de 2
Descargar para leer sin conexión
Traffic delays caused by congestion are expected to be
         worse in the absence of the Growth Plan.
         A sample commute that included 10 minutes of delay in
         2006, is estimated to see a one-and-a-half minute
         increase in delay under the Growth Plan scenario.
         In contrast, the same commute under business-as-usual
         conditions would take an additional 14 minutes in 2031.
         View the full report and tell us what you think at
         www.placestogrow.ca


                                   Visit www.placestogrow.ca                                                                                                                                                                                   Growth Plan for the Greater Golden Horseshoe, 2006
                                   for more information
                                                                                                                                                                                                                                               Progress Report FIVE YEARS IN
006      COMPUTER MODELLING TO 2031
                              Date
         Growth Plan for the Greater Golden Horseshoe, 2006:                                                                                                                                                                                                                                       Key Findings
         Places to Grow Concept
                                                                                                                                                                                                                                                                                                                                                       Inner Ring:
                                             Georgian Bay                                                                                                                                                                                                                                          Curbing Sprawl                                      Housing Construction Starts by Unit Type
                                                                                                                                          OUTER                                                                                                                                                    Intensification and downtown redevelopment are
                                                                                                                                           RING
                                                                                                                                                                                                                                                                                                   happening. Of the 63,000 new residential units
                                                                                                                                                                                                                                                                                                   added to the Greater Golden Horseshoe between                 Apartment or
                                                                                                                                                                                                                                                                                                   June 2009 and June 2010, 42,000 – or 67% –
                                                                                                         Lake                                                                                                                                                                                                                                           29%
                                                                                                        Simcoe
                                                                                                                                                                                                                                                                                                                                                                 Multi-Residential
                                                                                                                                                                                                                                                                                                                                                                                                     Apartment or
                                                                                                                                                                                                                                                                                                   were located in the existing built-up area.                   Row or                     40%      Multi-Residential
                                                                                                                                                                                                                       Urban Strategies Inc.
                                                                                                                                                                                                                                                                                                                                                        15%      Townhouse
                                                                                                                                                                                                                                                                                                                                                                                                     Row or
                                                                                                                                                                                                                                                                                                                                                         9%      Semi-detached              15%      Townhouse
                                                                                                                 INNER                                                                                                                                                                                                                                                                       7%      Semi-detached
                                                                                                                  RING                                                                                                                                                                             Building Better Suburbs
                                                                                                                                                                                                                                                                                                   Planned residential densities have increased in
                                                                                                                                                                                                                                                                                                   suburban developments since the Growth Plan
                                                                                                                                                                                                                                                                                                   came into effect. The increase is most evident       47%      Single                     38%      Single
                                                                                                                                                                                                                                                                                                   in “Outer Ring” communities of the Greater
                                                                                                                                                                                                                                                                                                   Golden Horseshoe.                                   2001- 2005                          2006-2010


                                                                                                                                                                                                                                                                                                                                                       Outer Ring:
                                                                                                                                                                                                                                                                                                                                                       Housing Construction Starts by Unit Type
                                                                                                                           Lake Ontario
                                                                                                                                                                                                                                                                                                   Providing Housing Choice                                      Apartment or
                                                                                                                                                                                                                                                                                                                                                         9%
                                                                                                                                                                                                                                                                                                   A shift toward a wider range of housing types is              Multi-Residential                   Apartment or
                                                                                                                                                                                                                                                                                                                                                                                            17%      Multi-Residential
                                                                                                                                                                                                                                                                                                   occurring across the Greater Golden Horseshoe.                Row or
                                                                                                                                                                                                                                                                                                                                                                 Townhouse
                                                                                                                                                                                                                                                                                                                                                        16%
                                                                                                                                                                                                                                                                                                   Many municipalities are reporting that develop­       4%      Semi-detached                       Row or
                                                                                                                                                                                                                                                                                                   ment patterns are incorporating more apart­ ents,
                                                                                                                                                                                                                                                                                                                                              m                                             20%      Townhouse
                                                                                                                                                                                                                                                                                                                                                                                             4%      Semi-detached
                                                                                                                                                                                                                                                                                                   condominiums and townhouses. A broader range
                                                                                                                                                                                                                                                                                                   of housing can better meet the needs of residents
                                                                                                                                                                                                                                                                                                   of different ages and income levels.
                                                                                                                                                                                                     City of Cambridge Photo Gallery


                                                                                                                                                                                                                                                                                                   Revitalizing Downtowns                               71%                                 59%
                                                                                                                                                                                                                                                                                                                                                                 Single                              Single
                                                                                                                                                                                                                                                                                                   Investments in public institutions, parks and
                                                                                     Lake Erie
                                                                                                                                                                                                                                                                                                   public spaces are leading revitalization efforts    2001- 2005                          2006-2010
      Growth Plan for the Greater Golden                                                                         Municipal Implementation                                                                                                                                                          in many urban growth centres, for example in
                                                                                                                                                                                                                                                                                                                                                       The charts above are based on Census Metropolitan Areas.
                                                                                                                                                                                                                                                                                                   Oshawa, Mississauga and Kitchener. Major office
      Horseshoe, 2006                                                                                            All upper and single tier municipalities have                                                                                                                                     development is picking up in some downtowns
                                                                                                                 adopted an official plan amendment to conform                                                                                                                                     and starting to move back into others, for
      A 25-year plan that aims to curb urban sprawl,
                                                                                                                 to the policies of the Growth Plan for the Greater                                                                                                                                example in Markham Centre, downtown Toronto
      revitalize downtowns, create complete communities
                                                                                                                 Golden Horseshoe.                                                                                                                                                                 and downtown Pickering.
      and increase housing and transportation choice.                                                                                                                                                                                                                                                                                                  Annual Transit Passenger Trips in the
                                                                                                                                                                                                                                                         Margaret Antkowski - suburbantourist.ca
                                                                                                                                                                                                                                                                                                                                                       Greater Golden Horseshoe (in millions)
                                                                                                                     In Effect             Appealed*             Awaiting            Other
                                                                                                                                                                 Decision
      The Greater Golden Horseshoe                                                                                        6                      12                  1                 2
                                                                                                                                                                                                                                                                                                   Increasing Transportation Choice                                                                637 653 657
                                                                                                                                                                                                                                                                                                                                                                                           593 614
      Canada’s largest and most populous urban region                                                                Counties of             Regions of        County of Brant     Counties of                                                                                                     Transit ridership has been increasing steadily      544 558 556 550 526

      accounts for approximately 20% of Canada’s                                                                   Peterborough,
                                                                                                                   Wellington and
                                                                                                                                            Halton, York,
                                                                                                                                              Durham,
                                                                                                                                                                                 Northumberland
                                                                                                                                                                                  and Dufferin
                                                                                                                                                                                                                                                                                                   in the Greater Golden Horseshoe, from a low
      GDP and 70% of Ontario’s GDP. Its population is                                                               Haldimand;             Peel, Niagara,                                                                                                                                          point of 526 million transit passenger trips in
                                                                                                                    and Cities of            Waterloo;
      forecast to grow from 8.4 million in 2006 to 11.5                                                              Brantford,               Cities of
                                                                                                                                                                                                                                                                                                   2004 to 657 million transit passenger trips in
      million in 2031.                                                                                              Guelph and             Barrie, Toronto,                                                                                                                                        2009. Since 2006, the Province has invested
                                                                                                                   Peterborough           Hamilton, Orillia,
                                                                                                                                          Kawartha Lakes;                                                                                                                                          approximately $8.6 billion in public transit
                                                                                                                                           Simcoe County                                                                                                                                           across Ontario, including $4.1 billion in


                                                                                                                                                                                                                                                                                                                                                        2000

                                                                                                                                                                                                                                                                                                                                                               2001

                                                                                                                                                                                                                                                                                                                                                                      2002

                                                                                                                                                                                                                                                                                                                                                                             2003

                                                                                                                                                                                                                                                                                                                                                                                    2004

                                                                                                                                                                                                                                                                                                                                                                                           2005

                                                                                                                                                                                                                                                                                                                                                                                                  2006

                                                                                                                                                                                                                                                                                                                                                                                                         2007

                                                                                                                                                                                                                                                                                                                                                                                                                2008

                                                                                                                                                                                                                                                                                                                                                                                                                       2009
                                                                                                                 * he reason for appeals to the Ontario Municipal Board may not be related to the
                                                                                                                  T
                                                                                                                                                                                                                                                                                                   GO Transit.
                                                                                                                  Growth Plan. Chart current as of February 7, 2012.


                                                                   This information was developed to assist individuals in understanding the Growth Plan for the Greater Golden Horseshoe, 2006,
      Current as of                                                which was released under the Places to Grow Act, 2005. The information provided should not be relied upon as a substitute for
      FEBRUARY 2012                                                legal or professional advice in connection with any particular matter.
Traffic delays caused by congestion are expected to be
         worse in the absence of the Growth Plan.
         A sample commute that included 10 minutes of delay in
         2006, is estimated to see a one-and-a-half minute
         increase in delay under the Growth Plan scenario.
         In contrast, the same commute under business-as-usual
         conditions would take an additional 14 minutes in 2031.
         View the full report and tell us what you think at
         www.placestogrow.ca


                                   Visit www.placestogrow.ca                                                                                                                                                               Growth Plan for the Greater Golden Horseshoe, 2006
                                   for more information
                                                                                                                                                                                                                           Progress Report FIVE YEARS IN
      Modeling Future Scenarios
006      COMPUTER MODELLING TO 2031
                              Date                                                                                                                                                                                             2031 Urbanized Land: Growth Plan Scenario –                                                                    2031 Urbanized Land: No Growth Plan Scenario –
                                                                                                                                                                                                                               Conceptual                                                                                                     Conceptual
                                                                                                               Modeling the Growth Plan’s Future Impacts
         Greater Golden Horseshoe Population
                                                                                                               Computer modeling was undertaken to compare trends that would occur under
         (in millions)
                                                                                                               a “No Growth Plan” scenario – as if the Growth Plan had never come into effect
                                                                                                               – with a scenario in which the land use and transportation policies of the Plan
         1981                                                                            5.4
                                                                                                               are fully implemented. Using the Growth Plan’s forecasts, population growth
                                                                                                               was assumed to be the same in each scenario, and the model predicts how
         1991                                                                            6.5                   land development and commuter trips would differ in the future in each case.
                                                                                                               The findings provide a picture of alternative future trends and do not represent
         2001                                                                            7.8                   actual results after 2006.

         2006                                                                            8.4


                      FORECASTED

         2011                                                                            9.1


         2021                                                                            10.3
                                                                                                                                                                                                                           The map above depicts modeling of conceptual future urban growth to 2031 based on the                           Note: The information displayed on the maps is not to scale, does not accurately reflect approved land-
         2031                                                                            11.5                                                                                                                              implementation of the Growth Plan for the Greater Golden Horseshoe, 2006. The map at right depicts              use and planning boundaries, and may be out of date. For more information on precise boundaries, the
                                                                                                                                                                                                                           modeling of conceptual future urban growth to 2031 based on development trends that existed prior               appropriate municipality should be consulted. For more information on Greenbelt Area boundaries, the
                                                                                                                                                                                                                           to the Growth Plan for the Greater Golden Horseshoe, 2006. The maps are for demonstration purposes              Greenbelt Plan 2005 should be consulted. The Province of Ontario assumes no responsibility or liability
                                                                                                                                                                                                                           only and do not indicate or endorse the specific location, timing or approval of any lands or uses to be        for any consequences of any use made of the maps.
                                                                                                                                                                                                                           developed.


         Curbing Sprawl to 2031                                                                                 Differences in Projected Land Use Patterns:
                                                                                                                No Growth Plan versus Growth Plan Scenarios
                                                                                                                                                                                                   Mitigating Traffic      Example of Projected Increases in
                                                                                                                                                                                                                           Road Delay
                                                                                                                                                                                                                                                                                                   Increasing Transportation                                     Differences in Forecasted Changes to Travel Patterns:
                                                                                                                                                                                                                                                                                                                                                                 No Growth Plan versus Growth Plan Scenarios
         Computer modeling indicates that in a Growth
                                                                                                                   2006 to 2031 Change – No Growth Plan
                                                                                                                                                                                                   Delays to 2031              Delay
                                                                                                                                                                                                                                                                                                   Choice to 2031                                                    2006 to 2031 Change – No Growth Plan
         Plan Scenario, by 2031:                                                                                   2006 to 2031 Change – Growth Plan                                                                                                                                                                                                                 2006 to 2031 Change – Growth Plan
                                                                                                                                                                                                   Traffic delays caused                                                                           In both a Growth Plan and a no
         •	 Approximately one-third the amount of                                                                                                                                                  by congestion in 2031                                                                           Growth Plan scenario, population
            greenfield land would be urbanized compared                                                                                                                                            would be worse in                                                                               growth in the region will result
                                                                                                                                                                                                                            2006
            to a “no Growth Plan” development pattern.                                                                                                                                             the absence of the                                                                              in more car trips, more vehicle
             •	   Conserving as much as 800 square                                                                                                                                                 Growth Plan. A sample                                                                           kilometres traveled and an
                  kilometres of agricultural and rural land                                                                                                                                        commute that takes 30                                                                           increase in average length of car
         •	 More than half of all development would occur                                                                                                                                          minutes today would      2031 (Growth Plan)                                                     trips. In the Growth Plan scenario,
            through intensification within the built-up                                                                                                                                            take 43 minutes in                                                                              however, the outcomes are better:
            area, compared with less than one-quarter                                                                                                                                              a “no Growth Plan”                                                                              there are more “sustainable” trips,
            without the Growth Plan.                                                                                                                                                               scenario.                                                                                       relatively fewer auto trips, fewer
                                                                                                                                                                                                                            2031 (No Growth Plan)
                                                                                                                                                                                                                                                                                                   vehicle kilometres traveled and
         •	 Average urban densities, measured by people
                                                                                                                                                                                                                                                                                                   lower greenhouse gas emissions.
            and jobs per hectare, would go up 20%.
                                                                                                                                                                                                                           0           10         20         30          40         50
                                                                                                                                                                                                                                                                                                   Note: All transportation figures reflect morning peak
         Notes                                                                                                    39%       14%               22%        54%                       20%                                                                                                                                                                            31% 23%         33% 61%           47% 30%         16% 2%         29% 13%
                                                                                                                                                                                                                           Commute (minutes)                                                       period (3 hour) travel data
         1  ew urbanized land is defined as lands that are built on beyond the Growth
           N
           Plan’s 2006 built boundary.                                                                                                                                   -2%                                                                                                                                                                                      Increase in     Increase in       Increase in     Increase       Increase in
         2 ntensification refers to the total number of people and jobs accommodated
           I                                                                                                                                                                                                                                                                                                                                                      the Number      Sustainable       Total Vehicle   in Average     Greenhouse
           within the Growth Plan’s 2006 built-up area.                                                                                                                                                                                                                                                                                                           of Auto Trips   Trips (Transit,   Kilometres      Auto Trip      Gas
                                                                                                               Increase in New             Share of                   Change in
         3  otal urbanized area is defined as the Growth Plan’s 2006 built-up area
           T                                                                                                                                                                                                                                                                                                                                                                      Walking,          Travelled       Length         Emissions
                                                                                                               Urbanized Land 1            Total Growth               Average Density
           plus new urbanized land (see note 1 above).                                                                                                                                                                                                                                                                                                                            Cycling)                          (kilometres)   from Auto
                                                                                                                                           Accommodated               Within Total
                                                                                                                                                                                                                                                                                                                                                                                                                                   and Transit
                                                                                                                                           Through                    Urbanized Area 3
                                                                                                                                                                                                                                                                                                                                                                                                                                   Modes
                                                                                                                                           Intensification 2


                                                                   This information was developed to assist individuals in understanding the Growth Plan for the Greater Golden Horseshoe, 2006,
      Current as of                                                which was released under the Places to Grow Act, 2005. The information provided should not be relied upon as a substitute for
      FEBRUARY 2012                                                legal or professional advice in connection with any particular matter.

Más contenido relacionado

Destacado

2024 State of Marketing Report – by Hubspot
2024 State of Marketing Report – by Hubspot2024 State of Marketing Report – by Hubspot
2024 State of Marketing Report – by HubspotMarius Sescu
 
Everything You Need To Know About ChatGPT
Everything You Need To Know About ChatGPTEverything You Need To Know About ChatGPT
Everything You Need To Know About ChatGPTExpeed Software
 
Product Design Trends in 2024 | Teenage Engineerings
Product Design Trends in 2024 | Teenage EngineeringsProduct Design Trends in 2024 | Teenage Engineerings
Product Design Trends in 2024 | Teenage EngineeringsPixeldarts
 
How Race, Age and Gender Shape Attitudes Towards Mental Health
How Race, Age and Gender Shape Attitudes Towards Mental HealthHow Race, Age and Gender Shape Attitudes Towards Mental Health
How Race, Age and Gender Shape Attitudes Towards Mental HealthThinkNow
 
AI Trends in Creative Operations 2024 by Artwork Flow.pdf
AI Trends in Creative Operations 2024 by Artwork Flow.pdfAI Trends in Creative Operations 2024 by Artwork Flow.pdf
AI Trends in Creative Operations 2024 by Artwork Flow.pdfmarketingartwork
 
PEPSICO Presentation to CAGNY Conference Feb 2024
PEPSICO Presentation to CAGNY Conference Feb 2024PEPSICO Presentation to CAGNY Conference Feb 2024
PEPSICO Presentation to CAGNY Conference Feb 2024Neil Kimberley
 
Content Methodology: A Best Practices Report (Webinar)
Content Methodology: A Best Practices Report (Webinar)Content Methodology: A Best Practices Report (Webinar)
Content Methodology: A Best Practices Report (Webinar)contently
 
How to Prepare For a Successful Job Search for 2024
How to Prepare For a Successful Job Search for 2024How to Prepare For a Successful Job Search for 2024
How to Prepare For a Successful Job Search for 2024Albert Qian
 
Social Media Marketing Trends 2024 // The Global Indie Insights
Social Media Marketing Trends 2024 // The Global Indie InsightsSocial Media Marketing Trends 2024 // The Global Indie Insights
Social Media Marketing Trends 2024 // The Global Indie InsightsKurio // The Social Media Age(ncy)
 
Trends In Paid Search: Navigating The Digital Landscape In 2024
Trends In Paid Search: Navigating The Digital Landscape In 2024Trends In Paid Search: Navigating The Digital Landscape In 2024
Trends In Paid Search: Navigating The Digital Landscape In 2024Search Engine Journal
 
5 Public speaking tips from TED - Visualized summary
5 Public speaking tips from TED - Visualized summary5 Public speaking tips from TED - Visualized summary
5 Public speaking tips from TED - Visualized summarySpeakerHub
 
ChatGPT and the Future of Work - Clark Boyd
ChatGPT and the Future of Work - Clark Boyd ChatGPT and the Future of Work - Clark Boyd
ChatGPT and the Future of Work - Clark Boyd Clark Boyd
 
Getting into the tech field. what next
Getting into the tech field. what next Getting into the tech field. what next
Getting into the tech field. what next Tessa Mero
 
Google's Just Not That Into You: Understanding Core Updates & Search Intent
Google's Just Not That Into You: Understanding Core Updates & Search IntentGoogle's Just Not That Into You: Understanding Core Updates & Search Intent
Google's Just Not That Into You: Understanding Core Updates & Search IntentLily Ray
 
Time Management & Productivity - Best Practices
Time Management & Productivity -  Best PracticesTime Management & Productivity -  Best Practices
Time Management & Productivity - Best PracticesVit Horky
 
The six step guide to practical project management
The six step guide to practical project managementThe six step guide to practical project management
The six step guide to practical project managementMindGenius
 
Beginners Guide to TikTok for Search - Rachel Pearson - We are Tilt __ Bright...
Beginners Guide to TikTok for Search - Rachel Pearson - We are Tilt __ Bright...Beginners Guide to TikTok for Search - Rachel Pearson - We are Tilt __ Bright...
Beginners Guide to TikTok for Search - Rachel Pearson - We are Tilt __ Bright...RachelPearson36
 

Destacado (20)

2024 State of Marketing Report – by Hubspot
2024 State of Marketing Report – by Hubspot2024 State of Marketing Report – by Hubspot
2024 State of Marketing Report – by Hubspot
 
Everything You Need To Know About ChatGPT
Everything You Need To Know About ChatGPTEverything You Need To Know About ChatGPT
Everything You Need To Know About ChatGPT
 
Product Design Trends in 2024 | Teenage Engineerings
Product Design Trends in 2024 | Teenage EngineeringsProduct Design Trends in 2024 | Teenage Engineerings
Product Design Trends in 2024 | Teenage Engineerings
 
How Race, Age and Gender Shape Attitudes Towards Mental Health
How Race, Age and Gender Shape Attitudes Towards Mental HealthHow Race, Age and Gender Shape Attitudes Towards Mental Health
How Race, Age and Gender Shape Attitudes Towards Mental Health
 
AI Trends in Creative Operations 2024 by Artwork Flow.pdf
AI Trends in Creative Operations 2024 by Artwork Flow.pdfAI Trends in Creative Operations 2024 by Artwork Flow.pdf
AI Trends in Creative Operations 2024 by Artwork Flow.pdf
 
Skeleton Culture Code
Skeleton Culture CodeSkeleton Culture Code
Skeleton Culture Code
 
PEPSICO Presentation to CAGNY Conference Feb 2024
PEPSICO Presentation to CAGNY Conference Feb 2024PEPSICO Presentation to CAGNY Conference Feb 2024
PEPSICO Presentation to CAGNY Conference Feb 2024
 
Content Methodology: A Best Practices Report (Webinar)
Content Methodology: A Best Practices Report (Webinar)Content Methodology: A Best Practices Report (Webinar)
Content Methodology: A Best Practices Report (Webinar)
 
How to Prepare For a Successful Job Search for 2024
How to Prepare For a Successful Job Search for 2024How to Prepare For a Successful Job Search for 2024
How to Prepare For a Successful Job Search for 2024
 
Social Media Marketing Trends 2024 // The Global Indie Insights
Social Media Marketing Trends 2024 // The Global Indie InsightsSocial Media Marketing Trends 2024 // The Global Indie Insights
Social Media Marketing Trends 2024 // The Global Indie Insights
 
Trends In Paid Search: Navigating The Digital Landscape In 2024
Trends In Paid Search: Navigating The Digital Landscape In 2024Trends In Paid Search: Navigating The Digital Landscape In 2024
Trends In Paid Search: Navigating The Digital Landscape In 2024
 
5 Public speaking tips from TED - Visualized summary
5 Public speaking tips from TED - Visualized summary5 Public speaking tips from TED - Visualized summary
5 Public speaking tips from TED - Visualized summary
 
ChatGPT and the Future of Work - Clark Boyd
ChatGPT and the Future of Work - Clark Boyd ChatGPT and the Future of Work - Clark Boyd
ChatGPT and the Future of Work - Clark Boyd
 
Getting into the tech field. what next
Getting into the tech field. what next Getting into the tech field. what next
Getting into the tech field. what next
 
Google's Just Not That Into You: Understanding Core Updates & Search Intent
Google's Just Not That Into You: Understanding Core Updates & Search IntentGoogle's Just Not That Into You: Understanding Core Updates & Search Intent
Google's Just Not That Into You: Understanding Core Updates & Search Intent
 
How to have difficult conversations
How to have difficult conversations How to have difficult conversations
How to have difficult conversations
 
Introduction to Data Science
Introduction to Data ScienceIntroduction to Data Science
Introduction to Data Science
 
Time Management & Productivity - Best Practices
Time Management & Productivity -  Best PracticesTime Management & Productivity -  Best Practices
Time Management & Productivity - Best Practices
 
The six step guide to practical project management
The six step guide to practical project managementThe six step guide to practical project management
The six step guide to practical project management
 
Beginners Guide to TikTok for Search - Rachel Pearson - We are Tilt __ Bright...
Beginners Guide to TikTok for Search - Rachel Pearson - We are Tilt __ Bright...Beginners Guide to TikTok for Search - Rachel Pearson - We are Tilt __ Bright...
Beginners Guide to TikTok for Search - Rachel Pearson - We are Tilt __ Bright...
 

5 year update ggh

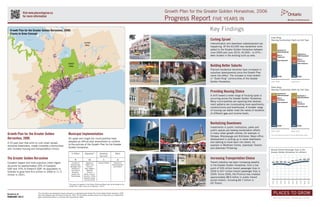
  • 1. Traffic delays caused by congestion are expected to be worse in the absence of the Growth Plan. A sample commute that included 10 minutes of delay in 2006, is estimated to see a one-and-a-half minute increase in delay under the Growth Plan scenario. In contrast, the same commute under business-as-usual conditions would take an additional 14 minutes in 2031. View the full report and tell us what you think at www.placestogrow.ca Visit www.placestogrow.ca Growth Plan for the Greater Golden Horseshoe, 2006 for more information Progress Report FIVE YEARS IN 006 COMPUTER MODELLING TO 2031 Date Growth Plan for the Greater Golden Horseshoe, 2006: Key Findings Places to Grow Concept Inner Ring: Georgian Bay Curbing Sprawl Housing Construction Starts by Unit Type OUTER Intensification and downtown redevelopment are RING happening. Of the 63,000 new residential units added to the Greater Golden Horseshoe between Apartment or June 2009 and June 2010, 42,000 – or 67% – Lake 29% Simcoe Multi-Residential Apartment or were located in the existing built-up area. Row or 40% Multi-Residential Urban Strategies Inc. 15% Townhouse Row or 9% Semi-detached 15% Townhouse INNER 7% Semi-detached RING Building Better Suburbs Planned residential densities have increased in suburban developments since the Growth Plan came into effect. The increase is most evident 47% Single 38% Single in “Outer Ring” communities of the Greater Golden Horseshoe. 2001- 2005 2006-2010 Outer Ring: Housing Construction Starts by Unit Type Lake Ontario Providing Housing Choice Apartment or 9% A shift toward a wider range of housing types is Multi-Residential Apartment or 17% Multi-Residential occurring across the Greater Golden Horseshoe. Row or Townhouse 16% Many municipalities are reporting that develop­ 4% Semi-detached Row or ment patterns are incorporating more apart­ ents, m 20% Townhouse 4% Semi-detached condominiums and townhouses. A broader range of housing can better meet the needs of residents of different ages and income levels. City of Cambridge Photo Gallery Revitalizing Downtowns 71% 59% Single Single Investments in public institutions, parks and Lake Erie public spaces are leading revitalization efforts 2001- 2005 2006-2010 Growth Plan for the Greater Golden Municipal Implementation in many urban growth centres, for example in The charts above are based on Census Metropolitan Areas. Oshawa, Mississauga and Kitchener. Major office Horseshoe, 2006 All upper and single tier municipalities have development is picking up in some downtowns adopted an official plan amendment to conform and starting to move back into others, for A 25-year plan that aims to curb urban sprawl, to the policies of the Growth Plan for the Greater example in Markham Centre, downtown Toronto revitalize downtowns, create complete communities Golden Horseshoe. and downtown Pickering. and increase housing and transportation choice. Annual Transit Passenger Trips in the Margaret Antkowski - suburbantourist.ca Greater Golden Horseshoe (in millions) In Effect Appealed* Awaiting Other Decision The Greater Golden Horseshoe 6 12 1 2 Increasing Transportation Choice 637 653 657 593 614 Canada’s largest and most populous urban region Counties of Regions of County of Brant Counties of Transit ridership has been increasing steadily 544 558 556 550 526 accounts for approximately 20% of Canada’s Peterborough, Wellington and Halton, York, Durham, Northumberland and Dufferin in the Greater Golden Horseshoe, from a low GDP and 70% of Ontario’s GDP. Its population is Haldimand; Peel, Niagara, point of 526 million transit passenger trips in and Cities of Waterloo; forecast to grow from 8.4 million in 2006 to 11.5 Brantford, Cities of 2004 to 657 million transit passenger trips in million in 2031. Guelph and Barrie, Toronto, 2009. Since 2006, the Province has invested Peterborough Hamilton, Orillia, Kawartha Lakes; approximately $8.6 billion in public transit Simcoe County across Ontario, including $4.1 billion in 2000 2001 2002 2003 2004 2005 2006 2007 2008 2009 * he reason for appeals to the Ontario Municipal Board may not be related to the T GO Transit. Growth Plan. Chart current as of February 7, 2012. This information was developed to assist individuals in understanding the Growth Plan for the Greater Golden Horseshoe, 2006, Current as of which was released under the Places to Grow Act, 2005. The information provided should not be relied upon as a substitute for FEBRUARY 2012 legal or professional advice in connection with any particular matter.
  • 2. Traffic delays caused by congestion are expected to be worse in the absence of the Growth Plan. A sample commute that included 10 minutes of delay in 2006, is estimated to see a one-and-a-half minute increase in delay under the Growth Plan scenario. In contrast, the same commute under business-as-usual conditions would take an additional 14 minutes in 2031. View the full report and tell us what you think at www.placestogrow.ca Visit www.placestogrow.ca Growth Plan for the Greater Golden Horseshoe, 2006 for more information Progress Report FIVE YEARS IN Modeling Future Scenarios 006 COMPUTER MODELLING TO 2031 Date 2031 Urbanized Land: Growth Plan Scenario – 2031 Urbanized Land: No Growth Plan Scenario – Conceptual Conceptual Modeling the Growth Plan’s Future Impacts Greater Golden Horseshoe Population Computer modeling was undertaken to compare trends that would occur under (in millions) a “No Growth Plan” scenario – as if the Growth Plan had never come into effect – with a scenario in which the land use and transportation policies of the Plan 1981 5.4 are fully implemented. Using the Growth Plan’s forecasts, population growth was assumed to be the same in each scenario, and the model predicts how 1991 6.5 land development and commuter trips would differ in the future in each case. The findings provide a picture of alternative future trends and do not represent 2001 7.8 actual results after 2006. 2006 8.4 FORECASTED 2011 9.1 2021 10.3 The map above depicts modeling of conceptual future urban growth to 2031 based on the Note: The information displayed on the maps is not to scale, does not accurately reflect approved land- 2031 11.5 implementation of the Growth Plan for the Greater Golden Horseshoe, 2006. The map at right depicts use and planning boundaries, and may be out of date. For more information on precise boundaries, the modeling of conceptual future urban growth to 2031 based on development trends that existed prior appropriate municipality should be consulted. For more information on Greenbelt Area boundaries, the to the Growth Plan for the Greater Golden Horseshoe, 2006. The maps are for demonstration purposes Greenbelt Plan 2005 should be consulted. The Province of Ontario assumes no responsibility or liability only and do not indicate or endorse the specific location, timing or approval of any lands or uses to be for any consequences of any use made of the maps. developed. Curbing Sprawl to 2031 Differences in Projected Land Use Patterns: No Growth Plan versus Growth Plan Scenarios Mitigating Traffic Example of Projected Increases in Road Delay Increasing Transportation Differences in Forecasted Changes to Travel Patterns: No Growth Plan versus Growth Plan Scenarios Computer modeling indicates that in a Growth 2006 to 2031 Change – No Growth Plan Delays to 2031 Delay Choice to 2031 2006 to 2031 Change – No Growth Plan Plan Scenario, by 2031: 2006 to 2031 Change – Growth Plan 2006 to 2031 Change – Growth Plan Traffic delays caused In both a Growth Plan and a no • Approximately one-third the amount of by congestion in 2031 Growth Plan scenario, population greenfield land would be urbanized compared would be worse in growth in the region will result 2006 to a “no Growth Plan” development pattern. the absence of the in more car trips, more vehicle • Conserving as much as 800 square Growth Plan. A sample kilometres traveled and an kilometres of agricultural and rural land commute that takes 30 increase in average length of car • More than half of all development would occur minutes today would 2031 (Growth Plan) trips. In the Growth Plan scenario, through intensification within the built-up take 43 minutes in however, the outcomes are better: area, compared with less than one-quarter a “no Growth Plan” there are more “sustainable” trips, without the Growth Plan. scenario. relatively fewer auto trips, fewer 2031 (No Growth Plan) vehicle kilometres traveled and • Average urban densities, measured by people lower greenhouse gas emissions. and jobs per hectare, would go up 20%. 0 10 20 30 40 50 Note: All transportation figures reflect morning peak Notes 39% 14% 22% 54% 20% 31% 23% 33% 61% 47% 30% 16% 2% 29% 13% Commute (minutes) period (3 hour) travel data 1 ew urbanized land is defined as lands that are built on beyond the Growth N Plan’s 2006 built boundary. -2% Increase in Increase in Increase in Increase Increase in 2 ntensification refers to the total number of people and jobs accommodated I the Number Sustainable Total Vehicle in Average Greenhouse within the Growth Plan’s 2006 built-up area. of Auto Trips Trips (Transit, Kilometres Auto Trip Gas Increase in New Share of Change in 3 otal urbanized area is defined as the Growth Plan’s 2006 built-up area T Walking, Travelled Length Emissions Urbanized Land 1 Total Growth Average Density plus new urbanized land (see note 1 above). Cycling) (kilometres) from Auto Accommodated Within Total and Transit Through Urbanized Area 3 Modes Intensification 2 This information was developed to assist individuals in understanding the Growth Plan for the Greater Golden Horseshoe, 2006, Current as of which was released under the Places to Grow Act, 2005. The information provided should not be relied upon as a substitute for FEBRUARY 2012 legal or professional advice in connection with any particular matter.