Civil Beat Poll October 2012 voice crosstabs
•Descargar como DOC, PDF•
0 recomendaciones•309 vistas


Recomendados
Más contenido relacionado
Más de Honolulu Civil Beat
Más de Honolulu Civil Beat (20)
Civil Beat Poll October 2012 voice crosstabs
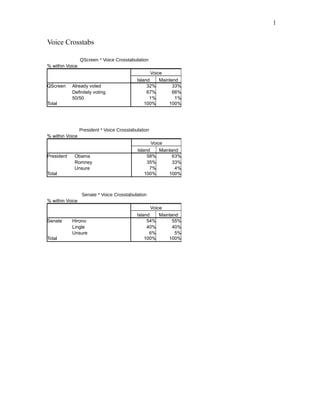
- 1. 1 Voice Crosstabs QScreen * Voice Crosstabulation % within Voice Voice Island Mainland QScreen Already voted 32% 33% Definitely voting 67% 66% 50/50 1% 1% Total 100% 100% President * Voice Crosstabulation % within Voice Voice Island Mainland President Obama 58% 63% Romney 35% 33% Unsure 7% 4% Total 100% 100% Senate * Voice Crosstabulation % within Voice Voice Island Mainland Senate Hirono 54% 55% Lingle 40% 40% Unsure 6% 5% Total 100% 100%
- 2. 1 CD1 * Voice Crosstabulation % within Voice Voice Island Mainland CD1 Hanabusa 49% 57% Djou 45% 41% Unsure 5% 2% Total 100% 100% CD2 * Voice Crosstabulation % within Voice Voice Island Mainland CD2 Gabbard 71% 74% Crowley 15% 16% Unsure 14% 10% Total 100% 100% Mayor * Voice Crosstabulation % within Voice Voice Island Mainland Mayor Cayetano 53% 47% Caldwell 41% 49% Unsure 7% 3% Total 100% 100% PresStrength * Voice Crosstabulation % within Voice Voice Island Mainland PresStrength Definitely 95% 94% Leaning 5% 5% Unsure 0% 1% Total 100% 100%
- 3. 1 PresDebates * Voice Crosstabulation % within Voice Voice Island Mainland PresDebates Very important 25% 31% Somewhat important 36% 36% Not important 38% 31% Unsure 2% 2% Total 100% 100% SenStrength * Voice Crosstabulation % within Voice Voice Island Mainland SenStrength Definitely 92% 96% Leaning 7% 4% Unsure 1% Total 100% 100% Lingle * Voice Crosstabulation % within Voice Voice Island Mainland Lingle Conservative 36% 37% Moderate 41% 43% Liberal 6% 6% Unsure 16% 14% Total 100% 100% CD1Hanabusa * Voice Crosstabulation % within Voice Voice Island Mainland CD1Hanabusa More likely 40% 48% Less likely 38% 33% No difference 17% 17% Unsure 5% 3% Total 100% 100%
- 4. 1 QMayorStrength * Voice Crosstabulation % within Voice Voice Island Mainland QMayorStrength Definitely 89% 91% Leaning 10% 9% Unsure 1% 0% Total 100% 100% PRP * Voice Crosstabulation % within Voice Voice Island Mainland PRP Less likely 13% 17% More likely 80% 77% Unsure 7% 7% Total 100% 100% Inouye * Voice Crosstabulation % within Voice Voice Island Mainland Inouye More likely 15% 26% Less likely 42% 35% No difference 38% 36% Unsure 6% 3% Total 100% 100% Rail * Voice Crosstabulation % within Voice Voice Island Mainland Rail Support 37% 45% Oppose 54% 49% Unsure 9% 5% Total 100% 100%
- 5. 1 RailImportant * Voice Crosstabulation % within Voice Voice Island Mainland RailImportant Very important 55% 59% Somewhat important 30% 26% Not important 14% 13% Unsure 1% 2% Total 100% 100% RetroPres * Voice Crosstabulation % within Voice Voice Island Mainland RetroPres McCain 24% 25% Obama 68% 70% Unsure 8% 5% Total 100% 100% RetroSenScreen * Voice Crosstabulation % within Voice Voice Island Mainland RetroSenScreen Democratic 72% 78% Republican 17% 13% Unsure 11% 9% Total 100% 100% RetroDemSen * Voice Crosstabulation % within Voice Voice Island Mainland RetroDemSen Case 47% 46% Hirono 51% 52% Unsure 2% 2% Total 100% 100%
- 6. 1 RetroGOPSen * Voice Crosstabulation % within Voice Voice Island Mainland RetroGOPSen Carrol 5% 8% Lingle 94% 91% Unsure 1% 1% Total 100% 100% RetroDemSen * Voice Crosstabulation % within Voice Voice Island Mainland RetroDemSen Case 47% 46% Hirono 51% 52% Unsure 2% 2% Total 100% 100% CD1QRetro * Voice Crosstabulation % within Voice Voice Island Mainland CD1QRetro Djou 42% 38% Hanabusa 51% 57% Unsure 7% 6% Total 100% 100% RetroMayor * Voice Crosstabulation % within Voice Voice Island Mainland RetroMayor Carlisle 23% 26% Caldwell 23% 22% Cayetano 44% 45% Unsure 10% 6% Total 100% 100%
- 7. 1 Age * Voice Crosstabulation % within Voice Voice Island Mainland Age 18-29 3% 7% 30-39 8% 6% 40-49 16% 10% 50-64 35% 35% 65+ 39% 41% Total 100% 100% Race_Ethnicity * Voice Crosstabulation % within Voice Voice Island Mainland Race_Ethnicity Caucasian 40% 42% Japanese 34% 34% Filipino 6% 3% Hawaiian 4% 5% Chinese 8% 6% Hispanic/Latino 1% 0% Other/Mixed 8% 9% Total 100% 100% Politics * Voice Crosstabulation % within Voice Voice Island Mainland Politics Liberal/Progressive 31% 30% Moderate 35% 43% Conservative 22% 20% Unsure 12% 8% Total 100% 100% Party_ID * Voice Crosstabulation % within Voice Voice Island Mainland Party_ID Democrat 56% 56% Republican 19% 17% Independent 21% 24% Unsure 3% 3% Total 100% 100%
- 8. 1 Education * Voice Crosstabulation % within Voice Voice Island Mainland Education No degree 1% 3% High School Degree 24% 21% College Degree 51% 41% Graduate Degree 23% 36% Total 100% 100% Military_Family * Voice Crosstabulation % within Voice Voice Island Mainland Military_Family Yes 12% 15% No 88% 85% Total 100% 100% Household_Income * Voice Crosstabulation % within Voice Voice Island Mainland Household_Income $50,000 or less 36% 27% $50,000-$100,000 37% 43% $100,000 or more 27% 30% Total 100% 100%