

Recomendados
Más contenido relacionado
Destacado
Similar a Full cross tabs october 2013
Similar a Full cross tabs october 2013 (20)
Más de Honolulu Civil Beat
Más de Honolulu Civil Beat (20)
Último
Último (14)
Full cross tabs october 2013
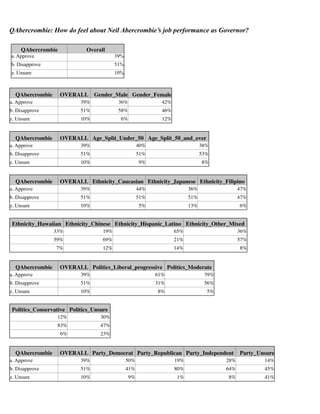
- 1. QAbercrombie: How do feel about Neil Abercrombie’s job performance as Governor? QAbercrombie Overall a. Approve 39% b. Disapprove 51% z. Unsure 10% QAbercrombie OVERALL Gender_Male Gender_Female a. Approve 39% 36% 42% b. Disapprove 51% 58% 46% z. Unsure 10% 6% 12% QAbercrombie OVERALL Age_Split_Under_50 Age_Split_50_and_over a. Approve 39% 40% 38% b. Disapprove 51% 51% 53% z. Unsure 10% 9% 8% QAbercrombie OVERALL Ethnicity_Caucasian Ethnicity_Japanese Ethnicity_Filipino a. Approve 39% 44% 36% 47% b. Disapprove 51% 51% 51% 47% z. Unsure 10% 5% 13% 6% Ethnicity_Hawaiian Ethnicity_Chinese Ethnicity_Hispanic_Latino Ethnicity_Other_Mixed 33% 65% 36% 59% 69% 21% 57% 7% QAbercrombie 19% 12% 14% 8% OVERALL Politics_Liberal_progressive Politics_Moderate a. Approve 39% 61% 39% b. Disapprove 51% 31% 56% z. Unsure 10% 8% 5% Politics_Conservative Politics_Unsure 12% 83% 47% 6% QAbercrombie 30% 23% OVERALL Party_Democrat Party_Republican Party_Independent Party_Unsure a. Approve 39% 50% 19% 28% 14% b. Disapprove 51% 41% 80% 64% 45% z. Unsure 10% 9% 1% 8% 41%
- 2. QAbercrombie OVERALL PhoneType_Both PhoneType_Cell PhoneType_Landline a. Approve 39% 37% 44% 47% b. Disapprove 51% 55% 27% 45% z. Unsure 10% 8% 29% 9% QAbercrombie OVERALL Education_No_degree Education_HS_Graduate a. Approve 39% 55% 29% b. Disapprove 51% 28% 59% z. Unsure 10% 17% 12% Education_College_Graduate Education_SomeColl_Assoc_Voc Education_Graduate_Degree 36% 39% 53% 50% 55% 11% QAbercrombie 43% 7% 6% OVERALL Military_Yes Military_No a. Approve 39% 36% 43% b. Disapprove 51% 58% 45% z. Unsure 10% 6% 12% QAbercrombie OVERALL Union_Yes Union_No a. Approve 39% 29% 44% b. Disapprove 51% 64% 47% z. Unsure 10% 7% 9% QAbercrombie OVERALL Children_Yes Children_No Children_Refused a. Approve 39% 45% 37% 11% b. Disapprove 51% 49% 52% 88% z. Unsure 10% 6% 11% 1% QAbercrombie OVERALL Income_Less_than_50k Income_Fifty_to_100k Income_Over_100k a. Approve 39% 39% 44% 30% b. Disapprove 51% 48% 52% 66% z. Unsure 10% 12% 4% 4% QAbercrombie OVERALL County_CD_Oahu_CD_01 County_CD_Oahu_CD_02 a. Approve 39% 34% 37% b. Disapprove 51% 55% 52% z. Unsure 10% 10% 11%
- 3. County_CD_Hawaii County_CD_Maui County_CD_Kauai 52% 54% 41% 37% 41% 57% 11% 5% 2% QRail: How do you feel about the Honolulu Rail project: do you generally support or oppose it? QRail Overall a. Support 35% b. Oppose 55% c. Does not matter 6% z. Unsure 5% QRail OVERALL Gender_Male Gender_Female a. Support 35% 41% 27% b. Oppose 55% 48% 63% c. Does not matter 6% 9% 5% z. Unsure 5% 2% 6% QRail OVERALL Age_Split_Under_50 Age_Split_50_and_over a. Support 35% 31% 36% b. Oppose 55% 61% 54% c. Does not matter 6% 7% 6% z. Unsure 5% 1% 4% QRail OVERALL Ethnicity_Caucasian Ethnicity_Japanese Ethnicity_Filipino Ethnicity_Hawaiian a. Support 35% 37% 34% 39% 26% b. Oppose 55% 59% 56% 50% 59% c. Does not matter 6% 3% 6% 9% 7% z. Unsure 5% 1% 4% 3% 9% Ethnicity_Chinese Ethnicity_Hispanic_Latino Ethnicity_Other_Mixed 27% 100% 34% 62% 0% 54% 3% 0% 11% 7% 0% 1%
- 4. QRail OVERALL Politics_Liberal_progressive Politics_Moderate Politics_Conservative Politics_Unsure a. Support 35% 37% 33% 29% 37% b. Oppose 55% 53% 59% 59% 53% c. Does not matter 6% 5% 4% 8% 7% z. Unsure 5% 4% 3% 4% 2% QRail OVERALL Party_Democrat Party_Republican Party_Independent Party_Unsure a. Support 35% 41% 15% 37% 13% b. Oppose 55% 49% 75% 58% 69% c. Does not matter 6% 6% 8% 4% 12% z. Unsure 5% 5% 3% 1% 6% QRail OVERALL PhoneType_Both PhoneType_Cell PhoneType_Landline a. Support 35% 36% 36% 20% b. Oppose 55% 56% 54% 58% c. Does not matter 6% 5% 10% 13% z. Unsure 5% 3% 0% 10% QRail OVERALL Education_No_degree Education_HS_Graduate Education_College_Graduate a. Support 35% 32% 29% 36% b. Oppose 55% 48% 52% 54% c. Does not matter 6% 20% 17% 2% z. Unsure 5% 0% 2% 8% Education_SomeColl_Assoc_Voc Education_Graduate_Degree 30% 64% 49% 3% 7% 2% QRail 42% 3% OVERALL Military_Yes Military_No a. Support 35% 39% 28% b. Oppose 55% 52% 62% c. Does not matter 6% 5% 7% z. Unsure 5% 4% 4%
- 5. QRail OVERALL Union_Yes Union_No a. Support 35% 47% 27% b. Oppose 55% 42% 64% c. Does not matter 6% 7% 6% z. Unsure 5% 5% 3% QRail OVERALL Children_Yes Children_No Children_Refused a. Support 35% 39% 32% 16% b. Oppose 55% 50% 59% 72% c. Does not matter 6% 8% 5% 1% z. Unsure 5% 3% 4% 11% QRailCong: Do you believe that when the Rail line is finished, there will be less traffic congestion in Honolulu than we have today? QRailCong Overall a. Yes 26% b. No 56% z. Unsure 18% QRailCong OVERALL Gender_Male Gender_Female a. Yes 26% 30% 20% b. No 56% 54% 60% z. Unsure 18% 16% 21% QRailCong OVERALL Age_Split_Under_50 Age_Split_50_and_over a. Yes 26% 26% 24% b. No 56% 57% 57% z. Unsure 18% 17% 19% QRailCong OVERALL Ethnicity_Caucasian Ethnicity_Japanese Ethnicity_Filipino a. Yes 26% 23% 28% 38% b. No 56% 64% 49% 44% z. Unsure 18% 13% 23% 18% Ethnicity_Hawaiian Ethnicity_Chinese Ethnicity_Hispanic_Latino Ethnicity_Other_Mixed 18% 24% 45% 18% 69% 59% 26% 66% 13% 17% 30% 15%
- 6. QRailCong OVERALL Politics_Liberal_progressive Politics_Moderate Politics_Conservative Politics_Unsure a. Yes 26% 35% 12% 26% 27% b. No 56% 43% 69% 67% 48% z. Unsure 18% 22% 19% 7% 25% QRailCong OVERALL Party_Democrat Party_Republican Party_Independent Party_Unsure a. Yes 26% 33% 15% 14% 7% b. No 56% 51% 66% 68% 49% z. Unsure 18% 16% 19% 19% 44% QRailCong OVERALL PhoneType_Both PhoneType_Cell PhoneType_Landline a. Yes 26% 25% 27% 22% b. No 56% 57% 63% 57% z. Unsure 18% 18% 10% 21% QRailCong OVERALL Education_No_degree Education_HS_Graduate a. Yes 26% 32% 18% b. No 56% 48% 68% z. Unsure 18% 20% 14% Education_College_Graduate Education_SomeColl_Assoc_Voc Education_Graduate_Degree 32% 16% 32% 53% 59% 53% 16% 25% 15% QRailCong OVERALL Military_Yes Military_No a. Yes 26% 25% 25% b. No 56% 60% 53% z. Unsure 18% 16% 22% QRailCong OVERALL Union_Yes Union_No a. Yes 26% 37% 18% b. No 56% 48% 62% z. Unsure 18% 15% 20% QRailCong OVERALL Children_Yes Children_No Children_Refused a. Yes 26% 29% 22% 18% b. No 56% 56% 56% 69% z. Unsure 18% 15% 22% 14%
- 7. QRailUse: How often do you think you would use the Honolulu Rail line? Often, once in a while, or never? QRailUse Overall a. Often 10% b. Once in a while 34% c. Never 50% z. Unsure 6% QRailUse OVERALL Gender_Male Gender_Female a. Often 10% 9% 9% b. Once in a while 34% 44% 26% c. Never 50% 43% 58% z. Unsure 6% 4% 6% QRailUse OVERALL Age_Split_Under_50 Age_Split_50_and_over a. Often 10% 11% 8% b. Once in a while 34% 39% 33% c. Never 50% 48% 53% z. Unsure 6% 2% 6% QRailUse OVERALL Ethnicity_Caucasian Ethnicity_Japanese Ethnicity_Filipino a. Often 10% 7% 6% 36% b. Once in a while 34% 38% 46% 14% c. Never 50% 53% 43% 47% z. Unsure 6% 2% 5% 3% Ethnicity_Hawaiian Ethnicity_Chinese Ethnicity_Hispanic_Latino Ethnicity_Other_Mixed 4% 2% 16% 17% 24% 46% 23% 72% 55% 53% 51% 6% QRailUse 20% 0% 0% 10% OVERALL Politics_Liberal_progressive Politics_Moderate Politics_Conservative Politics_Unsure a. Often 10% 16% 8% 3% 8% b. Once in a while 34% 46% 30% 27% 34% c. Never 50% 31% 61% 64% 52% z. Unsure 6% 7% 1% 6% 6%
- 8. QRailUse OVERALL Party_Democrat Party_Republican Party_Independent Party_Unsure a. Often 10% 12% 3% 9% 1% b. Once in a while 34% 40% 34% 27% 26% c. Never 50% 42% 62% 61% 57% z. Unsure 6% 6% 1% 2% 16% QRailUse OVERALL PhoneType_Both PhoneType_Cell PhoneType_Landline a. Often 10% 9% 20% 10% b. Once in a while 34% 36% 11% 39% c. Never 50% 50% 69% 43% z. Unsure 6% 5% 0% 8% QRailUse OVERALL Education_No_degree Education_HS_Graduate a. Often 10% 24% 7% b. Once in a while 34% 23% 24% c. Never 50% 37% 66% z. Unsure 6% 16% 4% Education_College_Graduate Education_SomeColl_Assoc_Voc Education_Graduate_Degree 9% 11% 27% 45% 41% 58% 41% 48% 6% QRailUse 8% 6% 1% OVERALL Union_Yes Union_No a. Often 10% 8% 11% b. Once in a while 34% 39% 34% c. Never 50% 50% 49% z. Unsure 6% 3% 6% QRailUse OVERALL Children_Yes Children_No Children_Refused a. Often 10% 7% 13% 0% b. Once in a while 34% 37% 38% 4% c. Never 50% 52% 44% 92% z. Unsure 6% 4% 5% 4%
- 9. QMatchup: If you do vote in the Democratic Senate primary between Brian Schatz and Colleen Hanabusa, what would you do? QMatchup Overall a. Schatz 38% b. Hanabusa 36% z. Unsure 26% QMatchup OVERALL Gender_Male Gender_Female a. Schatz 38% 37% 40% b. Hanabusa 36% 33% 38% z. Unsure 26% 29% 23% QMatchup OVERALL Age_Split_Under_50 Age_Split_50_and_over a. Schatz 38% 34% 40% b. Hanabusa 36% 36% 37% z. Unsure 26% 30% 24% QMatchup OVERALL Ethnicity_Caucasian Ethnicity_Japanese Ethnicity_Filipino a. Schatz 38% 55% 27% 31% b. Hanabusa 36% 28% 42% 22% z. Unsure 26% 17% 31% 47% Ethnicity_Hawaiian Ethnicity_Chinese Ethnicity_Hispanic_Latino Ethnicity_Other_Mixed 34% 34% 65% 31% 50% 60% 35% 30% 16% 6% 0% 39% QMatchup OVERALL Politics_Liberal_progressive Politics_Moderate Politics_Conservative Politics_Unsure a. Schatz 38% 42% 44% 29% 22% b. Hanabusa 36% 31% 32% 50% 51% z. Unsure 26% 26% 25% 21% 27% QMatchup OVERALL Party_Democrat Party_Republican Party_Independent Party_Unsure a. Schatz 38% 38% 29% 48% 0% b. Hanabusa 36% 39% 35% 27% 2% z. Unsure 26% 23% 37% 25% 98% QMatchup OVERALL PhoneType_Both PhoneType_Cell PhoneType_Landline a. Schatz 38% 41% 35% 18% b. Hanabusa 36% 38% 48% 22% z. Unsure 26% 21% 17% 60%
- 10. QMatchup OVERALL Education_No_degree Education_HS_Graduate a. Schatz 38% 45% 16% b. Hanabusa 36% 37% 53% z. Unsure 26% 18% 31% Education_College_Graduate Education_SomeColl_Assoc_Voc Education_Graduate_Degree 41% 30% 56% 37% 38% 27% 21% 31% 17% QMatchup OVERALL Military_Yes Military_No a. Schatz 38% 43% 33% b. Hanabusa 36% 37% 37% z. Unsure 26% 20% 30% QMatchup OVERALL Union_Yes Union_No a. Schatz 38% 38% 39% b. Hanabusa 36% 37% 36% z. Unsure 26% 25% 25% QMatchup OVERALL Children_Yes Children_No Children_Refused a. Schatz 38% 49% 31% 24% b. Hanabusa 36% 37% 35% 50% z. Unsure 26% 14% 34% 26% QMatchup OVERALL Income_Less_than_50k Income_Fifty_to_100k Income_Over_100k a. Schatz 38% 26% 44% 43% b. Hanabusa 36% 39% 40% 30% z. Unsure 26% 35% 16% 27% QMatchup OVERALL County_CD_Oahu_CD_01 County_CD_Oahu_CD_02 a. Schatz 38% 34% 50% b. Hanabusa 36% 38% 26% z. Unsure 26% 28% 24% County_CD_Hawaii County_CD_Maui County_CD_Kauai 30% 40% 50% 45% 24% 46% 24% 36% 4%
- 11. QSchatz: Do you generally have a positive or negative opinion of Senator Brian Schatz? QSchatz Overall a. Positive 53% b. Negative 22% z. Unsure 26% QSchatz OVERALL Gender_Male Gender_Female a. Positive 53% 52% 54% b. Negative 22% 26% 17% z. Unsure 26% 22% 29% QSchatz OVERALL Age_Split_Under_50 Age_Split_50_and_over a. Positive 53% 45% 56% b. Negative 22% 24% 20% z. Unsure 26% 31% 24% QSchatz OVERALL Ethnicity_Caucasian Ethnicity_Japanese Ethnicity_Filipino a. Positive 53% 69% 49% 34% b. Negative 22% 20% 13% 29% z. Unsure 26% 11% 38% 38% Ethnicity_Hawaiian Ethnicity_Chinese Ethnicity_Hispanic_Latino Ethnicity_Other_Mixed 41% 35% 65% 40% 39% 30% 3% 35% 20% 35% 33% 25% QSchatz OVERALL Politics_Liberal_progressive Politics_Moderate Politics_Conservative Politics_Unsure a. Positive 53% 64% 48% 41% 35% b. Negative 22% 10% 32% 33% 22% z. Unsure 26% 26% 19% 26% 44% QSchatz OVERALL Party_Democrat Party_Republican Party_Independent Party_Unsure a. Positive 53% 56% 17% 54% 8% b. Negative 22% 18% 48% 34% 1% z. Unsure 26% 27% 34% 12% 91%
- 12. QSchatz OVERALL PhoneType_Both PhoneType_Cell PhoneType_Landline a. Positive 53% 54% 42% 45% b. Negative 22% 21% 30% 26% z. Unsure 26% 25% 28% 29% QSchatz OVERALL Education_No_degree Education_HS_Graduate a. Positive 53% 44% 25% b. Negative 22% 30% 26% z. Unsure 26% 26% 49% Education_College_Graduate Education_SomeColl_Assoc_Voc Education_Graduate_Degree 61% 43% 71% 22% 22% 21% 17% 35% 8% QSchatz OVERALL Military_Yes Military_No a. Positive 53% 55% 50% b. Negative 22% 27% 16% z. Unsure 26% 18% 34% QSchatz OVERALL Union_Yes Union_No a. Positive 53% 54% 53% b. Negative 22% 26% 19% z. Unsure 26% 20% 28% QSchatz OVERALL Children_Yes Children_No Children_Refused a. Positive 53% 63% 47% 32% b. Negative 22% 20% 21% 43% z. Unsure 26% 17% 32% 25% QSchatz OVERALL Income_Less_than_50k Income_Fifty_to_100k Income_Over_100k a. Positive 53% 43% 61% 55% b. Negative 22% 19% 18% 31% z. Unsure 26% 38% 21% 14% QSchatz OVERALL County_CD_Oahu_CD_01 County_CD_Oahu_CD_02 a. Positive 53% 46% 67% b. Negative 22% 21% 21% z. Unsure 26% 33% 12%
- 13. County_CD_Hawaii County_CD_Maui County_CD_Kauai 54% 62% 59% 26% 20% 20% 20% 18% 21% QHanabusa: Do you generally have a positive or negative opinion of First District Congresswoman Colleen Hanabusa? QHanabusa Overall a. Positive 61% b. Negative 26% z. Unsure 13% QHanabusa OVERALL Gender_Male Gender_Female a. Positive 61% 56% 64% b. Negative 26% 32% 21% z. Unsure 13% 12% 15% QHanabusa OVERALL Age_Split_Under_50 Age_Split_50_and_over a. Positive 61% 51% 65% b. Negative 26% 31% 24% z. Unsure 13% 18% 11% QHanabusa OVERALL Ethnicity_Caucasian Ethnicity_Japanese Ethnicity_Filipino a. Positive 61% 53% 72% 56% b. Negative 26% 30% 15% 29% z. Unsure 13% 17% 13% 14% Ethnicity_Hawaiian Ethnicity_Chinese Ethnicity_Hispanic_Latino Ethnicity_Other_Mixed 55% 47% 79% 54% 37% 23% 21% 34% 8% 30% 0% 11% QHanabusa OVERALL Politics_Liberal_progressive Politics_Moderate Politics_Conservative Politics_Unsure a. Positive 61% 62% 56% 51% 74% b. Negative 26% 21% 30% 39% 17% z. Unsure 13% 17% 14% 11% 9%
- 14. QHanabusa OVERALL Party_Democrat Party_Republican Party_Independent Party_Unsure a. Positive 61% 67% 25% 42% 44% b. Negative 26% 21% 41% 46% 1% z. Unsure 13% 12% 34% 12% 54% QHanabusa OVERALL PhoneType_Both PhoneType_Cell PhoneType_Landline a. Positive 61% 60% 47% 63% b. Negative 26% 26% 38% 20% z. Unsure 13% 13% 15% 17% QHanabusa OVERALL Education_No_degree Education_HS_Graduate a. Positive 61% 57% 67% b. Negative 26% 19% 23% z. Unsure 13% 24% 10% Education_College_Graduate Education_SomeColl_Assoc_Voc Education_Graduate_Degree 58% 61% 61% 29% 22% 32% 14% 17% 6% QHanabusa OVERALL Military_Yes Military_No a. Positive 61% 60% 62% b. Negative 26% 31% 21% z. Unsure 13% 10% 17% QHanabusa OVERALL Union_Yes Union_No a. Positive 61% 63% 60% b. Negative 26% 30% 24% z. Unsure 13% 7% 16% QHanabusa OVERALL Children_Yes Children_No Children_Refused a. Positive 61% 64% 60% 42% b. Negative 26% 29% 23% 50% z. Unsure 13% 8% 18% 8% QHanabusa OVERALL County_CD_Oahu_CD_01 County_CD_Oahu_CD_02 a. Positive 61% 64% 53% b. Negative 26% 25% 33% z. Unsure 13% 11% 14%
- 15. County_CD_Hawaii County_CD_Maui County_CD_Kauai 63% 47% 69% 28% 30% 6% 9% 23% 25% QSenSatisfied: Would you be interested in having other candidates to choose from? Or are you satisfied with choosing between Brian Schatz and Colleen Hanabusa? QSenSatisfied Overall a. Other candidates 39% b. Current candidates 57% z. Unsure 4% QSenSatisfied OVERALL Gender_Male Gender_Female a. Other candidates 39% 35% 41% b. Current candidates 57% 60% 56% 4% 5% 3% z. Unsure QSenSatisfied OVERALL Age_Split_Under_50 Age_Split_50_and_over a. Other candidates 39% 43% 36% b. Current candidates 57% 52% 60% 4% 4% 3% z. Unsure QSenSatisfied OVERALL Ethnicity_Caucasian Ethnicity_Japanese Ethnicity_Filipino a. Other candidates 39% 40% 33% 41% b. Current candidates 57% 58% 66% 59% 4% 3% 2% 0% z. Unsure Ethnicity_Hawaiian Ethnicity_Chinese Ethnicity_Hispanic_Latino Ethnicity_Other_Mixed 49% 30% 78% 45% 43% 46% 21% 50% 8% 24% 1% 5% QSenSatisfied OVERALL Politics_Liberal_progressive Politics_Moderate Politics_Conservative Politics_Unsure a. Other candidates 39% 32% 49% 41% 33% b. Current candidates 57% 64% 48% 56% 60% 4% 3% 3% 3% 7% z. Unsure QSenSatisfied OVERALL Party_Democrat Party_Republican Party_Independent Party_Unsure a. Other candidates 39% 32% 88% 50% 56% b. Current candidates 57% 65% 5% 44% 43%
- 16. QSenSatisfied z. Unsure QSenSatisfied OVERALL Party_Democrat Party_Republican Party_Independent 4% OVERALL 3% 7% Party_Unsure 7% 1% PhoneType_Both PhoneType_Cell PhoneType_Landline a. Other candidates 39% 41% 33% 26% b. Current candidates 57% 55% 67% 74% 4% 4% 0% 0% z. Unsure QSenSatisfied OVERALL Education_No_degree Education_HS_Graduate a. Other candidates 39% 39% 36% b. Current candidates 57% 61% 55% 4% 0% 9% z. Unsure Education_College_Graduate Education_SomeColl_Assoc_Voc Education_Graduate_Degree 27% 41% 69% 52% 57% 4% QSenSatisfied 45% 4% 2% OVERALL Military_Yes Military_No a. Other candidates 39% 39% 36% b. Current candidates 57% 56% 62% 4% 5% 2% z. Unsure QSenSatisfied OVERALL Union_Yes Union_No a. Other candidates 39% 37% 38% b. Current candidates 57% 59% 58% 4% 4% 4% z. Unsure QSenSatisfied OVERALL Children_Yes Children_No Children_Refused a. Other candidates 39% 35% 39% 46% b. Current candidates 57% 63% 56% 48% 4% 2% 5% 6% z. Unsure QSenSatisfied OVERALL Income_Less_than_50k Income_Fifty_to_100k Income_Over_100k a. Other candidates 39% 33% 36% 55% b. Current candidates 57% 62% 59% 43% 4% 5% 5% 2% z. Unsure QSenSatisfied OVERALL County_CD_Oahu_CD_01 County_CD_Oahu_CD_02 a. Other candidates 39% 38% 38% b. Current candidates 57% 58% 57%
- 17. QSenSatisfied OVERALL County_CD_Oahu_CD_01 County_CD_Oahu_CD_02 z. Unsure 4% County_CD_Hawaii 4% 5% County_CD_Maui County_CD_Kauai 45% 41% 39% 51% 57% 61% 4% 2% 1% QSSM: How do you feel about the proposal to make same sex marriages legal in Hawaii? QSSM Overall 44% 44% 7% 4% a. Yes b. No c. Does not matter z. Unsure QSSM a. Yes b. No c. Does not matter z. Unsure QSSM a. Yes b. No OVERALL Gender_Male Gender_Female 44% 42% 47% 44% 47% 43% 7% 7% 7% 4% 3% 3% OVERALL Age_Split_Under_50 Age_Split_50_and_over 44% 46% 46% 44% 45% 44% c. Does not matter 7% 6% 7% z. Unsure 4% 3% 3% QSSM a. Yes b. No Ethnicity_Cau Ethnicity_Japan Ethnicity_Filip Ethnicity_Hawai OVERALL casian ese ino ian 44% 54% 49% 28% 34% 44% 38% 42% 53% 56%
- 18. QSSM c. Does not matter z. Unsure Ethnicity_Cau Ethnicity_Japan Ethnicity_Filip Ethnicity_Hawai OVERALL casian ese ino ian 7% 6% 7% 15% 7% 4% 2% 3% 5% 3% Ethnicity_Chin Ethnicity_Hispanic_L Ethnicity_Other_M ese atino ixed 32% 57% 34% 64% 35% 50% 4% 8% 10% 1% 0% 7% QSSM a. Yes b. No c. Does not matter z. Unsure QSSM a. Yes b. No c. Does not matter z. Unsure Politics_Liberal_pr Politics_Moder Politics_Conserva Politics_Unsu OVERALL ogressive ate tive re 44% 76% 45% 15% 29% 44% 18% 43% 81% 48% 7% 5% 10% 2% 13% 4% OVERALL 44% 44% 7% QSSM a. Yes b. No 2% 2% 1% 10% Party_De Party_Republi Party_Independ Party_Unsu mocrat can ent re 61% 11% 35% 19% 27% 84% 59% 50% 8% 3% 5% 10% 4% 3% 2% 1% 22% PhoneType_B OVERALL oth PhoneType_Cell PhoneType_Landline 44% 46% 52% 35% 44% 45% 43% 42% c. Does not matter 7% 6% 4% 11% z. Unsure 4% 2% 0% 11%
- 19. QSSM a. Yes b. No c. Does not matter z. Unsure Education_No_ Education_HS_Grad Education_College_Gra OVERALL degree uate duate 44% 32% 29% 46% 44% 45% 55% 45% 7% 0% 12% 8% 4% 24% 3% 2% Education_SomeColl_Asso Education_Graduate_D c_Voc egree 44% 58% 47% 34% 5% 7% 4% 1% QSSM a. Yes b. No OVERALL Military_Yes Military_No 44% 40% 53% 44% 49% 38% c. Does not matter 7% 8% 5% z. Unsure 4% 2% 4% QSSM a. Yes b. No OVERALL 44% Union_Yes Union_No 39% 49% 44% 49% 42% c. Does not matter 7% 9% 6% z. Unsure 4% 3% 3% QSSM a. Yes OVERALL Children_Yes Children_No 44% 42% 52% Children_Refused 16%
- 20. QSSM b. No OVERALL Children_Yes Children_No 44% 50% 36% Children_Refused 77% c. Does not matter 7% 5% 9% 0% z. Unsure 4% 3% 3% 7% QSSM a. Yes Income_Less_than_ OVERALL 50k Income_50_to_100k Income_Over_100k 44% 44% 47% 48% b. No 44% 49% 44% 44% c. Does not matter 7% 6% 6% 7% z. Unsure 4% 1% 3% 1% QSSM a. Yes County_CD_Oahu_CD_0 OVERALL 1 County_CD_Oahu_CD_02 44% 43% 42% b. No 44% 46% 46% c. Does not matter 7% 7% 9% z. Unsure 4% 5% 3% County_CD_Hawaii 49% County_CD_Maui County_CD_Kauai 47% 51% 43% 44% 31% 6% 7% 11% 2% 2% 7%
- 21. QFaith: How have religious beliefs affected your feelings about same sex marriage? Has religion been a major factor, a minor factor, or not a factor? QFaith a. Major factor b. Minor factor c. Not a factor z. Unsure Overall 26% 19% 50% 5% QFaith a. Major factor OVERALL 26% Gender_Male 26% Gender_Female 27% b. Minor factor 19% 19% 21% c. Not a factor 50% 53% 47% 5% 1% 5% z. Unsure QFaith OVERALL Age_Split_Under_50 Age_Split_50_and_over a. Major factor 26% 28% 26% b. Minor factor 19% 24% 18% c. Not a factor 50% 46% 52% 5% 2% 3% z. Unsure QFaith a. Major factor b. Minor factor Ethnicity_C Ethnicity_Japan Ethnicity_Filip Ethnicity_Hawai OVERALL aucasian ese ino ian 26% 28% 17% 59% 34% 19% 16% 27% 11% 24%
- 22. QFaith c. Not a factor z. Unsure Ethnicity_C Ethnicity_Japan Ethnicity_Filip Ethnicity_Hawai OVERALL aucasian ese ino ian 50% 53% 54% 15% 40% 5% 2% 2% 15% 1% Ethnicity_Chinese Ethnicity_Hispanic_Latino Ethnicity_Other_Mixed 26% 67% 26% 8% 14% 55% 3% QFaith a. Major factor 17% 64% QFaith a. Major factor b. Minor factor c. Not a factor z. Unsure 18% 0% 3% Politics_Liberal_ Politics_Moder Politics_Conserva Politics_Unsu OVERALL progressive ate tive re 26% 18% 18% 52% 26% 19% 16% 27% 24% 11% 50% 63% 54% 23% 55% 5% 3% 1% 1% 8% Party_Repub OVERALL Party_Democrat lican Party_Independent Party_Unsure 26% 22% 47% 22% 38% b. Minor factor 19% 17% 33% 21% 0% c. Not a factor 50% 58% 19% 54% 55% 5% 3% 1% 3% 7% z. Unsure QFaith a. Major factor OVERALL PhoneType_Both 26% 28% PhoneType_Cell PhoneType_Landline 18% 23%
- 23. QFaith b. Minor factor OVERALL PhoneType_Both 19% 21% c. Not a factor 50% 50% 43% 57% 5% z. Unsure QFaith a. Major factor PhoneType_Cell PhoneType_Landline 26% 11% 1% 13% 9% Education_No_ Education_HS_Gradu Education_College_Grad OVERALL degree ate uate 26% 45% 38% 26% b. Minor factor 19% 11% 17% 18% c. Not a factor 50% 33% 42% 52% 5% 10% 4% 3% z. Unsure Education_SomeColl_Assoc_Voc 24% Education_Graduate_Degree 22% 28% 13% 46% 62% 2% 2% QFaith a. Major factor OVERALL Military_Yes Military_No 26% 27% 27% b. Minor factor 19% 20% 20% c. Not a factor 50% 50% 51% 5% 3% 3% z. Unsure
- 24. QFaith a. Major factor OVERALL 26% b. Minor factor 19% 21% 20% c. Not a factor 50% 52% 50% 5% 2% 3% z. Unsure QFaith a. Major factor Union_Yes Union_No 26% 27% OVERALL Children_Yes Children_No 26% 27% 26% Children_Refused 30% b. Minor factor 19% 25% 15% 16% c. Not a factor 50% 45% 55% 49% 5% 2% 3% 6% z. Unsure QFaith a. Major factor Income_Less_than_ OVERALL 50k Income_Fifty_to_100k Income_Over_100k 26% 32% 25% 23% b. Minor factor 19% 19% 21% 26% c. Not a factor 50% 44% 53% 51% 5% 6% 1% 0% z. Unsure
- 25. County_CD_Oahu_CD_ OVERALL 01 26% 26% QFaith a. Major factor County_CD_Oahu_CD_02 22% b. Minor factor 19% 23% 18% c. Not a factor 50% 47% 55% 5% 4% 5% z. Unsure County_CD_Hawaii 34% County_CD_Maui County_CD_Kauai 23% 30% 9% 17% 13% 48% 57% 57% 8% 3% 0% QAttitude: Would you say your views on same-sex marriage have changed during the past year or two, or have they remained the same? QAttitude a. More supportive Overall 20% b. Less supportive 21% c. Same 53% z. Unsure QAttitude a. More supportive 5% OVERALL 20% Gender_Male 18% Gender_Female 22%
- 26. QAttitude b. Less supportive OVERALL 21% Gender_Male 19% Gender_Female 23% 53% 59% 51% 5% 4% 4% c. Same z. Unsure QAttitude a. More supportive OVERALL Age_Split_Under_50 20% 15% Age_Split_50_and_over 22% b. Less supportive 21% 20% 21% c. Same 53% 64% 52% 5% 2% 4% z. Unsure QAttitude a. More supportive Ethnicity_Cauca Ethnicity_Japanes Ethnicity_Filipin OVERALL sian e o 20% 21% 20% 18% b. Less supportive 21% 16% 23% 23% c. Same 53% 62% 55% 40% 5% 1% 2% 19% z. Unsure Ethnicity_Hawai Ethnicity_Chin Ethnicity_Hispanic_L Ethnicity_Other_M ian ese atino ixed 21% 10% 8% 17% 29% 24% 43% 19% 47% 65% 42% 58% 2% 1% 7% 5%
- 27. QAttitude a. More supportive b. Less supportive c. Same z. Unsure QAttitude a. More supportive Politics_Liberal_pro Politics_Moder Politics_Conserva Politics_Uns OVERALL gressive ate tive ure 20% 28% 23% 11% 8% 21% 11% 21% 32% 25% 53% 5% 60% 1% 54% 2% 55% 2% 56% 11% Party_Uns OVERALL Party_Democrat Party_Republican Party_Independent ure 20% 27% 6% 12% 2% b. Less supportive 21% 17% 36% 22% 5% c. Same 53% 53% 57% 64% 80% 5% 3% 2% 2% 13% z. Unsure QAttitude OVERALL a. More supportive 20% PhoneType_Both 20% PhoneType_Cell PhoneType_Landline 9% 16% b. Less supportive 21% 22% 32% 10% c. Same 53% 56% 52% 64% 5% 2% 6% 10% z. Unsure QAttitude a. More supportive OVERALL Education_No_degree Education_HS_Graduate 20% 20% 13% b. Less supportive 21% 45% 40% c. Same 53% 29% 42% 5% 6% 5% z. Unsure
- 28. Education_College_Graduate Education_SomeCol_Assoc_Voc Education_Graduate_Degree 21% 21% 19% 16% 19% 16% 61% 55% 64% 1% 4% 1% QAttitude OVERALL Military_Yes Military_No a. More supportive 20% 20% 19% b. Less supportive 21% 21% 21% c. Same 53% 56% 58% 5% 3% 3% z. Unsure QAttitude OVERALL a. More supportive 20% Union_Yes Union_No 19% 20% b. Less supportive 21% 22% 20% c. Same 53% 57% 56% 5% 2% 3% z. Unsure QAttitude a. More supportive OVERALL Children_Yes Children_No Children_Refused 20% 22% 19% 8% b. Less supportive 21% 24% 17% 28% c. Same 53% 50% 62% 63% 5% 4% 2% 1% z. Unsure
- 29. Income_Less_tha OVERALL n_50k Income_Fifty_to_100k 20% 16% 24% QAttitude a. More supportive Income_Over_100k 23% b. Less supportive 21% 27% 16% 18% c. Same 53% 53% 58% 58% 5% 4% 1% 2% z. Unsure QAttitude a. More supportive b. Less supportive c. Same z. Unsure County_CD_Oahu County_CD_Oahu_C OVERALL _CD_01 D_02 20% 21% 19% 21% 22% 21% 53% 5% 52% 5% 55% 6% County_CD_Hawaii 19% County_CD_Maui County_CD_Kauai 22% 24% 14% 20% 22% 59% 54% 50% 8% 4% 4% QPressure: With public support of same sex marriage increasing over the past few years, have you ever felt pressured to say you support same sex marriage more than you actually do? QPressure a. Pressured b. Not Pressured z. Unsure Overall 15% 76% 8%
- 30. QPressure a. Pressured OVERALL Gender_Male Gender_Female 15% 15% 16% b. Not Pressured 76% QPressure a. Pressured 6% 7% OVERALL Age_Split_Under_50 Age_Split_50_and_over 15% 21% 14% b. Not Pressured 76% 74% 79% 8% z. Unsure QPressure a. Pressured 76% 8% z. Unsure 79% 4% 7% Ethnicity_Caucasia Ethnicity_Filipin OVERALL n Ethnicity_Japanese o 15% 16% 14% 14% b. Not Pressured 76% 82% 80% 65% z. Unsure 8% 2% 5% 21% Ethnicity_Hawaii Ethnicity_Chine Ethnicity_Hispanic_Lat Ethnicity_Other_Mix an se ino ed 27% 17% 24% 14% 69% 55% 73% 4% QPressure a. Pressured b. Not Pressured z. Unsure 80% 3% 21% 13% Politics_Liberal_pr Politics_Moder Politics_Conserva Politics_Unsu OVERALL ogressive ate tive re 15% 16% 18% 20% 9% 76% 82% 78% 74% 74% 8% 3% 4% 6% 17%
- 31. QPressure a. Pressured Party_Dem Party_Republic Party_Independe Party_Unsur OVERALL ocrat an nt e 15% 13% 20% 21% 13% b. Not Pressured 76% 81% 77% 70% 74% z. Unsure 8% 5% 3% 9% 13% QPressure a. Pressured PhoneType_B PhoneType_Landlin OVERALL oth PhoneType_Cell e 15% 18% 0% 12% b. Not Pressured 76% 78% 100% 68% z. Unsure 8% 4% 0% 20% QPressure a. Pressured Education_No_degr OVERALL ee Education_HS_Graduate 15% 33% 13% b. Not Pressured 76% 44% 79% z. Unsure 8% 23% 8% Education_College_Gra Education_SomeColl_Asso Education_Graduate_D duate c_Voc egree 10% 18% 21% 86% 73% 78% 4% 9% 1% QPressure a. Pressured b. Not Pressured z. Unsure OVERALL Military_Yes Military_No 15% 19% 13% 76% 75% 81% 8% 6% 6%
- 32. QPressure a. Pressured OVERALL 15% b. Not Pressured 76% 75% 79% 8% 6% 6% z. Unsure QPressure a. Pressured Union_Yes Union_No 19% 15% Children_ OVERALL Children_Yes No Children_Refused 15% 21% 12% 16% b. Not Pressured 76% 72% 83% 83% z. Unsure 8% 7% 5% 1% QPressure a. Pressured Income_Less_than Income_Fifty_to_10 Income_Over_10 OVERALL _50k 0k 0k 15% 19% 14% 20% b. Not Pressured 76% 73% 81% 78% z. Unsure 8% 8% 5% 2%
- 33. QPressure a. Pressured County_CD_Oahu_C County_CD_Oahu_CD_ OVERALL D_01 02 15% 19% 12% b. Not Pressured 76% 73% 81% z. Unsure 8% 8% 7% County_CD_Hawaii 14% County_CD_Maui 11% County_CD_Kauai 2% 74% 84% 92% 12% 6% 6%