The Woodlands Q3 2016 Office Snapshot
•
0 recomendaciones•117 vistas

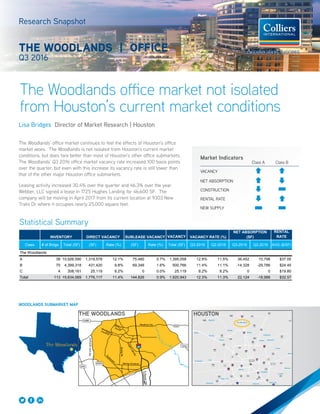
The Woodlands office market not isolated from Houston's current market conditions

Recomendados
Recomendados
Más contenido relacionado
La actualidad más candente
La actualidad más candente (16)
Destacado
Destacado (20)
Similar a The Woodlands Q3 2016 Office Snapshot
Similar a The Woodlands Q3 2016 Office Snapshot (20)
Más de Colliers International | Houston
Más de Colliers International | Houston (20)
Último
Último (20)
The Woodlands Q3 2016 Office Snapshot
- 1. Market Indicators Class A Class B VACANCY NET ABSORPTION CONSTRUCTION RENTAL RATE NEW SUPPLY Galveston Bay 225Bellaire The Woodlands Humble Pasadena IAH EFD HOU Cypress Tomball Katy Brookshire Lake Houston La Porte 146 League City Kingwood Atascocita Spring Pearland 35 35 Richmond Waller Hockley 242 1488 1488 Conroe Magnolia Willis Lake Conroe Crosby CBD Ship Channel Clear Lake Baytown Mont Belvieu Dayton 149 149 Cleveland 105 105 105 321 330 Alvin Hitchcock Texas City Sugar Land The Woodlands office market not isolated from Houston’s current market conditions Research Snapshot THE WOODLANDS | OFFICE Q3 2016 Statistical Summary 1488 2920 249 1314 242 Huffsmith-Kohrville WoodlandsParkway ResearchForest Needham Rd. Grogan’sMillRd. Spring Stuebner GoslingRd. Kuykendahl ToHoustonCBD WOODLANDS SUBMARKET MAP VACANCY RENTAL RATE Class # of Bldgs. Total (SF) (SF) Rate (%) (SF) Rate (%) Total (SF) Q3-2016 Q2-2016 Q3-2016 Q2-2016 AVG ($/SF) The Woodlands A 39 10,926,590 1,319,578 12.1% 75,480 0.7% 1,395,058 12.8% 11.5% 36,452 10,798 $37.05 B 70 4,399,318 431,420 9.8% 69,346 1.6% 500,766 11.4% 11.1% -14,328 -29,786 $24.45 C 4 308,161 25,119 8.2% 0 0.0% 25,119 8.2% 8.2% 0 0 $19.80 Total 113 15,634,069 1,776,117 11.4% 144,826 0.9% 1,920,943 12.3% 11.3% 22,124 -18,988 $32.57 INVENTORY DIRECT VACANCY SUBLEASE VACANCY VACANCY RATE (%) NET ABSORPTION (SF) The Woodlands’ office market continues to feel the effects of Houston’s office market woes. The Woodlands is not isolated from Houston’s current market conditions, but does fare better than most of Houston’s other office submarkets. The Woodlands’ Q3 2016 office market vacancy rate increased 100 basis points over the quarter, but even with this increase its vacancy rate is still lower than that of the other major Houston office submarkets. Leasing activity increased 30.4% over the quarter and 46.3% over the year. Webber, LLC signed a lease in 1725 Hughes Landing for 46,600 SF. The company will be moving in April 2017 from its current location at 9303 New Trails Dr where it occupies nearly 25,000 square feet. Lisa Bridges Director of Market Research | Houston HOUSTONTHE WOODLANDS
- 2. 2 The Woodlands Research Snapshot | Q3 2016 | Office | Colliers International2 The average quoted rental rates are a mix of direct and sublet rates and are based on a blend of gross and NNN. The graphs below are only intended to show rental rate trends. Actual gross rates are higher than the average rate shown in the graph. 4.00% 6.00% 8.00% 10.00% 12.00% 14.00% 16.00% 18.00% $18.00 $19.00 $20.00 $21.00 $22.00 $23.00 $24.00 $25.00 $26.00 $27.00 $28.00 Class B Rental Rate and Vacancy Percentage The Woodlands, TX Class B Rents Class B Vacancy *Vacancy percentage includes direct and sublease space. 0 50,000 100,000 150,000 200,000 250,000 300,000 350,000 Available Sublease Space - The Woodlands Class A Class B Available Sublease Space Q3 2016 Class A: 277,680 SF or 2.5% 0.0% 2.0% 4.0% 6.0% 8.0% 10.0% 12.0% 14.0% 16.0% 18.0% $25.00 $27.00 $29.00 $31.00 $33.00 $35.00 $37.00 $39.00 Class A Rental Rate and Vacancy Percentage The Woodlands, TX Class A Rents Class A Vacancy *Vacancy percentage includes direct and sublease space.
- 3. 3 North American Research & Forecast Report | Q4 2014 | Office Market Outlook | Colliers International Copyright © 2015 Colliers International. The information contained herein has been obtained from sources deemed reliable. While every reasonable effort has been made to ensure its accuracy, we cannot guarantee it. No responsibility is assumed for any inaccuracies. Readers are encouraged to consult their professional advisors prior to acting on any of the material contained in this report. Colliers International | Market 000 Address, Suite # 000 Address, Suite # +1 000 000 0000 colliers.com/<<market>> FOR MORE INFORMATION Lisa Bridges Director of Market Research | Houston +1 713 830 2125 lisa.bridges@colliers.com 3 North American Research & Forecast Report | Q4 2014 | Office Market Outlook | Colliers International Copyright © 2015 Colliers International. The information contained herein has been obtained from sources deemed reliable. While every reasonable effort has been made to ensure its accuracy, we cannot guarantee it. No responsibility is assumed for any inaccuracies. Readers are encouraged to consult their professional advisors prior to acting on any of the material contained in this report. Colliers International | Market 000 Address, Suite # 000 Address, Suite # +1 000 000 0000 colliers.com/<<market>> 3 North American Research & Forecast Report | Q4 2014 | Office Market Outlook | Colliers International Copyright © 2015 Colliers International. The information contained herein has been obtained from sources deemed reliable. While every reasonable effort has been made to ensure its accuracy, we cannot guarantee it. No responsibility is assumed for any inaccuracies. Readers are encouraged to consult their professional advisors prior to acting on any of the material contained in this report. Colliers International | The Woodlands 1790 Hughes Landing Blvd., Suite 250 The Woodlands, TX 77380 +1 713 830 4011 colliers.com/thewoodlands Absorption and New Supply Woodlands Class A Office Woodlands Class B Office -200,000 0 200,000 400,000 600,000 800,000 1,000,000 1,200,000 1,400,000 1,600,000 1,800,000 2,000,000 Net Absorption New Supply -150,000 -100,000 -50,000 0 50,000 100,000 150,000 200,000 Net Absorption New Supply